

SUMMARY
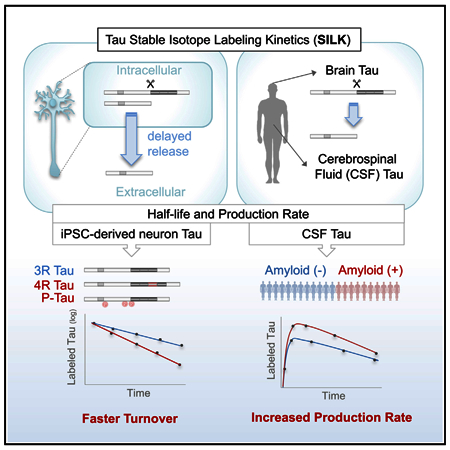
We developed stable isotope labeling and mass spectrometry approaches to measure the kinetics of multiple isoforms and fragments of tau in the human central nervous system (CNS) and in human induced pluripotent stem cell (iPSC)-derived neurons. Newly synthesized tau is truncated and released from human neurons in 3 days. Although most tau proteins have similar turnover, 4R tau isoforms and phosphorylated forms of tau exhibit faster turnover rates, suggesting unique processing of these forms that may have independent biological activities. The half-life of tau in control human iPSCderived neurons is 6.74 ± 0.45 days and in human CNS is 23 ± 6.4 days. In cognitively normal and Alzheimer’s disease participants, the production rate of tau positively correlates with the amount of amyloid plaques, indicating a biological link between amyloid plaques and tau physiology.
Graphical Abstract
In Brief
Sato et al. show that stable isotope labeling kinetics enable measurement of tau in the CNS and in iPSC-derived neurons. Specific forms of tau are uniquely processed in neurons and tau production rates correlate with amyloid accumulation in human subjects.
INTRODUCTION
Tau is predominantly an intracellular soluble protein that associates with and stabilizes microtubules in axons. Previous reports of elevated cerebrospinal fluid (CSF) tau concentrations after acute stroke (Hampel et al., 2010; Hesse et al., 2001) suggest that tau can be passively released into the extracellular space due to cell death or injury. However, recent studies indicate that tau is also actively secreted into the extracellular space in a regulated manner under physiological and pathological conditions (Karch et al., 2012; Pooler et al., 2013; Yamada et al., 2011, 2014). Furthermore, growing evidence suggests that tau is a kinetically dynamic protein, including the degradation and clearance of tau by microglia in vitro (Luo et al., 2015; Funk et al., 2015), spreading of tau in anatomically connected areas in disease (de Calignon et al., 2012; Iba et al., 2013; Liu et al., 2012), and trans-synaptic propagation of tau in a prion like manner (Frost et al., 2009; Kfoury et al., 2012; Sanders et al., 2014; Wu et al., 2016).
Tauopathies, including Alzheimer’s disease (AD), corticobasal degeneration (CBD), progressive supranuclear palsy (PSP), and frontotemporal dementia (FTD), affect millions of patients worldwide. The characteristic pathological hallmark of tauopathies is increased deposition of aggregated tau in the brain. Tau is spliced into six major isoforms that differ based on inclusion of exons 2 and 3 at the N terminus and the inclusion of exon 10 in the microtubule-binding region (MTBR) (0N3R, 1N3R, 2N3R, 0N4R, 1N4R, and 2N4R). Tauopathies are classified as 3R, 4R, or mixed tauopathies based on the presence of tau isoforms within the aggregates (Buée et al., 2000). However, the processing and turnover of these specific isoforms remain poorly understood. Some tauopathies also exhibit alterations of tau concentrations in the CSF. Both total and phosphorylated tau (p-tau) are increased in the CSF of AD patients and predict the order and magnitude of pathologic processes that occur in AD (Bateman et al., 2012; Fagan et al., 2014; Toledo et al., 2013). However, it is not clear whether elevated CSF tau is primarily due to increased passive release of tau due to dying neurons, active tau over-production (synthesis and release), or tau decreased clearance.
Tau-targeted therapies have recently emerged as potential strategies for treating AD and PSP patients. For example, in 2013, a vaccine targeting modified forms of tau, AADvac-1 (NCT01850238 and NCT02031198), entered into Phase 1 trials. Other strategies include antisense oligonucleotides to decrease tau production (DeVos et al., 2013, 2017) and monoclonal antibodies that bind various forms of tau (Bright et al., 2015; Yanamandra et al., 2013) (NCT02460094). These tau-targeted therapies are expected to modify tau production or clearance rates. However, without pharmacodynamic studies in humans, we are limited in our ability to assess the degree and timing of target engagement. Past attempts to quantify tau kinetics have used mouse models of tauopathy paired with chemical or genetic approaches to trace tau turnover and predict that tau half-life is between t1/2 = 10 and 30 days (Price et al., 2010; Yamada et al., 2014, 2015). However, these approaches largely rely on inhibiting new protein production and tracing the clearance of the remaining pool of tau protein. Because tau is a long-lived protein, these approaches may not be sufficiently sensitive and quantitative. Furthermore, to date, tau kinetics have not been studied in humans.
We developed a stable isotope labeling kinetics (SILK) method that measures tau turnover rate and half-life in the human CNS and in cellular models. This method employs labeling of cells or research participants with a stable isotopically labeled tracer,13C6-leucine, and quantifying its incorporation into CNS proteins over time (Bateman et al., 2006). We first demonstrate that while tau in the human brain is a mixture of full-length and C-terminally truncated forms, CSF tau is primarily C-terminally truncated. Applying SILK to human induced pluripotent stem cell (iPSC)-derived neurons in a translational cellular model, we found that the half-lives of intracellular and extracellular tau were similar. We observed a 3-day delay in the release of newly synthesized labeled tau, suggesting this release is actively regulated. This time-dependent release is specific to truncated tau, as extracellular full-length tau does not show a delay in the appearance of labeled species in the culture media. Interestingly, 4R tau isoforms and phosphorylated tau species have faster tau turnover rates and shorter half-lives than 3R isoforms and unphosphorylated tau, suggesting that the cell metabolizes aggregation-prone tau species differently than other forms of tau. We report the first human CNS tau kinetics in ten healthy participants (tau turnover rate: 0.0323 ± 0.00914 pool/day, t1/2 = 23.0 ± 6.4 days), including evidence of consistent labeling and kinetics in a human brain study. We also demonstrate that tau production rate in the CSF positively correlates with amyloidosis in AD patients. Results from these studies provide insights into the pathological alterations in tau metabolism as well as normal physiological turnover of tau and isoforms that will inform pathophysiologic studies and future clinical trials (e.g., the timing of CSF collection after anti-tau intervention).
RESULTS
Tau Is Specifically Truncated in the Human CNS and in Neurons
First, we used quantitative mass spectrometry (MS) of tau peptides at high sequence coverage together with immunopurification (IP) to determine the abundance of tau isoforms including truncated species in the human brain and CSF (Figures 1A–1C). Detergent-soluble fractions of tau were isolated from one human brain with no neurodegenerative pathology and two human CSF samples from cognitively normal controls. Eight tau antibodies with epitopes located across the tau protein (Carmel et al., 1996; Horowitz et al., 2004, 2006; Liu et al., 1993; Szendrei et al., 1993) were used to define the tau profiles in human brain and CSF (Figure 1A). We replicated our findings in an additional 10 human brains and CSF from 29 cognitively normal controls using Tau1 (epitope 192–9 antibody; Figure S1A).
Figure 1. Tau Profiles in the Human CNS and Neurons.

(A)Schematic of the longest tau isoform (2N4R), fragments detected by MS, and epitopes of tau antibodies.
(B–E) Quantitation of tau peptides in the human brain (B), normal control CSF (C), cell lysates (D), and media (E) from iPSC-derived neurons. Brain tau (B) and cellular tau (D) are a mixture of full-length and C-terminally truncated tau. CSF tau (C) is truncated at the end of the mid-domain (between amino acids 222 and 225). Extracellular tau from iPSC-derived neurons (E) is primarily C-terminally truncated. Intracellular tau from iPSC-derived neurons was diluted to match extracellular tau level. Red dashed lines indicate 4R-containing peptides in the microtubule-binding region (MTBR). Blue dashed lines indicate 1N- and 2N-containing peptides.
Data are represented as mean ± SD. See also Figures S1–S3.
In the brain, we quantified 20 tau peptides across the tau protein, including common peptides and peptides specific to 0N-, 1N-, 2N-, 3R-, and 4R-specific tau isoforms (Figure 1B). 2N-specific peptides (residues 68–87 and 88–126) were detected at extremely low levels, and a peptide shared among 1N and 2N isoforms (residues 45–67) was also lower than other common peptides (5.3% ± 1.5% and 21.7% ± 2.1% of the average of mid-domain common peptides [residues 354–406], respectively), suggesting that these regions are missing or chemically modified. Full-length tau was detected with C terminus tau peptides immunocaptured using N terminus and mid-domain tau antibodies or detected with N terminus and mid-domain tau peptides immunocaptured using C terminus antibodies. We calculate that 76.0% ± 8.4% of tau in the human brain is full-length tau, while 24.0% ± 8.4% is C-terminally truncated based on calculations of the average of mid-domain peptides (residues 151–230) divided by the sum of mid-domain peptides and C-terminal peptides (residues 354–406; Figure S1B). In contrast, in the CSF, the predominant form of tau (99.9% ± 0.063%) contained the mid-domain but lacked the MTBR and C terminus peptides (Figure S1C). Peptide recovery dramatically decreased after residue 222, then disappeared after residue 268, indicating the protein domain at the C terminus of this truncation is missing in the CSF (Figures 1C and S1D). Unlike in the brain, the Tau 5 antibody only captured a low amount of mid-domain peptides in the CSF, suggesting that major cleavage occurs within Tau 5 epitope (residues 210–230). The absolute concentration of CSF tau increases with age (p = 0.0009, F = 9.28, Df = 26), but the relative abundance of tau peptides across the protein remains similar (Figure S1E).
Neurons differentiated from human iPSCs represent an opportunity to model disease and to screen therapeutics in human cells affected in tauopathies. To evaluate whether intracellular and extracellular tau produced and released from iPSC-derived neurons recapitulates the differential tau profiles observed in the human brain and CSF, respectively, we performed IP-MS in the cells and media (Figures 1D and 1E). iPSCs were obtained from cognitively normal controls, differentiated into cortical neurons, and matured for 6 weeks (Figure S2). We found that the intracellular tau profile was largely similar to the tau profile observed in the human brain (Figure S3). However, 4R tau isoforms were approximately two orders of magnitude less abundant than common peptides. This is consistent with previous findings that iPSC-derived neurons express predominantly 3R tau isoforms (Ehrlich et al., 2015; Sposito et al., 2015). The extracellular tau from the media contained a lower abundance of MTBR and C terminus tau peptides than we detected in the intracellular fraction, consistent with the tau peptide profile in human CSF (Figures 1D, 1E, S3B, and S3D). However, unlike CSF, the extracellular media from iPSC-derived neurons contained a small amount of full-length tau that may have resulted from cell death that occurs at a certain rate in culture. In total, we show that the tau truncation profile in human tissue (CSF and brain) is highly similar to the profile observed in human iPSC-derived neurons, in spite of the relative immaturity of these cultures. Thus, this system may serve as a system for translational studies.
Tau SILK
In order to understand how tau fragments are metabolized in vitro and in vivo, we developed the SILK method for monitoring tau production and clearance rates (Figure S4).We estimated the labeling of tau in the human CNS would be low due to the slow turnover rate of tau in animal models (Price et al., 2010; Yamada et al., 2015). Therefore, we optimized the analytical methods using human CSF with the ultimate goal of applying tau SILK methods in the human CNS and in vitro.
First, we identified leucine-containing peptides in tau that produce the most robust MS signal and are representative of other tau peptides. We found that the most abundant and reproducible MS signal resulted from using a Tau1 mid-domain tau antibody (epitope; residues 192–199) for immunoprecipitation, and MS detection of TPSLPTPPTR peptide (residues 212–221) (Figures 1C and S4A–S4C). This peptide was robustly detected in human brains, CSF, and iPSC-derived neurons in our study (Figures 1 and S1) and in previous MS studies of tau (Barthélemy et al., 2016; Hanger et al., 1998; Mair et al., 2016; McAvoy et al., 2014; Portelius et al., 2008; Silva et al., 2016). TPSLPTPPTR peptide is also common to all tau isoforms and was previously shown to increase 1.7-fold in AD (McAvoy et al., 2014).
The sensitivity of the SILK method was assessed using an enrichment standard curve for the TPSLPTPPTR peptide (Figure S4D). The standard curve demonstrated a linear correlation between the predicted and measured percent tracer-to-tracee ratio (TTR; R2 = 0.99; slope = 1.22). We tested enrichment standards in diluted media (down to 0.01% TTR, coefficient of variation [CV] > 30% below 0.04% TTR), and 0.1% TTR was the lowest enrichment that we could achieve while maintaining high confidence (<5% CV). In CSF samples obtained from participants administered 13C6-leucine, we have confidently (<5% CV) measured as low as 0.25% TTR. When measuring as low as 0.15% TTR, variation increases (17% CV). In summary, this MS method can detect 0.1% 13C6-leucine labeled tau in 100 pg/mL tau peptide (TPSLPTPPTR) in the CSF, which corresponds to 100 fg/mL isotopically labeled tau peptide with an intraday CV of <5%, representing a 20-fold increase in sensitivity relative to prior methods (Barthélemy et al., 2016; McAvoy et al., 2014).
Differential Tau Kinetics in iPSC-Derived Neurons
To establish a translational model to study tau kinetics and test the feasibility of the tau SILK method in vitro, the iPSC-derived neurons were labeled with 50% mol (100% TTR) 13C6-leucine for 2 weeks (equivalent to a pulse phase) and then cultured in label-free cortical maturation media for 3 weeks (equivalent to a chase phase) (Figure 2A). Tau concentrations in the cell lysate and in the culture media were stable throughout the experiment (Figures S2G and S2H).
Figure 2. Differential Tau Kinetics of Tau Isoforms in iPSC-Derived Neurons.

(A) A diagram illustrating the in vitro tau SILK protocol. iPSCs were converted into neural precursor cells (NPCs) and differentiated into iPSC-derived neurons for 4 weeks. iPSC-derived neurons were pre-labeled with 50 mol % (100% TTR) 13C6-leucine for 2 weeks from week 4 to 6 (pulse). iPSC-derived neurons were cultured in label-free media for 21 days (chase). Cells and media were collected every 3 days.
(B) Kinetic profiles of tau (TPSLPTPPTR) peptides in the cells and in the media. There is a 3-day delay in the newly translated tau released from the intracellular to extracellular space.
(C) Kinetic profiles of intracellular peptides.
(D) C terminus (C term) peptides have faster turnover and significantly shorter half-lives (p = 0.0003; F = 9.48; Df = 39).
(E) Kinetic profiles of extracellular peptides. N terminus, mid-domain, and N terminus of microtubule-binding region (N term to MTBR-N) peptides have similar kinetic profiles. Full-length tau containing C terminus (C term) does not have a 3-day time delay and has a similar kinetic profile as intracellular full-length tau. C terminus of microtubule-binding region (MTBR-C) is released with 3-day time delay and has a shorter half-life than N term to MTBR-N tau (p < 0.0001; F = 18.28; Df = 30).
(F) MTBR-C and C term tau peptides have significantly shorter half-lives than N term to MTBR-N tau (p = 0.0033; F = 18.28, Df = 30).
(G and H) 4R tau isoform-specific peptides (LDL and HVPGG; see Table 1 for abbreviations) have faster turnover and shorter half-lives in the cell lysates compared to the 3R (p = 0.0007; F = 5.455; Df = 29).
(I and J) Phosphorylated tau at T217 (pTPSL 217) has a faster turnover and shorter half-life compared to unphosphorylated tau in the cell lysate (p = 0.0057; F = 8.5; Df = 10). Significance was determined via one-way ANOVA with Tukey’s post hoc test. *p % 0.05.
Data are represented as mean ± SD. See also Tables 1 and 2 and Figures S4 and S5.
We captured tau kinetics by monitoring 16 intracellular tau peptides and 14 extracellular tau peptides (Figure S5; Table 1). Overall, the labeling of intracellular and extracellular tau demonstrated that tau is slowly turned over during the 21-day chase (Figures 2B and S5A–S5D). In the media, we observed an increase in the abundance of 13C6-leucine-labeled tau peptides 3 days after labeling was stopped, before it began to decrease.
Table 1.
Summary of Tau Peptides and Half-Lives in the iPSC-Derived Neurons
| Peptide (Abbreviated) | Peptide (Full) | Domain | Am in o Acids | Intracellular Half-Life (Days) | N | Extracellular Half-Life (Days) | N | ||
|---|---|---|---|---|---|---|---|---|---|
| Mean | SD | Mean | SD | ||||||
| QEFE | QEFEVMEDHAGTYGLGDR | N term | 6–23 | 6.44 | 0.32 | 4 | 6.35 | 1.17 | 4 |
| DHAGTY | DHAGTYGLG | N term | 13–21 | 6.47 | 0.89 | 2 | 7.50 | 0.79 | 2 |
| DQGGYT | DQGGYTMHQDQEGDTDAGLK | N term | 25–44 | 5.09 | 0.36 | 2 | 3.69 | N/A | 1 |
| 0N | AEEAGIGDTPSLEDEAAGHVTQAR | 0N | 103–126 | 6.81 | 0.67 | 4 | 6.36 | 0.88 | 4 |
| DTPSLE | DTPSLE | Mid | 110–115 | 6.32 | 0.65 | 2 | 6.85 | 0.63 | 4 |
| TPSL | TPSLPTPPTR | Mid | 212–221 | 7.84 | 0.66 | 4 | 6.77 | 1.49 | 4 |
| LQTA | LQTAPVPMPDLK | MTBR-N | 243–254 | 6.45 | 0.71 | 4 | 6.64 | 0.85 | 2 |
| IGST | IGSTENLK | MTBR-N | 260–267 | 6.56 | 0.67 | 4 | 6.99 | 0.62 | 2 |
| LDL 4R | LDLSNVQSK | 4R | 282–290 | 3.57 | 0.20 | 2 | N/A | N/A | 0 |
| HVPGG 4R | HVPGGGSVQIVYK | 4R | 299–311 | 4.34 | 0.37 | 2 | N/A | N/A | 0 |
| 3R | VQIVYKPVDLSK | 3R | 306–317 | 6.98 | 0.72 | 4 | 7.34 | 0.94 | 4 |
| DRVQSK | DRVQSKIGSL | MTBR-C | 348–357 | 6.08 | 1.16 | 2 | 4.24 | 1.77 | 2 |
| IGSL | IGSLDNITHVPGGGNK | MTBR-C | 354–369 | 6.38 | 0.97 | 4 | 5.24 | 0.33 | 2 |
| DTSPR | DTSPRHLSNVSSTGSI | Cterm | 402–417 | 4.93 | 0.51 | 2 | 2.52 | N/A | 1 |
| DSPQL | DSPQLATLA | Cterm | 421–429 | 6.10 | 1.12 | 2 | 5.41 | 0.04 | 2 |
| DEVSAS | DEVSASLAKQGL | Cterm | 430–441 | 4.75 | 0.96 | 2 | 3.33 | 0.42 | 2 |
| Mean all | 5.95 | 1.11 | 5.68 | 1.62 | |||||
| Mean N term to MTBR-N (without DQGGY) | 6.70 | 0.53 | 6.78 | 0.40 | |||||
| Mean MTBR-C | 6.23 | 0.21 | 4.74 | 0.70 | |||||
| Mean C term | 5.26 | 0.73 | 3.75 | 1.49 | |||||
N/A, not available due to limit of detection; MTBR, microtubule-binding region; SD, standard deviation; N represents number of cell lines analyzed.
This delay in the appearance of labeled tau in the media implicates a time-dependent release of newly synthesized tau into the extracellular space.
Next, we examined the kinetics of specific tau peptides. We found that the N terminus, mid-domain, and N terminus of MTBR (MTBR-N) tau peptides had similar half-lives inside and outside the cell (intracellular t1/2 = 6.70 ± 0.53 days; extracellular t1/2 = 6.78 ± 0.40 days) (Figures 2C–2F, S5C, and S5D; Table 1). These findings indicate that tau half-life is kinetically determined by tau metabolism occurring inside the cell. An exception was the DQGGYT peptide (residues 25–44), which is immediately N terminus to the 1N and 2N tau isoform-specific domains. The DQGGYT peptide had shorter half-lives (intracellular t1/2 = 5.09 ± 0.36 days; extracellular t1/2 = 3.69 days). Notably, we did not observe a 3-day time delay in the kinetic profile of the peptides containing the C terminus of tau (Figure 2E), suggesting that full length tau does not undergo a time-dependent release as was observed for truncated forms. Furthermore, full-length tau was turned over more quickly than truncated tau both inside and outside the cell (intracellular t1/2 = 5.26 ± 0.73 days; extracellular. t1/2 = 3.75 ± 1.49 days). We also observed differences in the kinetics of truncated forms of tau. Two extracellular tau peptides (residues 348–353 and 354–369) C-terminal of MTBR (MTBR-C) had shorter half-lives (t1/2 = 4.74 ± 0.70 days) than mid-domain peptides (t1/2 = 6.78 ± 0.40 days) but longer half-lives than the C terminus peptides (t1/2 = 3.75 ± 1.49 days). This implicates differential proteolytic processing of tau during or after secretion, specific to truncated forms containing MTBR-C.
Interestingly, we observed isoform-specific differences in intracellular tau turnover in iPSC-derived neurons (Figures 2G and 2H).The half-lives of peptides specific to 4R tau (LDLSNVQSK, t1/2 = 3.57 ± 0.20 days; HVPGGGSVQIVYKPVDLSK, t1/2 = 4.34 ± 0.37 days) were significantly shorter than a 3R-specific tau peptide (VQIVYKPVDLSK, t1/2 = 6.96 ± 0.72 days; Table 1). We also examined turnover of leucine-containing phosphorylated tau peptides (Figures 2I and 2J; Table 2). We found that phosphorylated tau peptides have shorter half-lives (average t1/2 = 5.16 ± 1.28 days) compared to their corresponding unphosphorylated tau peptides (average t1/2 = 6.84 ± 1.24 days). TPSLPTPPTR peptides phosphorylated at residue 217 had a significantly shorter half-life (t1/2 = 4.96 ± 0.36 days) compared to unphosphorylated TPSLPTPPTR peptides (t1/2 = 8.13 ± 0.98 days) or TPSLPTPPTR peptides phosphorylated at 212 or 214 (t1/2 = 6.64 ± 0.51 days). These findings suggest that cells differentially metabolize tau isoforms and phosphorylated tau.
Table 2.
Summary of Tau and Phosphorylated Peptides and Half-Lives in the Cell Lysates of iPSC-Derived Neurons
| Peptide (Abbreviated) | Peptide (Full) | Domain | Ami no Acids | Half-Life (Days) | N | |
|---|---|---|---|---|---|---|
| Mean | SD | |||||
| 0N | AEEAGIGDTPSLEDEAAGHVTQAR | N term | 103–126 | 7.23 | 1.01 | 4 |
| p0N | AEEAGIGDT*PS*LEDEAAGHVT*QAR (any) | N term | 103–126 | 6.00 | 0.29 | 4 |
| TPSL | TPSLPTPPTR | Mid | 212–221 | 8.13 | 0.98 | 4 |
| pTPSL 212/214 | T*PS*LPTPPTR (either) | Mid | 212–221 | 6.64 | 0.51 | 4 |
| pTPSL 217 | TPSLPT*PPTR | Mid | 212–221 | 4.96 | 0.36 | 4 |
| TPSL REPK | TPSLPTPPTREPK | Mid | 212–224 | 7.97 | 0.35 | 4 |
| pTPSLREPK 212 | T*PSLPTPPTREPK | Mid | 212–224 | 5.33 | 1.84 | 4 |
| pTPSLREPK 214 | TPS*LPTPPTREPK | Mid | 212–224 | 6.43 | 1.27 | 4 |
| pTPSLREPK 217 | TPSLPT*PPTREPK | Mid | 212–224 | 5.43 | 0.28 | 4 |
| IGST | IGSTENLK | MTBR-N | 260–267 | 6.88 | 0.88 | 4 |
| pIGST | IGS*T*ENLK (either) | MTBR-N | 260–267 | 4.30 | 0.32 | 2 |
| IGSL | IGSLDNITHVPGGGNKK | MTBR-C | 354–369 | 5.90 | 0.33 | 2 |
| pIGSL | IGS*LDNIT*HVPGGGNKK (either) | MTBR-C | 354–369 | 2.39 | N/A | 1 |
| DTSPR | DTSPRHLSNVSSTGSI | Cterm | 402–416 | 4.93 | 0.51 | 2 |
| pDTSPR | DT*S*PRHLS*NVS*S*TGSI (any) | Cterm | 402–416 | 4.92 | 1.31 | 2 |
| Mean unphosphorylated | 6.84 | 1.24 | ||||
| Mean phosphorylated | 5.16 | 1.28 | ||||
N/A, not available due to limit of detection; MTBR, microtubule-binding region; SD, standard deviation; N represents number of cell lines analyzed; asterisk (*), phosphorylation.
Measuring Tau Kinetics in Healthy Humans
Prior studies in transgenic mouse models expressing human tau demonstrate that tau half-life is between 10 and 30 days (Price et al., 2010; Yamada et al., 2014, 2015). To account for this slow protein turnover, we hypothesized that an in vivo tau SILK would require a long sampling strategy with a large quantity of 13C6-leucine labeling. In a recent SILK study focused on another CNS protein with a long half-life, superoxide dismutase 1 (SOD1) (Crisp et al., 2015), six healthy participants were orally administered 13C6-leucine and analyzed by using the SILK method for SOD1 (Figure 3A). We used these CSF samples for tau SILK analyses. Briefly, participants consumed a prepackaged controlled leucine diet and ingested 13C6-leucine (1 g/day) for 10 days. CSF and plasma were collected approximately 14, 28, 42, and 75 days after oral labeling (Figure 3B). Plasma 13C6-leucine enrichment achieved ~2%–3% TTR after 10 days of oral labeling (Figure 3C). The labeling of tau was assessed using the TPSLPTTPR peptide that was common to all the tau isoforms and had the most reproducible and abundant signal. The CNS tau labeling curves displayed a slow rise toward a peak at ~30 days followed by a slow decrease over 100 days, indicating a slow turnover rate for CNS tau (Figure 3D).
Figure 3. Tau Kinetics in the Human CNS.

(A) A diagram illustrating the tau SILK method in humans.
(B–G) Six participants were orally labeled for 10 days (B–D), and four participants were labeled with 24, 16 (A and B are two different participants), or 8 hr i.v. infusion (E–G) with 13C6-leucine. Examples of a sampling timeline for oral labeling (B) and infusion labeling (E) protocols. CSF samples were assessed using tau SILK analyses and free leucine in the plasma was measured by gas chromatography-MS (GC-MS) (C and F). 13C6 leucine-labeled tau in CSF was measured in triplicate using LC-MS (D and G) and was normalized by the given dose to match 16 hr infusion in (G). TTR of the human brain 8 days after 800 mg i.v. bolus labeling is plotted as a red star in (G), indicating similar labeling kinetics of brain and CSF in humans.
(H) Age, sex, FTR, half-life of CNS tau, CSF tau concentration measured by MS, tau production rate, and CV% of MS triplicate measurements. Data are represented as mean ± SD. See also Figure S6.
To reduce burden on participants and whole-body tracer recycling issues, we developed a method that allowed for a high 13C6-leucine dose over a short duration using an intravenous (i.v.) infusion of the 13C6-leucine label (Figures 3A and 3E). We infused 13C6-leucine at 4 mg/kg/hr for 8, 16, or 24 hr in four healthy participants. During i.v. infusion, plasma 13C6-leucine enrichment was 30%–40% TTR (Figure 3F). All infusion protocols produced CNS tau labeling above the limit of quantitation (0.1% TTR) except for days 1 and 2 (<0.1%; Figure 3G). The CNS tau kinetic curves produced during i.v. administration exhibited a short time delay and peaked earlier (~14 days) than with the oral protocol followed by a slow decrease over 100 days.
In addition to these in vivo CSF studies, one participant who previously received a bolus i.v. infusion of 800 mg 13C6-leucine passed away 8 days after labeling from an unrelated cause and donated his brain for research (Figures 3A, 3G, and S6). Frozen tissue from different brain regions was analyzed for 13C6-leucine labeling after tau IP and liquid chromatography-tandem MS (LC-MS/MS) analysis. Compared to brains that received no 13C6-leucine, we observed that 0.130% ± 0.014% of tau was labeled throughout the brain 8 days after i.v. infusion (Figures S6A and S6B). Interestingly, the percentage of tau labeled in the brain and CSF was similar when normalized by the dose (area under the curve of plasma-free leucine; Figures 3G and S6C). This finding, along with our intracellular and extra-cellular tau kinetics data from human iPSC-derived neurons, suggests that tau kinetics are similar inside the brain and CSF.A compartmental model was developed to calculate the tau fractional turnover rate (FTR) and tau half-life in vivo (Figure S7). FTRs were determined with a mean CV = 6.2% for both oral and i.v. infusion tracer administration protocols (Figure 3H). The average of both methods is 0.00323 ± 0.0091 pools/day). The corresponding half-lives from oral and infusion protocols are t1/2 = 19.1 ± 3.5 days and 28.7 ± 5.2 days, respectively (the average of both methods is t1/2 = 23 ±6.4 days). Tau production rates (pg/mL/day), defined as CSF tau (pg/mL) 3 FTR (pools/day), are 30.5 ± 8.7 pg/mL/day and 19.9 ± 6.4 pg/mL/day, respectively (the average of both methods is 26.3 ± 9.2 pg/mL/day)
Tau Production Positively Correlates with Amyloidosis
Our ultimate goal was to use tau SILK in vivo to evaluate efficacies of tau-targeted therapy and to monitor disease. We hypothesized that during AD pathogenesis, increased CSF tau occurs as a function of increased tau production or active release of tau into the CSF (Figures 4A–4E). To test this hypothesis, we measured tau kinetics in the CSF of very mild AD (Clinical Dementia Rating [CDR] = 0.5) and age-matched, cognitively normal (CDR = 0) control participants (n = 24 total) using the 16 hr i.v. infusion protocol. Quantitation of amyloid plaques, tau pathology, and clinical stage of dementia was determined by amyloid positron emission topography (AV-45-PET) imaging, tau PET imaging (AV-1451), and CDR and CDR-SB (Sum of Boxes), respectively (Table 3).
Figure 4. Tau Kinetics in AD.

(A–E) Proposed hypothesis of tau turnover in AD pathogenesis. Schematics (A–D) of tau production and aggregation as disease progresses and a table summary (E) of the changes in tau measured by tau PET imaging, tau ELISA/MS, and tau SILK. Stage A: physiological tau secretion. Defined to be normal. Stage B: increased tau production and soluble tau secretion, initiated by amyloid beta toxicity or other causes. Stage C: increased aggregated tau and decreasing elevated soluble CSF tau. Stage D: trans-synaptic spreading of aggregated tau.
(F and G) Tau production rate positively correlates with amyloid PET measure by AV-45 (F). Tau FTR does not correlate with tau PET (G). Spearman correlation (r and p value) was calculated to determine each association.
See also Table 3 and Figures S7 and S8.
Table 3.
Summary of the Very Mild AD and Age-Matched, Cognitively Normal Controls and Their Tau SILK Measures
| Participant | Age | Sex | CDR | CDR-SB | Amyloid Status | Amyloid PETAV45 (SUVR) | AV-45 PET-SILK Interval (Month) | Tau PET AV-1451 (SUVR) | Tau PET-SILK Interval (Month) | FTR (Pools/Day) | Half-Life (Days) | CSF Tau Cone (pg/mL) | Tau Production Rate (pg/mL/day) | FTR CV% |
|---|---|---|---|---|---|---|---|---|---|---|---|---|---|---|
| 1 | 71 | F | 0.5 | 2 | – | 0.66 | 9.8 | 1.16 | -1.2 | 0.0323 | 21.5 | 772.2 | 24.9 | 10.9 |
| 2 | 72 | F | 0 | 0 | – | 0.76 | 7.9 | N/A | N/A | 0.0219 | 31.7 | 734.6 | 16.1 | 11.3 |
| 3 | 78 | F | 0 | 0 | – | 0.80 | 29.6 | 1.37 | -10.4 | 0.0267 | 26.0 | 703.5 | 18.8 | 9.0 |
| 4 | 73 | F | 0.5 | 5 | – | 0.80 | 10.6 | 1.36 | 9.7 | 0.0268 | 25.8 | 599.6 | 16.1 | 13.3 |
| 5 | 77 | F | 0 | 0 | – | 0.85 | 45.9 | 1.12 | 1.6 | 0.0268 | 25.8 | 936.2 | 25.1 | 9.8 |
| 6 | 77 | M | 0 | 0 | – | 0.90 | 12.3 | 1.17 | 3.0 | 0.0165 | 42.1 | 940.4 | 15.5 | 10.5 |
| 7 | 76 | F | 0 | 0 | – | 0.91 | 43.1 | 1.26 | -0.7 | 0.0189 | 36.7 | 932.5 | 17.6 | 8.6 |
| 8 | 70 | F | 0 | 0 | – | 0.94 | 3.5 | 0.99 | 15.3 | 0.0252 | 27.6 | 874.4 | 22.0 | 10.8 |
| 9 | 79 | F | 0 | 0 | – | 1.06 | 9.0 | 1.23 | -0.9 | 0.0232 | 29.9 | 1079.6 | 25.0 | 12.2 |
| 10 | 87 | M | 0 | 0 | – | 1.07 | 9.9 | N/A | N/A | 0.0285 | 24.4 | 1349.8 | 38.4 | 8.0 |
| 11 | 75 | F | 0 | 0 | – | 1.08 | 13.0 | 0.97 | 19.0 | 0.0197 | 35.1 | 1057.3 | 20.9 | 9.1 |
| 12 | 81 | F | 0 | 0 | – | 1.17 | -7.5 | 1.31 | -6.2 | 0.0264 | 26.3 | 1282.6 | 33.9 | 9.6 |
| 13 | 75 | M | 0 | 0.5 | + | 1.44 | 43.2 | 1.08 | 0.4 | 0.0223 | 31.1 | 962.0 | 21.5 | 11.2 |
| 14 | 82 | F | 0.5 | 0 | + | 1.69 | 9.9 | 1.51 | 6.5 | 0.0267 | 25.9 | 1138.6 | 30.4 | 8.9 |
| 15 | 65 | M | 0 | 0 | + | 1.78 | 5.8 | 1.38 | 10.2 | 0.0210 | 33.1 | 1043.2 | 21.9 | 14.4 |
| 16 | 77 | F | 0.5 | 2.5 | + | 2.16 | 11.9 | 1.99 | 8.8 | 0.0195 | 35.5 | 1001.7 | 19.6 | 11.5 |
| 17 | 77 | M | 0 | 0 | + | 2.18 | 26.6 | 1.08 | 19.7 | 0.0235 | 29.5 | 1167.4 | 27.4 | 10.6 |
| 18 | 91 | M | 0.5 | 3.5 | + | 2.34 | 33.1 | 1.60 | 24.9 | 0.0187 | 37.0 | 1893.9 | 35.4 | 15.1 |
| 19 | 80 | F | 0.5 | 0 | + | 2.49 | 17.7 | 1.89 | -6.7 | 0.0260 | 26.7 | 1602.6 | 41.6 | 9.4 |
| 20 | 81 | F | 0 | 0 | + | 2.53 | 7.3 | 1.46 | 7.6 | 0.0228 | 30.4 | 947.7 | 21.6 | 15.2 |
| 21 | 90 | F | 0.5 | 2 | + | 2.87 | 14.2 | 1.67 | 11.8 | 0.0190 | 36.6 | 1464.0 | 27.8 | 12.4 |
| 22 | 81 | F | 0.5 | 1 | + | 3.25 | 18.3 | 1.80 | -5.2 | 0.0241 | 28.8 | 1258.1 | 30.3 | 10.2 |
| 23 | 68 | F | 0.5 | 0 | N/A | N/A | N/A | 1.24 | -7.1 | 0.0206 | 33.7 | 765.0 | 15.7 | 10.1 |
| 24 | 73 | M | 0.5 | 0 | N/A | N/A | N/A | N/A | N/A | 0.0190 | 36.6 | 1373.4 | 26.0 | 9.6 |
| Mean (amyloid -) | 76.3 | 0.1 | 0.6 | 0.9 | 15.6 | 1.2 | 2.9 | 0.0244 | 29.4 | 938.5 | 22.9 | 10.3 | ||
| SD | 4.7 | 0.2 | 1.4 | 0.2 | 15.8 | 0.1 | 8.8 | 0.0045 | 6.0 | 217.1 | 7.2 | 1.5 | ||
| Mean (amyloid +) | 79.9 | 0.3 | 1.0 | 2.3 | 18.8 | 1.5 | 7.8 | 0.0221 | 31.5 | 1247.9 | 27.8 | 11.9 | ||
| SD | 7.4 | 0.3 | 1.3 | 0.6 | 12.1 | 0.3 | 10.0 | 0.0028 | 4.0 | 313.2 | 7.0 | 2.3 | ||
| Mean (female) | 77.1 | 0.3 | 0.7 | 1.5 | 15.3 | 1.4 | 2.6 | 0.0238 | 29.6 | 1008.8 | 24.0 | 10.7 | ||
| SD | 5.6 | 0.3 | 1.4 | 0.9 | 14.2 | 0.3 | 8.8 | 0.0039 | 4.7 | 247.5 | 7.3 | 1.8 | ||
| Mean (male) | 77.8 | 0.1 | 0.6 | 1.6 | 25.3 | 1.3 | 11.7 | 0.0220 | 32.5 | 1247.2 | 26.4 | 11.2 | ||
| SD | 8.1 | 0.2 | 1.3 | 0.6 | 16.3 | 0.2 | 10.5 | 0.0041 | 6.0 | 323.7 | 7.5 | 2.6 | ||
| Mean | 77.3 | 0.2 | 0.7 | 1.5 | 17.1 | 1.4 | 4.8 | 0.0231 | 30.7 | 1078.3 | 24.7 | 10.9 | ||
| SD | 6.3 | 0.3 | 1.3 | 0.8 | 14.0 | 0.3 | 9.8 | 0.0039 | 5.1 | 306.1 | 7.3 | 2.0 |
CDR,value uptake tandardized s AV-45 of Cut-off available. not N/A, deviation; standard SD, rate; turnover positivity. Fractional tau for used FTR, was Box; of ratiocut-off CDR-Sum Nopositivity.CDR-SB,amyloidRating; for used Dementia was 1.22 Clinical =(SUVR)
Tau SILK in 24 participants suggested that tau FTR and halflife are similar across participants regardless of amyloid status or tau PET imaging measures (Table 3; Figures S8A and S8B). FTRs were determined with a mean CV = 10.9% ± 2.0%. The tau FTRs from the amyloid-negative and -positive cohorts are 0.0244 ± 0.0045 pools/day and 0.0221 ± 0.0028 pools/day, respectively (the average is 0.0231 ± 0.039 pools/day). The estimated tau half-lives in amyloid-negative and -positive cohorts are t1/2 = 29.4 ± 6.0 days and 31.5 ± 4.0 days, respectively (the average is t1/2 = 30.7 ± 5.1 days).
We show that the CSF tau concentrations are increased 1.3-fold in the amyloid-positive cohort compared to age-matched amyloid-negative cohort (Table 3). Interestingly, the profiles of CSF tau are similar in the amyloid- positive and -negative groups, with similar truncation profiles (Figures S8C and S8D). We found that the tau production rate, defined as the product of tau FTR and CSF tau concentration, positively correlates with amyloid burden, (r = 0.45, p = 0.04; Figure 4F). The estimated tau production rates from amyloid-negative and -positive cohorts are 22.9 ± 7.2 pg/mL/day and 27.8 ± 7.0 pg/mL/day, respectively (the average is 24.7 ± 7.3 pg/mL/day). These results indicate that the increase in CSF tau in AD is due to an increase in the active production rate of tau (which includes synthesis and release), and it positively correlates with amyloidosis. There was no correlation between tau FTR and tau PET imaging (Figure 4G).
DISCUSSION
In this study, we utilized an IP-LC-MS approach that offers a higher resolution and quantitation for elucidating tau truncation, modification, and isoforms in comparison to previous methods using ELISA or immunoblotting. Using this IP-LC-MS method, we quantitatively assessed the molecular identity of tau in human CSF, brain, and iPSC-derived neurons. We found that the CSF tau consists of truncated brain tau, and the major tau species in the human CSF is truncated at the end of mid-domain. We developed stable isotope-labeled amino acid-labeling paradigms, highly sensitive methods for quantifying the amount of 13C6-leucine incorporated into CNS tau in humans and in cellular models. In human iPSC-derived neurons, we demonstrated similar kinetics of intracellular and extracellular tau with a delay of 3 days for the release of newly synthesized, labeled tau. We showed that full-length tau, isoforms, and phosphorylation specific tau have different kinetic profiles. Then, we measured the kinetics of tau in the human CSF and brain. We observed a long half-life of tau of t1/2 = 23.0 ± 6.4 days with similar kinetics in the CSF and brain. Finally, we measured tau kinetics in very mild AD and age-matched, cognitively normal participants. We found that tau production rate in the CSF positively correlates with amyloidosis and tau aggregation.
A body of evidence suggests that tau is N-terminally and C-terminally truncated in neurofibrillary tangles in the brain and some truncated forms accelerate pathology (Derisbourg et al., 2015; Guillozet-Bongaarts et al., 2005). Recent studies indicate that tau is truncated in the human CSF (Barthélemy et al., 2016; Borroni et al., 2009; Meredith et al., 2013) and in cell culture media (Kanmert et al., 2015). In this study, we provide the first side-by-side comparison of truncated- and isoform-specific profiles of soluble tau in the human brain, CSF, and iPSC-derived neurons and kinetic profiles of multiple forms of tau. Our first finding was that CSF tau consists of fragments of full-length brain tau, and CSF soluble tau is specifically cleaved at the end of the mid-domain between residues 222 and 225 in a physiological state. Further, these N terminus fragments have longer half-lives than full-length tau in iPSC-derived neurons, suggesting a biologically regulated mechanism for tau processing to generate truncated tau and release of this form of tau into the extracellular space (Figure 5). We found no C-terminal stubs in the CSF or in iPSC-derived neuron media, supporting a hypothesis that tau is truncated intracellularly and C terminus stubs either remain intracellular as insoluble fractions or are degraded.
Figure 5. Tau Truncation and Release Are Regulated.

Our findings support an active process of translation, processing, and release of tau that occurs over 3 days, and specific increase in turnover of modified tau associated with tauopathy-based diseases such as AD, PSP, and other tauopathies. Diagram showing proposed hypotheses for truncation and secretion of tau. Full-length tau is passively released (orange arrow, no delay). Truncated tau is actively released to the extracellular space (green arrow, 3-day delay). Tau is truncated at multiple sites, including between MTBR-C (Figure 2) and C terminus, and at the end of mid-domain. We propose that longer, truncated forms including MTBR-C are more readily secreted but are more rapidly turned over (gray protein conversion). Within the cell, 4R isoforms and phosphorylated tau undergo more rapid intracellular turnover (gray proteins with red modifications).
Our second finding was the 3-day delay from intracellular translation to extracellular release of tau, suggesting a time related mechanism for release. This active delay of tau release is specific to truncated tau. We hypothesize that full-length tau is passively released by cell death or neurite turnover that occurs at a low amount in cell culture (Chai et al., 2012; Kanmert et al., 2015). Tau is synthesized at the cell body and transported to axons or partially translated locally at axons (Morita and Sobue, 2009), where it interacts with microtubules via repeat domains. Tau is also transported to synapses, where it may interact with scaffolding proteins (Pooler et al., 2014). Tau may be secreted via an unconventional mechanism such as translocation across the plasma membrane, release via secretory lysosomes, micro vesicle shedding, or exosome release (Karch et al., 2012). These cleavage and release processes may be associated with specific cellular responses, such as neurite growth, axonal transport, and neuroexcitation (Ferreira and Caceres, 1991; Mandelkow et al., 2003; Pooler et al., 2013; Yamada et al., 2014).
Our third finding was that tau isoforms display different kinetics. 4R tau isoform preferentially forms tau aggregates in a subset of tauopathies (PSP, CBD, and FTD) (Cairns et al., 2007; Dickson et al., 2011). Furthermore, a common haplotype in the MAPT gene, termed H1, is associated with increased risk for PSP, CBD, FTD, and AD, and MAPT H1 is also associated with altered expression of tau isoforms (Baker et al., 1999; Desikan et al., 2015; Trabzuni et al., 2012; Yokoyama et al., 2017). Yet we still do not understand the molecular and cellular consequences of this risk haplotype. We demonstrate that the 4R tau isoform is more rapidly metabolized than 3R in iPSC-derived neurons. While we do not currently understand the cause or purpose of altered turnover rates for different tau iso-forms, we speculate that tau isoforms that are more fibrillogenic have faster kinetics, consistent with the findings that Ab isoforms that are more fibrillogenic (Ab42) have faster kinetics (Patterson et al., 2015). There may also be specific metabolic or proteolytic processing for 0N, 1N, and 2N tau isoforms that are critical for cellular function. We show that 2N isoforms are either modified or expressed at low levels in brain, CSF, and iPSC-derived neurons from normal controls. 2N isoforms may trigger toxic mechanisms that impair axonal sorting and may facilitate neuronal dysfunction and death (Liu et al., 2016; Zempel et al., 2017). A faster rate of turnover may help mitigate the potential effects of free N-terminal peptides of tau.
Phosphorylation of tau regulates tau-microtubule interaction, neurite outgrowth, and axon transport at physiological state (Stoothoff and Johnson, 2005; Wang and Mandelkow, 2016). Hyperphosphorylation of tau is implicated in AD pathogenesis and elevated CSF tau phosphorylated at T181 is widely used as an AD biomarker. We were able to trace the kinetics of phosphorylated species of tau that contain a leucine within the peptide sequence (T111/S113/T123, T212/214, T217, S262/T263, and S356/T361). We found these phosphorylated peptides have shorter half-lives than their corresponding non-phosphorylated species. Previous studies suggest that phosphorylation decreases the affinity of tau to interact with microtubule, which could decrease corresponding soluble p-tau half-life compared to unphosphorylated tau (Biernat et al., 1993; Haase et al., 2004; Sun and Gamblin, 2009). Phosphorylation at T217 at the end of the mid-domain had the most robust effect on accelerating tau half-lives compared to non-phosphorylated peptides. Interestingly, we observed that pTau217 correlated with AD pathology (Figures S8C, S8E, and S8F; Barthélemy et al., 2017). This may suggest that tau species that are more fibrillogenic are processed more rapidly. This may be associated with impaired protein stability, aggregation, and increased proteolysis, leading to proteinopathies that cause neurodegeneration.
We show that extracellular tau kinetics reflect the kinetics of intracellular tau in healthy neurons and quantifying extracellular tau provides insights into the intracellular tau processing. This finding is especially critical in light of human studies in which obtaining brain samples is difficult. This study demonstrates, for the first time, that 13C6-leucine incorporation into CSF tau isoforms reflects a similar kinetic process in the human brain.
There are a few caveats for the in vitro tau SILK approach used in this study. Human iPSC-derived neuronal cultures are thought to reflect immature neurons. 3R and 4R isoforms are expressed equally in the human adult brain, while iPSC-derived neurons in this study expressed two orders of magnitude less 4R compared to 3R tau isoforms. This suggests that although iPSC-derived neurons express markers of mature neurons, they do not completely recapitulate neurons in the adult human brain. Overall, we observed that the tau profiles in the cell and media fractions from iPSC-derived neurons were similar to those observed in the human CNS. This finding suggests that despite the immaturity of the iPSC-derived neuronal system, we are able to recapitulate major aspects of tau biology in vitro and in vivo. The tau half-life in vitro (intracellular t1/2 = 6.70 ± 0.53 days; extracellular t1/2 = 6.78 ± 0.40 days; average t1/2 = 6.74 ± 0.45) was much shorter than the tau half-life in the human CNS (t1/2 = 23 ± 6.4 days). This may be due to human CSF kinetic profiles reflecting the complex metabolism of tau production and clearance in the context of neurons, glia, and the blood-brain barrier. Nevertheless, the in vitro tau SILK method can be applied to elucidate molecular mechanisms underlying the alterations in tau kinetics and screen drugs that normalize altered tau kinetics in future studies.
Tau SILK analyses from 24 participants including patients with very mild AD and cognitively normal controls suggest that tau production rate increases with amyloidosis. While this result needs to be replicated in a larger cohort, our findings support the hypothesis that the increase in CSF tau in AD is due to increased tau production (i.e., de novo synthesis and release) rather than a decreased fractional clearance rate. If CSF tau levels increase due to spilling of intracellular tau from dying neurons, the ratio of labeled tau to unlabeled tau would have decreased. We hypothesize that increased tau production or release of tau into the CSF during AD pathogenesis is associated with disease progression and amyloidosis, followed by the deposition of aggregated tau, interrupting normal clearance mechanisms (Figures 4A–4E). In our study, we did not detect a change in these soluble CSF tau FTRs (Figure 4G); however, we did note a correlation of production rate to the amount of tau aggregation as measured by tau PET (Figure S8G). In a normal physiological state, soluble tau in the brain and CSF tau are in equilibrium (Stage A, normal). Several possible events (e.g., Ab aggregation, neurotoxicity, inflammation, etc.) may increase tau production or release into extracellular space and, over time, soluble extracellular tau concentrations increase (evaluated CSF tau concentrations by ELISA or MS; Stage B, asymptomatic). Increasing soluble tau may facilitate seeding and subsequent aggregation of misfolded, insoluble tau that accumulates within mono- and trans-synaptically connected neurons (evaluated by tau PET), leading to a relative decrease in CSF tau (though still elevated above normal) (Stage C, very mild AD; Braak stage I/II; Braak and Braak, 1995). As soluble tau aggregates (e.g., oligomers) accumulate and spread trans-synaptically to different brain regions (Stage D, mild AD; Braak stage III/IV), the concentration of CSF tau would decrease after cognitive decline begins.
The in vivo tau SILK method has several limitations. The tau half-life estimated using compartmental modeling varied over a range of t1/2 = 13–23 days (oral protocol) and 25–36 days (infusion protocols), suggesting that calculated tau half-life varies depending on the assumptions of the labeling protocol and can be up to 2-fold longer in the infusion protocol compared to the oral protocol. The difference between the two clinical labeling protocols is possibly due to continued recycling of tracers, especially in the oral protocol. The high variance within the same protocol may be due to the heterogeneity (e.g., age, genomic background, sex, or undiagnosed health conditions) of kinetic rates across participants and the small sample size in this study. A recent cryoelectron microscopy study of neurofibrillary tangles from human AD brains suggests that the core aggregate consists of the MTBR (Fitzpatrick et al., 2017). Future human tau SILK method that utilizes MTBR peptide may be more relevant for changes in tau aggregation in mild AD, or an in vitro tau SILK method that can monitor additional peptides may address these potential issues. Nevertheless, these novel tau SILK methods should prove useful in future studies aimed at determining the mechanism behind alterations in tau kinetics in tauopathies such as AD in humans and in cell culture. In combination with tau PET imaging that assesses aggregated tau, the in vivo tau SILK method will help evaluate the efficacy of tau-targeted therapies and provide information for designing clinical trials targeting tau.
STAR★METHODS
KEY RESOURCE TABLE
| REAGENT or RESOURCE | SOURCE | IDENTIFIER |
|---|---|---|
| Antibodies | ||
| Tau12 mouse monoclonal antibody | Nicholas M Kanaan and Lester Binder (Combs et al., 2016) | RRID:AB_2721192 |
| Tau13 mouse monoclonal antibody | Nicholas M Kanaan and Lester Binder (Combs et al., 2016) | RRID:AB_2721193 |
| HJ8.5 mouse monoclonal antibody | David M Holtzman (Yanamandra et al., 2013) | RRID:AB_2721237 |
| HJ8.7 mouse monoclonal antibody | David M Holtzman (Yanamandra et al., 2013) | RRID:AB_2721234 |
| Tau1 mouse monoclonal antibody | Nicholas M Kanaan (Liu et al., 1993; Papasozomenos and Binder, 1987) | RRID:AB_2721197 |
| Tau5 mouse monoclonal antibody | Nicholas M Kanaan (LoPresti et al., 1995) | RRID:AB_2721194 |
| HJ9.3 mouse monoclonal antibody | David M Holtzman (Yanamandra et al., 2013) | RRID:AB_2721235 |
| HJ9.1 mouse monoclonal antibody | David M Holtzman | RRID:AB_2721236 |
| Tau7 mouse monoclonal antibody | Nicholas M Kanaan and Lester Binder (Horowitz etal., 2006) | RRID:AB_2721195 |
| OCT4 | Life Technologies | A24867 RRID: AB_2650999 |
| SOX2 | Life Technologies | A24759 RRID: AB_2651000 |
| NANOG | Thermo Fisher Scientific | PA1–41577; RRID: AB_2150115 |
| SSEA4 | Life Technologies | A24866 RRID: AB_2651001 |
| TRA1−60S | Life Technologies | A24868 RRID: AB_2651002 |
| TRA1−81 | Cell Signaling Technology | 4745P2 RRID: AB_2721206 |
| Tuji [TUB2.1]-Cy3 | Abcam | ab11309 RRID: AB_297912 |
| FoxA2 | Cell Signaling Technology | 3143SRRID:AB_2104878 |
| alpha smooth muscle actin (Sma) | Abcam | ab5694 RRID: AB_2223021 |
| Alexa Fluor 488 goat anti-mouse lgG3 | Life Technologies | A24877 RRID: AB_2651008 |
| Alexa Fluor 594 goat anti-mouse IgM | Life Technologies | A24872 RRID: ABJ41424 |
| Biological Samples | ||
| Human brain tissues | Washington University Knight ADRC | N/A |
| Human CSF | Clinical Research Unit and Knight ADRC at Washington University | N/A |
| Chemicals, Peptides, and Recombinant Proteins | ||
| Tris hydrocholoride (Tris-HCI) | Sigma | 1185–53-1 |
| Sodium choloride (NaCI) | Sigma | S7653–1 KG |
| Ethylenediaminetetraacetic acid (EDTA) | Sigma | 60–00-4 |
| Ethylene glycol-bis(2-aminoethylether)-N,N,N′,N′-tetraacetic acid (EGTA) | Sigma | 67–42-5 |
| 1,4-Dithiothreitol (DTT) | Sigma | 3483–12-3 |
| phosphatase inhibitor Cocktail 3 | Sigma | P0044–1ML |
| protease inhibitor cocktail | Roche | 04693116001 |
| CytoTune Sendai Reprograming Kit | Life Technologies | A16517 |
| mTesR | StemCell Technologies | 85850 |
| CultrexBME | Trevigen | 3432–001-01 |
| Accutase | MB Biomedicals | 91000449 |
| Y-27632 | Sigma | Y0503 |
| N-Lauroylsarcosine sodium salt (Sarkosyl) | Sigma | 137–16-6 |
| Neural Induction Media | StemCell Technologies | 05835 |
| Poly-L-Ornithine (PLO) | Sigma | P4957 |
| Laminin | Trevigen | 3400–010-03 |
| Neurobasal Media | Life Technologies | 21103–049 |
| B27 | GIBCO | 17504044 |
| BDNF | Peprotech | 450–02 |
| GDNF | Peprotech | 450–10 |
| cAMP | Sigma | D0260 |
| L-glutamate | Sigma | G7513 |
| CNBr-activated Sepharose beads | GE Healthcare | 17–0430-01 |
| 15N labeled recombinant 2N4R tau | Guy Lippens | N/A |
| Nonidet P 40 Substitute (NP-40) | Sigma | 74385–1L |
| Guanidine hydrochloride | Sigma | 50–01-1 |
| triethyl ammonium bicarbonate (TEABC) | Fluka | 17902 |
| MS grade trypsin | Promega | V5111 |
| MS grade AspN | Promega | V162A |
| TopTip C18 | Glygen | TT2C18.96 |
| H2O2 | Thermo Fisher Scientific | H325–100 |
| Acetonitrile (LC/MS grade) | Thermo Fisher Scientific | A955–4 |
| Formic acid (LC/MS grade) | Thermo Fisher Scientific | 64–18-6 |
| Dulbecco’s Modified Eagle Media (DMEM) | Sigma | D5546 |
| Fetal bovine serum | Sigma | F6178 |
| 13C6-leucine | Cambridge Isotope | CLM-2262 |
| Phosphate Buffered Saline (PBS) | Thermo Fisher Scientific | 10010023 |
| Fugene HD | Promega | E2312 |
| AV-45 (Amyloid PET tracer, florbetapir) | Precursor provided by Avid | N/A |
| AV-1451 (Tau PET tracer, flortaucipir, T807) | Precursor provided by Avid | N/A |
| 12C6-leucine | Cambridge Isotope | ULM-8203 |
| Heptafluorobutyric anhydride (HFBA) | Regis Technologies | 336–59-4 |
| Dowex AG-50W X8, 100–200 mesh, H+ form | Sigma | 217506 |
| Hydrochloric Acid | Thermo Fisher Scientific | A144–500 |
| Ammonium Hydroxide, NH4O4 | Thermo Fisher Scientific | A669S-500 |
| n-propanol | Sigma | A414–500 |
| Ethyl acetate | Thermo Fisher Scientific | E195–1 |
| Trichloroacetic acid (TCA) | Thermo Fisher Scientific | T036925G |
| acetone | Sigma | 270725 |
| hexane | Sigma | 270504 |
| tert-Butylchlorodim ethyl si lane | Regis Technologies | 1–270143 |
| Experimental Models: Cell Lines | ||
| Human iPSC line F0510.2 | This manuscript | N/A |
| Human iPSC line F0510.2d2F4 | This manuscript | N/A |
| HEK293T | ATCC/MilbrandtLab | CRL-11268 |
| Oligonucleotides | ||
| LIN28A | Life Technologies | Hs00702808_s1 |
| NANOG | Life Technologies | Hs04260366_g1 |
| PODXL | Life Technologies | Hs01574644_m1 |
| POU5F1 | Life Technologies | Hs04260367_gH |
| SOX2 | Life Technologies | Hs04260357_g1 |
| SEN DAI | Life Technologies | AI5IPH9 |
| GAPDH | Life Technologies | Hs02758991_g1 |
| ACTA2 | Life Technologies | Hs00426835_g1 |
| AFP | Life Technologies | Hs00173490_m1 |
| DES | Life Technologies | Hs00157258_m1 |
| FN1 | Life Technologies | Hs00277509_m1 |
| F0XA2 | Life Technologies | Hs00232764_m1 |
| GFAP | Life Technologies | Hs00909233_m1 |
| TUBB3 | Life Technologies | Hs00801390_s1 |
| Recombinant DNA | ||
| 2N4R full length tau pcDNA3.1 | (Karch et al., 2012) | N/A |
| Software and Algorithms | ||
| Xcalibur software | Thermo Scientific | v2.2 |
| SAAM II software | The Epsilon Group | v2.3 |
| Prism | GraphPad | v7.04 |
| FreeSurfer | Freesurfer | v5.3 |
| Ch em Station | Agilent | E. 02.02.1431 |
| Other | ||
| Acquity UPLC M-Class Systems | Waters Corporation | 176816002 |
| HSS T3 75p.m × 100mm, 1.8p.m column | Waters Corporation | 186008006 |
| Orbitrap Fusion | Thermo Fisher Scientific | FSN01 −10002 |
| Orbitrap Fusion Lumos | Thermo Fisher Scientific | FSN02–1000 |
| 10p.m SilicaTip emitter | New Objective | FS360–20-10-N-20-C6.35CT |
| Agilent 6890N Gas Chromatograph | Agilent | US10128934 |
| Agilent 5973N Mass Selective Detector | Agilent | US10480911 |
| Biograph mMR scanner | Siemens | SN 51010 |
| Biograph 40 PET/CT scanner | Siemens | SN 1003 |
CONTACT FOR REAGENT AND RESOURCE SHARING
Further information and requests for resources and reagents should be directed to and will be fulfilled by the Lead Contact, Randall Bateman (batemanr@wustl.edu). Material transfer agreements are required for distribution of human stem cells with Celeste Karch.
EXPERIMENTAL MODEL AND SUBJECT DETAILS
Human subjects
Studies involving participants were approved by the Washington University Human Studies Committee and the General Clinical Research Center (GCRC. Tau SILK: 201502091. iPSC work: 201306108). Written informed consent was obtained from all participants prior to inclusion in the study. Participants were identified by number, not by name. Normal control participants were recruited from the Volunteer for Health and AD patients and age-matched control were recruited from the Knight Alzheimer’s Disease Research Center (ADRC) at Washington University. All ADRC participants have undergone cognitive assessment (CDR, annual), and Magnetic Resonance Imaging (MRI), amyloid PET (tracer: AV-45) and/or tau PET imaging (tracer: AV-1451) within 0–45 months of tau SILK study when eligible. Demographics are found in Figure 3H and Table 3. Both sexes were used for analyses, and there was no significant difference in tau SILK measures between two sexes.
Based on previous reports, AD patients have an approximate two-fold or 200% increase in CSF tau concentration compared to age-matched controls. We are currently recruiting 30 very mild AD and 40 age-matched controls, which would provide more than 99% power to detect a 200% change (alpha = 0.05). Assuming the same difference (i.e., the effect size) on half-life between each subject group, the proposed sample sizes will provide at least 80% statistical power to detect a change as small as 1.37 days (4% change) between groups. These power analyses were based on the F-test (with 2 numerator degrees of freedom) from a one-way ANOVA and assumed a significance level of 5%. Currently we have 53% power to detect a moderate Spearman correlation (r = 0.44) with a sample size of N = 22 subjects with AV-45 measures (Figure 4F).
Participants were recruited by their CDR scores of 0 (cognitively normal) or greater than 0 (cognitively impaired) and later classified as Amyloid positive or negative group based on AV-45 SUVR cut-off value of 1.22. Individuals with very mild AD dementia gave assent and consent in the decision to participate in the research study. The participants with mild cognitive impairment obtained the assistance of a study partner, and the participants and study partners were assessed by the coordinator as to their reliability to comply with the protocol. Exclusion criteria included a bleeding disorder, active anticoagulation, active infection, or recent syncope. Participants were excluded from this study if taking an experimental treatment targeting tau that could influence tau levels in the CSF. Participants with a history of significant head injury or trauma that may lead to abnormal tau deposition in the brain were also excluded.
iPS cell lines
Dermal fibroblasts from a research participant (age: 47; sex: male) were reprogrammed into iPSCs using non-integrating Sendai virus carrying OCT3/4, SOX2, KLF4, and cMYC as previously described (Ban et al., 2011; Takahashi and Yamanaka, 2006). Human iPSC that showed morphological evidence of reprogramming were manually isolated and cultured on Matrigel. Human iPSC were cultured in mTesR1 on Matrigel-coated tissue culture-treated plates. For routine passaging, iPSC were dissociated with Accutase for 3 minutes. Dissociated cells were collected in PBS and centrifuged at 750 rpm for 3 minutes. After media was aspirated, a portion of the cells were plated on new Matrigel-coated plates in mTesR1. IPSCs were maintained with less than 5% spontaneous differentiation. The resulting clones were fully characterized using standard techniques. Human iPSCs were shown to express pluripotency markers by immunohistochemistry and quantitative PCR (qPCR; Figures S2A and S2B). We also demonstrated by qPCR that the Sendai virus was absent from the stable iPSC clones. Karyotyping analysis demonstrated that the iPSC contained no chromosomal abnormalities (Figure S2C). Human iPSCs were able to spontaneously differentiate into cells found in each of the three germ layers (Figures S2D and S2E).
METHOD DETAILS
Characterization of tau in the human brain and CSF
Frozen human brain tissues were obtained from Knight Alzheimer’s Disease Research Center (ADRC) at Washington University School of Medicine (St. Louis, MO). Detergent-soluble tau was separated from putative tau aggregates expected in AD brain by enrichment and purification by ultracentrifugation as reported in the literature (Hanger et al., 1998). Briefly, frozen human brain (200–400 mg, age, sex, post mortem interval [PMI] and RNA integrity number [RIN] are in Figure S1F) were homogenized in Tris-HCl buffer (25 mM Tris-HCl, 150 mM NaCl, 10 mM EDTA, 10 mM EGTA, 1 mM DTT, phosphatase inhibitor Cocktail 3, Roche Protease Inhibitor, pH 7.4. Final 3.25 μL/mg tissue) on ice. Homogenates were centrifuged at 4° C for 60 minutes at 11,000xg. Supernatant was solubilized in 1% Sarkosyl for 60 min and centrifuged for 2 hours at 100,000xg. For Figure 1, 100 μL aliquots of the Sarkosyl soluble fractions were used for immunoprecipitation. For Figure S1, this fraction was further diluted with 0.5% human plasma before immunoprecipitation in order to decrease protein load on the mass spectrometer and match CSF protein levels.
Human CSF were collected from 29 normal controls (age 25–87) at Clinical Research Unit and at ADRC at Washington University School of Medicine (St. Louis, MO; Figure S1G). They were spun down at 1,000xg for 10min to remove cell debris and immediately frozen at −80°C. Protease inhibitor cocktail was added during experiments.
Differentiation of iPSC-derived neurons
Human iPSCs were differentiated into neural progenitor cells (NPCs). Briefly, iPSCs were cultured in Neural Induction Media (Stem Cell Technologies) in a 96-well plate to form neural aggregates. Neural aggregates were plated on Poly-L-Ornithine (PLO) and laminin-coated plates to form neural rosettes. Neural rosettes were isolated by enzymatic selection and cultured as neural progenitor cells (NPCs). NPCs were cultured on PLO and laminin-coated plates and terminal differentiation was initiated with the addition of cortical maturation media (Neurobasal Media (Life Technologies 21103–049) supplemented with B27 (GIBCO 17504044), BDNF (Peprotech 450–02), GDNF (Peprotech 450–10), cAMP (Sigma D0260) and L-glutamate (Sigma G7513)). iPSC-derived neurons exhibit features of active, mature neurons in the positive staining for synapse markers and the production of strong action potentials (data not shown). In the SILK studies described below, two cell lines were analyzed from two independent neural inductions (n = 4 total).
IP/MS analysis of tau
CNBr-activated Sepharose beads (GE Healthcare 17–0430-01) were crosslinked to antibodies Tau12, Tau13, Tau1, Tau5 (mouse monoclonal, provided by Drs. Nicholas Kanaan and Lester Binder), HJ8.5, HJ8.7, HJ9.3, and HJ9.1 (mouse monoclonal, provided by Dr. David Holtzman and Hong Jiang) respectively at a concentration of 3mg antibody per g of beads. Samples are spiked with 5ng 15N labeled recombinant 2N4R tau (gift from Dr. Guy Lippens), and tau concentration is calculated using this internal standard.
Soluble tau was immunoprecipitated in detergent (1% NP-40), chaotropic reagent (5mM guanidine), and protease inhibitors (Roche Complete Protease Inhibitor Cocktail). 30μL of 50% slurry of the tau antibody beads were rotated with the solution for 90 minutes at room temperature. The beads were washed one time in 0.5M guanidine and two times in 25mM triethyl ammonium bicarbonate buffer (TEABC, Fluka 17902). The bound tau was digested on-beads with 400ng MS grade trypsin (Promega, V5111) or AspN (Promega, V162A) for 16 hours at 37ºC. Digests were loaded onto TopTip C18 (Glygen, TT2C18.96), desalted, and eluted per manufacturer’s instructions. An additional step of oxidation was performed for peptide profiling by with H2O2/FA solution (3%/3%) overnight before elution. The eluted peptides were dried by vacuum centrifugation (CentriVap Concentrator Labconco) and were resuspended in 25mL of a solution of 2% acetonitrile and 0.1% formic acid in MS grade water.
A 5μL aliquot of the peptide resuspension was subjected to nano-Acquity LC and MS analysis. The nano-Acquity LC (Waters Corporation, Milford, MA) was fitted with HSS T3 75μm × 100mm, 1.8μm column and a flow rate of 0.5 μL/min of a gradient of solution A and B was used to separate the peptides. Solution A was composed of 0.1% formic acid in MS grade water and solution B was composed of 0.1% formic acid in acetonitrile. Peptides were eluted from the column with a gradient of 2% to 20% of solution B in 8 minutes, then 20% to 40% solution B for another 3 minutes before ramping up to 85% solution B in another 3 minutes to clean the column. The Orbitrap Fusion / Fusion Lumos was equipped with a Nanospray Flex electrospray ion source (Thermo Fisher Scientific, San Jose, CA). Peptide ions sprayed from a 10μm SilicaTip emitter (New Objective, Woburn, Ma) into the ion–source were targeted and isolated in the quadrupole and were then fragmented by HCD and ion fragments were detected in the Orbitrap (resolution of 60,000, mass range 150–1200 m/z). Monitoring of hydrophilic peptides (SSRcalc < 9, all without leucine) for peptide profiling was performed on a HSS T3 300μm × 100mm, 1.8μm column at a flow rate of 4μl/min with an elution occurring with a 2% to 12% solution B gradient and a spray operating on a 30mm SilicaTip emitter.
For SILK monitoring, the 13C6-leucine labeled TPSL*PTPPTR peptide and co-eluted unlabeled TPSLPTPPTR peptide were sequentially isolated (respectively 540.28 and 533.80, +/– 0.7 m/z, z = 2), trapped (trap fill time respectively 900ms and 118ms, AGC target 5E5) and fragmented (HCD = 20). LC-MS/MS signals from labeled and unlabeled y6+ fragments (respectively 677.3459 and 668.3726 m/z) were extracted at 5ppm of accuracy.
Generation of 13C6-leucine labeled tau standard curve
Labeled media standard was prepared by labeling full-length 2N4R tau transiently overexpressed in HEK293T cells. HEK293T cells were grown in Dulbecco’s Modified Eagle Media (DMEM, Sigma, D5546) supplemented with 10% fetal bovine serum (Sigma, F6178) and split into 6-well plates the day before transfection. On the day of the transfection, the media was spiked with 13C6-leucine (Cambridge Isotopes, CLM-2262) into DMEM containing 1.05 g/L of unlabeled leucine to the final Tracer to Tracee Ratio (TTR) of 2.5%,1.25%, 0.625%, 0.312%, 0.156%, 0.078% and 0%. HEK293T were transiently transfected with full-length 2N4R tau-pcDNA3.1 using Fugene HD (Promega, E2312). Media and cells were harvested after 6 days. Media were spun at 15K g for 5 min, and the supernatant was diluted to 100pg/mL to approximately match the CSF tau concentration in healthy human controls, which is in the range of 300–500pg/mL (Sjögren et al., 2001). This was aliquoted, and then frozen at 80º C. Cells were washed once with Phosphate Buffered Saline (PBS. Thermo Fisher Scientific 10010023), collected in cold PBS with protease inhibitor cocktail (Roche, 04693116001), spun at 15K g for 5 minutes, aliquoted, and frozen at 80ºC.
Tau SILK in iPSC-derived neurons
iPSC-derived neurons were cultured for four weeks to mature before labeling. After four weeks in culture, 13C6-labeled leucine was added to the cortical maturation media at 105mg/L to make a solution comprised of 50% mol (100% TTR) labeled media. The iPSC-derived neurons were cultured in labeled media for two weeks, with fresh media changes twice weekly. After two weeks of label, neurons were washed with DMEM/F12 and cultured in cortical maturation media free of label for 21 days. Media and cells were collected every three days. Media was treated with protease inhibitors and centrifuged at 1,000xg for 10 minutes at 4ºC and transferred to fresh microcentrifuge tubes and stored at 80ºC until analysis. Cell pellets were solubilized in 1% NP-40 and centrifuged to remove insoluble fraction before immunoprecipitation with tau antibodies and analyzed by MS.
Tau SILK in humans
Ten-day oral labeling studies involving healthy participants were performed as previously described (Crisp et al., 2015), with participants receiving 1 g/day of L-[U-13C6]-leucine divided into 3 equal doses for 10 days, and 3–5 lumbar punctures (LPs) performed in up to 80 days. Intravenous infusion studies involving participants with and without AD pathology were performed in a similar manner to previous Ab studies (Bateman et al., 2006). Participants were admitted to Clinical Research Unit (CRU) and were admin-istered 4mg/kg/hr 13C6-leucine for 8, 16, or 24hrs while on low-leucine diet (500–700mg leucine per day). After labeling, participants resumed a normal diet. LPs were performed approximately 1–4, 9, 14, 60, and 120 days after labeling began (actual time points differed slightly between participants). Blood draws were performed every other hour during infusion and after each LP.
Measuring labeling in the human brain
One participant donated his brain eight days after receiving 800mg bolus i.v. infusion 13C6-leucine. Brain was autopsied at Washington University Knight ADRC Histology Core and 5g of frozen tissues were obtained from frontal, occipital, temporal, parietal regions in addition to cerebellum and thalamus as internal controls (Figures S6A and S6B). Soluble tau was separated from putative tau aggregates expected in AD brain by enrichment and purification by ultracentrifugation as described above. This soluble fraction was subjected to tau IP/MS analyses. The ratio of labeled versus unlabeled tau was measured in triplicates by MS. Because the plasma free leucine measurement of this participant was not available, labeling of the brain was normalized using area under the curve (AUC) of the plasma free leucine in the 800mg i.v. bolus participants (an average of n = 20) and 16hr infusion (an average of n = 2) participants (Figures S6C and S6D).
Plasma and CSF free 13C6-leucine measurement
Plasma and CSF free 13C6-leucine enrichment was measured as described previously (Crisp et al., 2015; Potter et al., 2013) with modifications. Briefiy, plasma and CSF proteins were precipitated with 10% trichloroacetic acid overnight at 4 C, and after centrifugation at 21,000 g for 10 minutes, the supernatant was chemically derivatized to form the N-heptafluorobutyryl n-propyl esters of plasma-free amino acids. 13C6-leucine enrichment was quantified using capillary gas chromatography–negative chemical ionization–quadrupole mass spectrometry (GC-MS; Agilent 6890N Gas Chromatograph and Agilent 5973N Mass Selective Detector) and analyzed using ChemStation software with selected ion monitoring of ions at m/z 349.1 and 355.1. Labeled/unlabeled ratios were obtained as TTR and converted to mole fraction label (MFL) to account for the bias that occurs at high stable tracer enrichments using the following equation: MFL = TTR/(1 + TTR).
Alternatively, plasma free leucine was measured using ice-cold acetone (Sigma 270725) for protein precipitation, and the supernatant was separated into organic and aqueous phases using hexane and water. The aqueous fraction was dried down with SpeedVac, and reconstituted as tert-butyldimethylsilyl (tBDMS) derivative by adding 100 mL 1:1 acetonitrile (Sigma 34851): N-tert-Butyldimethylsilyl-N-methyltrifluoroacetamide + 1% tert-Butylchlorodimethylsilane (Regis Technologies 1–270143). Selected ion monitoring of m/z 200 and 205 ions was performed (the m/z 200 fragment loses C-1 of leucine), and m/z 205/200 peak area ratios were calibrated against a set of 13C6 -leucine isotopic enrichment standards in natural 12C6-leucine with TTR ranging from 0–0.60.
Compartmental modeling
Modeling was conducted using the SAAM II software (The Epsilon Group, Charlottesville, VA). The model consists of a 2-compartment system to represent the free 13C6-leucine enrichment time course, a delay element, and CSF tau (Figure S7A). The FTR representing irreversible loss of tau is optimized to fit the shape of the CSF tau enrichment time course. Half-life (t1/2) is defined as ln2/FTR.
The model used plasma and CSF free 13C6-leucine time course curves during and after discontinuing the oral ingestion ori.v. infusion of the 13C6-leucine, respectively, as a precursor to define the appearance of label in CSF tau. Figure S7 shows the model fits for CSF tau with the oral and infusion tracer protocol. We modified the compartmental modeling from previous Ab (short half-life, infusion labeling) and SOD1 (longer half-life, oral labeling) studies in which we used plasma free 13C6-leucine as a sole precursor to model the CNS protein kinetics (Crisp et al., 2015; Patterson et al., 2015). The time delay element (Figure S7A) was a variable parameter only for the i.v. infusion protocol; the first CSF tau sample was obtained at 1–2 days with that protocol, and the data identified a brief time delay (~1–2 days) in the appearance of tracer in CSF tau (Figures S7H–S7K). This is similar to the observation in vitro of a three-day delay from intracellular to extracellular labeled tau release and suggests a time-delayed biological process for the extracellular transport of tau.
Amyloid and Tau PET imaging
T1-weighted images (1mm × 1mm × 1.2mm resolution) were acquired on a 3T Siemens scanner using an MPRAGE sequence and underwent volumetric segmentation using Freesurfer 5.3(Fischl et al., 2002). PET imaging were performed as described previously (Brier et al., 2016; Gordon et al., 2016; Mishra et al., 2017; Su et al., 2013). Briefly, Ab PET imaging was performed with florbetapir ([F-18]AV-45) acquired on a Biograph mMR scanner and attenuation corrected offline using a computed tomography (CT). Tau PET imaging was performed with flortaucipir ([F-18]- AV-1451). Tau PET data were acquired on a Siemens Biograph 40 PET/CT scanner. PET data were processed using a region of interest approach (Su et al., 2013, 2015). Regions were derived from the Freesurfer Desikan atlas. Regional values were converted to standardized uptake value ratios (SUVRs) using the cerebellar gray as the reference. Partial-volume correction was performed using a regional spread function (RSF) technique (Rousset et al., 1998; Su et al., 2015). For AV-45 and AV-1451, data from the 50–70 and 80–100 minute post-injection window were used for the analysis, respectively. Aβ PET positivity from AV-45 scans was defined as a mean cortical SUVR of 1.22.
QUANTIFICATION AND STATISTICAL ANALYSIS
Calculating Tau SILK measures in humans
The area under corresponding chromatographic peak profiles were calculated and expressed as an area ratio using Xcalibur software (Thermo Fisher Scientific, San Jose, CA). TTR or the ratio of labeled versus unlabeled tau was measured in triplicates by MS. MS measurement were performed blinded to the demographics, cognitive status, amyloid PET and tau PET measures of the participants. Immunoprecipitation and MS analyses from each participant was repeated 1–3 times using fresh aliquots of CSF in a randomized order and the data was compared using Bland Altman plot to confirm reproducibility and minimal batch effects. The data from a single MS run was locked and utilized in this manuscript (Table 3). A single FTR was calculated from triplicate MS data points using SAAM II software as described above.
Calculating Tau Half-life in iPSC-derived neurons
iPSC-derived neurons derived from 2 iPSC lines were cultured in duplicates (a total of 4 biological replicates), labeled and analyzed. N represents number of cell lines analyzed (Tables 1 and 2). For some cell lines, cell density and absolute amount of tau in the lysate and media were not sufficient to quantify TTR, especially for less abundant peptides (i.e., 4R peptides), and were excluded from results (Tables 1 and 2; N < 4). TTR for each time points were obtained from MS triplicate run. A single half-life was calculated these averaged points. Half-lives of the tau peptides in the iPSC-derived neurons were calculated by fitting the kinetic curve exponential decay y = ae-kx. Constant k is used to calculate t1/2 = ln(2)/k.
Statistics
Data are represented as mean ± SD, unless otherwise specified. After confirming the normal distribution of the data, one-way ANOVA followed by post hoc analyses (Tukey test) was performed for comparing tau peptides half-lives and CSF tau concentrations by Pearson correlation analyses were used to analyze correlation between tau SILK, PET measures and CSF tau concentration in tau SILK studies.
Supplementary Material
Highlights.
Multiple forms of tau exist in the human brain, CSF, and iPSC-derived neurons
Newly synthesized tau is truncated and actively released by human neurons
Fibrillogenic forms of tau have shorter half-lives than non fibrillogenic forms
Tau production rate positively correlates with amyloid plaque burden
ACKNOWLEDGMENTS
This work was supported by the BrightFocus Foundation (A2014384S) (R.J.B.), Tau SILK Consortium (AbbVie, Biogen, and Eli Lily; R.J.B.), NIH (R01NS095773) (R.J.B.), MetLife Foundation (R.J.B.), Knight ADRC pilot grant P50AG05681 (C.S.), Coins for Alzheimer’s Research Trust (CART) grant (C.S.), Barnes-Jewish Hospital Foundation pilot grant UL1TR002345 (C.S.), the 41st Kanae Foundation for the Promotion of Science Fellowship (C.S.), McDonnell Science Grant for Neuroscience (C.M.K. and C.S.), NIH (R01NS078398) (T.M.M), ALS Association (2427) (T.M.M.), NIH (K01 AG046374) (C.M.K.), NIH (P30DK056341) (Washington University Nutrition Obesity Research Center; B.W.P.), DIAN-TU Pharma Consortium (https://dian.wustl.edu/our-research/the-pharma-consortium/) (R.J.B. and C.M.K.), Barnes-Jewish Hospital Foundation (T.L.S.B.), NIH (P01AG003991) (T.L.S.B), NIH (UL1TR000448) (T.L.S.B.), NIH (P30NS098577) (T.L.S.B.), NIH (P01AG026276) (T.L.S.B.), NIH (K01 AG053474) (B.A.G.), Tau Consortium (C.M.K., R.J.B., and T.M.M.), Alzheimer’s Association Research Fellowship (AARF-16-443265) (N.R.B.), and cores, resources, and effort provided by Washington University Knight Alzheimer’s Research Center (NIH P50AG005681), Biomedical Mass Spectrometry Research Facility (NIH P41GM103422), Diabetes Research Center (NIH P30DK020579), and the Nutrition Obesity Research Center (NIH P30DK056341). This work was supported by access to equipment made possible by the Hope Center for Neurological Disorders, and the Departments of Neurology and Psychiatry at Washington University School of Medicine. We thank the participants and their families for their contributions to this study, including Andrew Jackson Bateman, who was a consummate believer in the human mind and spirit. We thank ADRC clinical core and Dr. John Morris for supporting our study; Dr. David Holtzman and Ms. Hong Jiang for HJ antibodies; Dr. Lester Binder for the Tau12, Tau13, and Tau7 antibodies; Dr. Sungsu Kim for HEK cells and discussion; Ms. Rita Martinez for iPSC-derived neuron culture; Cheryl Frank-fater and Freida Custodio for assistance with GC-MS analyses; Ms. Melody Li, Wendy Sigurdson, and Tamara Donahue for assistance with recruitment; Dr. Nigel Cairns for discussion on brain cutting; Ms. Erin Franklin for assistance with sample request; Dr. Gregg Day for collecting CSF from normal controls; Mr. Paul Moiseyev for preparing brain lysate; Drs. Robert Swarm and Lesly Rao for performing LPs; and members of the Bateman lab for discussion, in particular Dr. Katrina Paumier and Ms. Terry Hicks for assistance in editing the manuscript.
Footnotes
SUPPLEMENTAL INFORMATION
Supplemental Information includes eight figures and can be found with this article online at https://doi.org/10.1016/j.neuron.2018.02.015.
DECLARATION OF INTERESTS
Washington University and R.J.B. have equity ownership interest in C2N Diagnostics and may receive royalty income based on technology licensed by Washington University to C2N Diagnostics. R.J.B. receives income from C2N Diagnostics for serving on the Scientific Advisory Board, and B.W.P. receives consultation income from C2N Diagnostics. T.L.S.B. participates in research sponsored by Avid Radiopharmaceuticals, Eli Lilly, Roche, Johnson & Johnson, and Biogen. Washington University has submitted the U.S. non-provisional patent application “Methods for measuring the metabolism of CNS derived biomolecules in vivo,” serial #12/267,974 (R.J.B. and K.G.M.), and “Tau kinetics measurements,” serial #CA 2962969 (R.J.B., T.M.M., K.G.M., and C.S.). The remaining co-authors have no conflicts to disclose.
REFERENCES
- Baker M, Litvan I, Houlden H, Adamson J, Dickson D, Perez-Tur J, Hardy J, Lynch T, Bigio E, and Hutton M (1999). Association of an extended haplotype in the tau gene with progressive supranuclear palsy. Hum. Mol. Genet 8, 711–715. [DOI] [PubMed] [Google Scholar]
- Ban H, Nishishita N, Fusaki N, Tabata T, Saeki K, Shikamura M, Takada N, Inoue M, Hasegawa M, Kawamata S, and Nishikawa S (2011). Efficient generation of transgene-free human induced pluripotent stem cells (iPSCs) by temperature-sensitive Sendai virus vectors. Proc. Natl. Acad. Sci. USA 108, 14234–14239. [DOI] [PMC free article] [PubMed] [Google Scholar]
- Barthélemy NR, Fenaille F, Hirtz C, Sergeant N, Schraen-Maschke S, Vialaret J, Buée L, Gabelle A, Junot C, Lehmann S, and Becher F (2016). Tau protein quantification in human cerebrospinal fluid by targeted mass spectrometry at high sequence coverage provides insights into its primary structure heterogeneity. J. Proteome Res 15, 667–676. [DOI] [PubMed] [Google Scholar]
- Barthélemy NR, Bateman RJ, Marin P, Becher F, Sato C, Lehmann S, and Gabelle A (2017). Tau hyperphosphorylation on T217 in cerebrospinal fluid is specifically associated to amyloid-β pathology. bioRxiv. 10.1101/226977. [DOI] [Google Scholar]
- Bateman RJ, Munsell LY, Morris JC, Swarm R, Yarasheski KE, and Holtzman DM (2006). Human amyloid-beta synthesis and clearance rates as measured in cerebrospinal fluid in vivo. Nat. Med 12, 856–861. [DOI] [PMC free article] [PubMed] [Google Scholar]
- Bateman RJ, Xiong C, Benzinger TLS, Fagan AM, Goate A, Fox NC, Marcus DS, Cairns NJ, Xie X, Blazey TM, et al. ; Dominantly Inherited Alzheimer Network (2012). Clinical and biomarker changes in dominantly in herited Alzheimer’s disease. N. Engl. J. Med 367, 795–804. [DOI] [PMC free article] [PubMed] [Google Scholar]
- Biernat J, Gustke N, Drewes G, Mandelkow EM, and Mandelkow E (1993). Phosphorylation of Ser262 strongly reduces binding of tau to microtubules: distinction between PHF-like immunoreactivity and microtubule binding. Neuron 11, 153–163. [DOI] [PubMed] [Google Scholar]
- Borroni B, Gardoni F, Parnetti L, Magno L, Malinverno M, Saggese E, Calabresi P, Spillantini MG, Padovani A, and Di Luca M (2009). Pattern of Tau forms in CSF is altered in progressive supranuclear palsy. Neurobiol. Aging 30, 34–40. [DOI] [PubMed] [Google Scholar]
- Braak H, and Braak E (1995). Staging of Alzheimer’s disease-related neuro fibrillary changes. Neurobiol. Aging 16, 271–278, discussion 278–284. [DOI] [PubMed] [Google Scholar]
- Brier MR, Gordon B, Friedrichsen K, McCarthy J, Stern A, Christensen J, Owen C, Aldea P, Su Y, Hassenstab J, et al. (2016). Tau and Ab imaging, CSF measures, and cognition in Alzheimer’s disease . Sci. Transl. Med 8, 338ra66. [DOI] [PMC free article] [PubMed] [Google Scholar]
- Bright J, Hussain S, Dang V, Wright S, Cooper B, Byun T, Ramos C, Singh A, Parry G, Stagliano N, and Griswold-Prenner I (2015). Human secreted tau increases amyloid-beta production. Neurobiol. Aging 36, 693–709. [DOI] [PubMed] [Google Scholar]
- Buée L, Bussière T, Buée-Scherrer V, Delacourte A, and Hof PR (2000). Tau protein isoforms, phosphorylation and role in neurodegenerative disorders. Brain Res. Brain Res. Rev 33, 95–130. [DOI] [PubMed] [Google Scholar]
- Cairns NJ, Bigio EH, Mackenzie IRA, Neumann M, Lee VM-Y, Hatanpaa KJ, White CL 3rd, Schneider JA, Grinberg LT, Halliday G, et al. ; Consortium for Frontotemporal Lobar Degeneration (2007). Neuropathologic diagnostic and nosologic criteria for frontotemporal lobar degeneration: consensus of the Consortium for Frontotemporal Lobar Degeneration. Acta Neuropathol. 114, 5–22. [DOI] [PMC free article] [PubMed] [Google Scholar]
- Carmel G, Mager EM, Binder LI, and Kuret J (1996). The structural basis of monoclonal antibody Alz50’s selectivity for Alzheimer’s disease pathology. J. Biol. Chem 271, 32789–32795. [DOI] [PubMed] [Google Scholar]
- Chai X, Dage JL, and Citron M (2012). Constitutive secretion of tau protein by an unconventional mechanism. Neurobiol. Dis 48, 356–366. [DOI] [PubMed] [Google Scholar]
- Combs B, Hamel C, and Kanaan NM (2016). Pathological conformations involving the amino terminus of tau occur early in Alzheimer’s disease and are differentially detected by monoclonal antibodies. Neurobiol. Dis 94, 18–31. [DOI] [PMC free article] [PubMed] [Google Scholar]
- Crisp MJ, Mawuenyega KG, Patterson BW, Reddy NC, Chott R, Self WK, Weihl CC, Jockel-Balsarotti J, Varadhachary AS, Bucelli RC, et al. (2015). In vivo kinetic approach reveals slow SOD1 turnover in the CNS. J. Clin. Invest 125, 2772–2780. [DOI] [PMC free article] [PubMed] [Google Scholar]
- de Calignon A, Polydoro M, Suárez-Calvet M, William C, Adamowicz DH, Kopeikina KJ, Pitstick R, Sahara N, Ashe KH, Carlson GA, et al. (2012). Propagation of tau pathology in a model of early Alzheimer’s disease. Neuron 73, 685–697. [DOI] [PMC free article] [PubMed] [Google Scholar]
- Derisbourg M, Leghay C, Chiappetta G, Fernandez-Gomez F-J, Laurent C, Demeyer D, Carrier S, Buée-Scherrer V, Blum D, Vinh J, et al. (2015). Role of the Tau N-terminal region in microtubule stabilization revealed by new endogenous truncated forms. Sci. Rep 5, 9659. [DOI] [PMC free article] [PubMed] [Google Scholar]
- Desikan RS, Schork AJ, Wang Y, Witoelar A, Sharma M, McEvoy LK, Holland D, Brewer JB, Chen C-H, Thompson WK, et al. ; ADNI, ADGC, GERAD, CHARGE and IPDGC Investigators (2015). Genetic overlap between Alzheimer’s disease and Parkinson’s disease at the MAPT locus. Mol. Psychiatry 20, 1588–1595. [DOI] [PMC free article] [PubMed] [Google Scholar]
- DeVos SL, Goncharoff DK, Chen G, Kebodeaux CS, Yamada K, Stewart FR, Schuler DR, Maloney SE, Wozniak DF, Rigo F, et al. (2013). Antisense reduction of tau in adult mice protects against seizures.J. Neurosci 33, 12887–12897. [DOI] [PMC free article] [PubMed] [Google Scholar]
- DeVos SL, Miller RL, Schoch KM, Holmes BB, Kebodeaux CS, Wegener AJ, Chen G, Shen T, Tran H, Nichols B, et al. (2017). Tau reduction prevents neuronal loss and reverses pathological tau deposition and seeding in mice with tauopathy. Sci. Transl. Med 9, 1–10. [DOI] [PMC free article] [PubMed] [Google Scholar]
- Dickson DW, Kouri N, Murray ME, and Josephs KA (2011). Neuropathology of frontotemporal lobar degeneration-tau (FTLD-tau). J. Mol. Neurosci 45, 384–389. [DOI] [PMC free article] [PubMed] [Google Scholar]
- Ehrlich M, Hallmann A-L, Reinhardt P, Araúzo-Bravo MJ, Korr S, Röpke A, Psathaki OE, Ehling P, Meuth SG, Oblak AL, et al. (2015). Distinct neurodegenerative changes in an induced pluripotent stem cell model of frontotemporal dementia linked to mutant TAU protein. Stem Cell Reports 5, 83–96. [DOI] [PMC free article] [PubMed] [Google Scholar]
- Fagan AM, Xiong C, Jasielec MS, Bateman RJ, Goate AM, Benzinger TLS, Ghetti B, Martins RN, Masters CL, Mayeux R, et al. ; Dominantly Inherited Alzheimer Network (2014). Longitudinal change in CSF biomarkers in autosomal-dominant Alzheimer’s disease. Sci. Transl. Med 6, 226ra30. [DOI] [PMC free article] [PubMed] [Google Scholar]
- Ferreira A, and Caceres A (1991). Estrogen-enhanced neurite growth: evidence for a selective induction of Tau and stable microtubules. J. Neurosci 11, 392–400. [DOI] [PMC free article] [PubMed] [Google Scholar]
- Fischl B, Salat DH, Busa E, Albert M, Dieterich M, Haselgrove C, van der Kouwe A, Killiany R, Kennedy D, Klaveness S, et al. (2002). Whole brain segmentation: automated labeling of neuroanatomical structures in the human brain. Neuron 33, 341–355. [DOI] [PubMed] [Google Scholar]
- Fitzpatrick AWP, Falcon B, He S, Murzin AG, Murshudov G, Garringer HJ, Crowther RA, Ghetti B, Goedert M, and Scheres SHW (2017). Cryo-EM structures of tau filaments from Alzheimer’s disease. Nature 547, 185–190. [DOI] [PMC free article] [PubMed] [Google Scholar]
- Frost B, Jacks RL, and Diamond MI (2009). Propagation of tau misfolding from the outside to the inside of a cell. J. Biol. Chem 284, 12845–12852. [DOI] [PMC free article] [PubMed] [Google Scholar]
- Funk KE, Mirbaha H, Jiang H, Holtzman DM, and Diamond MI (2015). Distinct therapeutic mechanisms of Tau antibodies: promoting microglial clearance versus blocking neuronal uptake. J. Biol. Chem 290, 21652–21662. [DOI] [PMC free article] [PubMed] [Google Scholar]
- Gordon BA, Friedrichsen K, Brier M, Blazey T, Su Y, Christensen J, Aldea P, McConathy J, Holtzman DM, Cairns NJ, et al. (2016). The relationship between cerebrospinal fluid markers of Alzheimer pathology and positron emission tomography tau imaging. Brain 139, 2249–2260. [DOI] [PMC free article] [PubMed] [Google Scholar]
- Guillozet-Bongaarts AL, Garcia-Sierra F, Reynolds MR, Horowitz PM, Fu Y, Wang T, Cahill ME, Bigio EH, Berry RW, and Binder LI (2005). Tau truncation during neurofibrillary tangle evolution in Alzheimer’s disease. Neurobiol. Aging 26, 1015–1022. [DOI] [PubMed] [Google Scholar]
- Haase C, Stieler JT, Arendt T, and Holzer M (2004). Pseudophosphorylation of tau protein alters its ability for self-aggregation. J. Neurochem 88, 1509–1520. [DOI] [PubMed] [Google Scholar]
- Hampel H, Blennow K, Shaw LM, Hoessler YC, Zetterberg H, and Trojanowski JQ (2010). Total and phosphorylated tau protein as biological markers of Alzheimer’s disease. Exp. Gerontol 45, 30–40. [DOI] [PMC free article] [PubMed] [Google Scholar]
- Hanger DP, Betts JC, Loviny TL, Blackstock WP, and Anderton BH (1998). New phosphorylation sites identified in hyperphosphorylated tau (paired helical filament-tau) from Alzheimer’s disease brain using nanoelectrospray mass spectrometry. J. Neurochem 71, 2465–2476. [DOI] [PubMed] [Google Scholar]
- Hesse C, Rosengren L, Andreasen N, Davidsson P, Vanderstichele H, Vanmechelen E, and Blennow K (2001). Transient increase in total tau but not phospho-tau in human cerebrospinal fluid after acute stroke. Neurosci. Lett 297, 187–190. [DOI] [PubMed] [Google Scholar]
- Horowitz PM, Patterson KR, Guillozet-Bongaarts AL, Reynolds MR, Carroll CA, Weintraub ST, Bennett DA, Cryns VL, Berry RW, and Binder LI (2004). Early N-terminal changes and caspase-6 cleavage of tau in Alzheimer’s disease. J. Neurosci 24, 7895–7902. [DOI] [PMC free article] [PubMed] [Google Scholar]
- Horowitz PM, LaPointe N, Guillozet-Bongaarts AL, Berry RW, and Binder LI (2006). N-terminal fragments of tau inhibit full-length tau polymerization in vitro. Biochemistry 45, 12859–12866. [DOI] [PubMed] [Google Scholar]
- Iba M, Guo JL, McBride JD, Zhang B, Trojanowski JQ, and Lee VM-Y (2013). Synthetic tau fibrils mediate transmission of neurofibrillary tangles in a transgenic mouse model of Alzheimer’s-like tauopathy.J. Neurosci 33, 1024–1037. [DOI] [PMC free article] [PubMed] [Google Scholar]
- Kanmert D, Cantlon A, Muratore CR, Jin M, O’Malley TT, Lee G, Young-Pearse TL, Selkoe DJ, and Walsh DM (2015). C-terminally truncated forms of Tau, but not full-length Tau or its C-terminal fragments, are released from neurons independently of cell death. J. Neurosci 35, 10851–10865. [DOI] [PMC free article] [PubMed] [Google Scholar]
- Karch CM, Jeng AT, and Goate AM (2012). Extracellular Tau levels are influenced by variability in Tau that is associated with tauopathies. J. Biol. Chem 287, 42751–42762. [DOI] [PMC free article] [PubMed] [Google Scholar]
- Kfoury N, Holmes BB, Jiang H, Holtzman DM, and Diamond MI (2012). Trans-cellular propagation of Tau aggregation by fibrillar species. J. Biol. Chem 287, 19440–19451. [DOI] [PMC free article] [PubMed] [Google Scholar]
- Liu W-K, Moore WT, Williams RT, Hall FL, and Yen S-H (1993). Application of synthetic phospho- and unphospho- peptides to identify phosphorylation sites in a subregion of the tau molecule, which is modified in Alzheimer’s disease. J. Neurosci. Res 34, 371–376. [DOI] [PubMed] [Google Scholar]
- Liu L, Drouet V, Wu JW, Witter MP, Small SA, Clelland C, and Duff K (2012). Trans-synaptic spread of tau pathology in vivo. PLoS ONE 7, e31302. [DOI] [PMC free article] [PubMed] [Google Scholar]
- Liu C, Song X, Nisbet R, and Götz J (2016). Co-immunoprecipitation with Tau isoform-specific antibodies reveals distinct protein interactions and high-lights a putative role for 2N Tau in disease. J. Biol. Chem 291, 8173–8188. [DOI] [PMC free article] [PubMed] [Google Scholar]
- LoPresti P, Szuchet S, Papasozomenos SC, Zinkowski RP, and Binder LI (1995). Functional implications for the microtubule-associated protein tau: localization in oligodendrocytes. Proc. Natl. Acad. Sci. USA 92, 10369–10373. [DOI] [PMC free article] [PubMed] [Google Scholar]
- Luo W, Liu W, Hu X, Hanna M, Caravaca A, and Paul SM (2015). Microglial internalization and degradation of pathological tau is enhanced by an anti-tau monoclonal antibody. Sci. Rep 5, 11161. [DOI] [PMC free article] [PubMed] [Google Scholar]
- Mair W, Muntel J, Tepper K, Tang S, Biernat J, Seeley WW, Kosik KS, Mandelkow E, Steen H, and Steen JA (2016). FLEXITau: quantifying post-translational modifications of Tau protein in vitro and in human disease. Anal. Chem 88, 3704–3714. [DOI] [PMC free article] [PubMed] [Google Scholar]
- Mandelkow E-M, Stamer K, Vogel R, Thies E, and Mandelkow E (2003). Clogging of axons by tau, inhibition of axonal traffic and starvation of synapses. Neurobiol. Aging 24, 1079–1085. [DOI] [PubMed] [Google Scholar]
- McAvoy T, Lassman ME, Spellman DS, Ke Z, Howell BJ, Wong O, Zhu L, Tanen M, Struyk A, and Laterza OF (2014). Quantification of tau in cerebrospinal fluid by immunoaffinity enrichment and tandem mass spectrometry. Clin. Chem 60, 683–689. [DOI] [PubMed] [Google Scholar]
- Meredith JE Jr., Sankaranarayanan S, Guss V, Lanzetti AJ, Berisha F, Neely RJ, Slemmon JR, Portelius E, Zetterberg H, Blennow K, et al. (2013). Characterization of novel CSF Tau and ptau biomarkers for Alzheimer’s disease. PLoS ONE 8, e76523. [DOI] [PMC free article] [PubMed] [Google Scholar]
- Mishra S, Gordon BA, Su Y, Christensen J, Friedrichsen K, Jackson K, Hornbeck R, Balota DA, Cairns NJ, Morris JC, et al. (2017). AV-1451 PET imaging of tau pathology in preclinical Alzheimer disease: Defining a summary measure. Neuroimage 161, 171–178. [DOI] [PMC free article] [PubMed] [Google Scholar]
- Morita T, and Sobue K (2009). Specification of neuronal polarity regulated by local translation of CRMP2 and Tau via the mTOR-p70S6K pathway. J. Biol. Chem 284, 27734–27745. [DOI] [PMC free article] [PubMed] [Google Scholar]
- Papasozomenos SC, and Binder LI (1987). Phosphorylation determines two distinct species of Tau in the central nervous system. Cell Motil. Cytoskeleton 8, 210–226. [DOI] [PubMed] [Google Scholar]
- Patterson BW, Elbert DL, Mawuenyega KG, Kasten T, Ovod V, Ma S, Xiong C, Chott R, Yarasheski K, Sigurdson W, et al. (2015). Age and amyloid effects on human central nervous system amyloid-beta kinetics. Ann. Neurol 78, 439–453. [DOI] [PMC free article] [PubMed] [Google Scholar]
- Pooler AM, Phillips EC, Lau DHW, Noble W, and Hanger DP (2013). Physiological release of endogenous tau is stimulated by neuronal activity. EMBO Rep 14, 389–394. [DOI] [PMC free article] [PubMed] [Google Scholar]
- Pooler AM, Noble W, and Hanger DP (2014). A role for tau at the synapse in Alzheimer’s disease pathogenesis. Neuropharmacology 76 (Pt A), 1–8. [DOI] [PubMed] [Google Scholar]
- Portelius E, Hansson SF, Tran AJ, Zetterberg H, Grognet P, Vanmechelen E, Höglund K, Brinkmalm G, Westman-Brinkmalm A, Nordhoff E, et al. (2008). Characterization of tau in cerebrospinal fluid using mass spectrometry. J. Proteome Res 7, 2114–2120. [DOI] [PubMed] [Google Scholar]
- Potter R, Patterson BW, Elbert DL, Ovod V, Kasten T, Sigurdson W, Mawuenyega K, Blazey T, Goate A, Chott R, et al. (2013). Increased in vivo amyloid-b42 production, exchange, and loss in presenilin mutation carriers. Sci. Transl. Med 5, 189ra77. [DOI] [PMC free article] [PubMed] [Google Scholar]
- Price JC, Guan S, Burlingame A, Prusiner SB, and Ghaemmaghami S (2010). Analysis of proteome dynamics in the mouse brain. Proc. Natl. Acad. Sci. USA 107, 14508–14513. [DOI] [PMC free article] [PubMed] [Google Scholar]
- Rousset OG, Ma Y, and Evans AC (1998). Correction for partial volume effects in PET: principle and validation. J. Nucl. Med 39, 904–911. [PubMed] [Google Scholar]
- Sanders DW, Kaufman SK, DeVos SL, Sharma AM, Mirbaha H, Li A, Barker SJ, Foley AC, Thorpe JR, Serpell LC, et al. (2014). Distinct tau prion strains propagate in cells and mice and define different tauopathies. Neuron 82, 1271–1288. [DOI] [PMC free article] [PubMed] [Google Scholar]
- Silva MC, Cheng C, Mair W, Almeida S, Fong H, Biswas MHU, Zhang Z, Huang Y, Temple S, Coppola G, et al. (2016). Human iPSC-derived neuronal model of Tau-A152T frontotemporal dementia reveals Tau-mediated mechanisms of neuronal vulnerability. Stem Cell Reports 7, 325–340. [DOI] [PMC free article] [PubMed] [Google Scholar]
- Sjögren M, Vanderstichele H,Ågren H, Zachrisson O, Edsbagge M, Wikkelsø C, Skoog I, Wallin A, Wahlund L-O, Marcusson J, et al. (2001). Tau and Abeta42 in cerebrospinal fluid from healthy adults 21–93 years of age: establishment of reference values. Clin. Chem 47, 1776–1781. [PubMed] [Google Scholar]
- Sposito T, Preza E, Mahoney CJ, Setó-Salvia N, Ryan NS, Morris HR, Arber C, Devine MJ, Houlden H, Warner TT, et al. (2015). Developmental regulation of tau splicing is disrupted in stem cell-derived neurons from frontotemporal dementia patients with the 10 + 16 splice-site mutation in MAPT. Hum. Mol. Genet 24, 5260–5269. [DOI] [PMC free article] [PubMed] [Google Scholar]
- Stoothoff WH, and Johnson GVW (2005). Tau phosphorylation: physiological and pathological consequences. Biochim. Biophys. Acta 1739, 280–297. [DOI] [PubMed] [Google Scholar]
- Su Y, D’Angelo GM, Vlassenko AG, Zhou G, Snyder AZ, Marcus DS, Blazey TM, Christensen JJ, Vora S, Morris JC, et al. (2013). Quantitative analysis of PiB-PET with FreeSurfer ROIs. PLoS ONE 8, e73377. [DOI] [PMC free article] [PubMed] [Google Scholar]
- Su Y, Blazey TM, Snyder AZ, Raichle ME, Marcus DS, Ances BM, Bateman RJ, Cairns NJ, Aldea P, Cash L, et al. ; Dominantly Inherited Alzheimer Network (2015). Partial volume correction in quantitative amyloid imaging. Neuroimage 107, 55–64. [DOI] [PMC free article] [PubMed] [Google Scholar]
- Sun Q, and Gamblin TC (2009). Pseudohyperphosphorylation causing AD-like changes in tau has significant effects on its polymerization. Biochemistry 48, 6002–6011. [DOI] [PMC free article] [PubMed] [Google Scholar]
- Szendrei GI, Lee VM-Y, and Otvos L Jr. (1993). Recognition of the minimal epitope of monoclonal antibody Tau-1 depends upon the presence of a phosphate group but not its location. J. Neurosci. Res 34, 243–249. [DOI] [PubMed] [Google Scholar]
- Takahashi K, and Yamanaka S (2006). Induction of pluripotent stem cells from mouse embryonic and adult fibroblast cultures by defined factors. Cell 126, 663–676. [DOI] [PubMed] [Google Scholar]
- Toledo JB, Xie SX, Trojanowski JQ, and Shaw LM (2013). Longitudinal change in CSF Tau and Ab biomarkers for up to 48 months in ADNI. Acta Neuropathol 126, 659–670. [DOI] [PMC free article] [PubMed] [Google Scholar]
- Trabzuni D, Wray S, Vandrovcova J, Ramasamy A, Walker R, Smith C, Luk C, Gibbs JR, Dillman A, Hernandez DG, et al. (2012). MAPT expression and splicing is differentially regulated by brain region: relation to genotype and implication for tauopathies. Hum. Mol. Genet 21, 4094–4103. [DOI] [PMC free article] [PubMed] [Google Scholar]
- Wang Y, and Mandelkow E (2016). Tau in physiology and pathology. Nat. Rev. Neurosci 17, 5–21. [DOI] [PubMed] [Google Scholar]
- Wu JW, Hussaini SA, Bastille IM, Rodriguez GA, Mrejeru A, Rilett K, Sanders DW, Cook C, Fu H, Boonen RACM, et al. (2016). Neuronal activity enhances tau propagation and tau pathology in vivo. Nat. Neurosci 19, 1085–1092. [DOI] [PMC free article] [PubMed] [Google Scholar]
- Yamada K, Cirrito JR, Stewart FR, Jiang H, Finn MB, Holmes BB, Binder LI, Mandelkow E-M, Diamond MI, Lee VM-Y, and Holtzman DM (2011). In vivo microdialysis reveals age-dependent decrease of brain interstitial fluid tau levels in P301S human tau transgenic mice. J. Neurosci 31, 13110–13117. [DOI] [PMC free article] [PubMed] [Google Scholar]
- Yamada K, Holth JK, Liao F, Stewart FR, Mahan TE, Jiang H, Cirrito JR, Patel TK, Hochgrafe K, Mandelkow E-M, and Holtzman DM (2014). Neuronal activity regulates extracellular tau in vivo. J. Exp. Med 211, 387–393. [DOI] [PMC free article] [PubMed] [Google Scholar]
- Yamada K, Patel TK, Hochgrafe K, Mahan TE, Jiang H, Stewart FR, Mandelkow E-M, and Holtzman DM (2015). Analysis of in vivo turnover of tau in a mouse model of tauopathy. Mol. Neurodegener 10, 55. [DOI] [PMC free article] [PubMed] [Google Scholar]
- Yanamandra K, Kfoury N, Jiang H, Mahan TE, Ma S, Maloney SE, Wozniak DF, Diamond MI, and Holtzman DM (2013). Anti-tau antibodies that block tau aggregate seeding in vitro markedly decrease pathology and improve cognition in vivo. Neuron 80, 402–414. [DOI] [PMC free article] [PubMed] [Google Scholar]
- Yokoyama JS, Karch CM, Fan CC, Bonham LW, Kouri N, Ross OA, Rademakers R, Kim J, Wang Y, Höglinger GU, et al. ; International FTD-Genomics Consortium (IFGC) (2017). Shared genetic risk between corticobasal degeneration, progressive supranuclear palsy, and frontotemporal dementia. Acta Neuropathol. 133, 825–837. [DOI] [PMC free article] [PubMed] [Google Scholar]
- Zempel H, Dennissen FJA, Kumar Y, Luedtke J, Biernat J, Mandelkow E-M, and Mandelkow E (2017). Axodendritic sorting and pathological missorting of Tau are isoform-specific and determined by axon initial segment architecture. J. Biol. Chem 292, 12192–12207. [DOI] [PMC free article] [PubMed] [Google Scholar]
Associated Data
This section collects any data citations, data availability statements, or supplementary materials included in this article.