

Summary
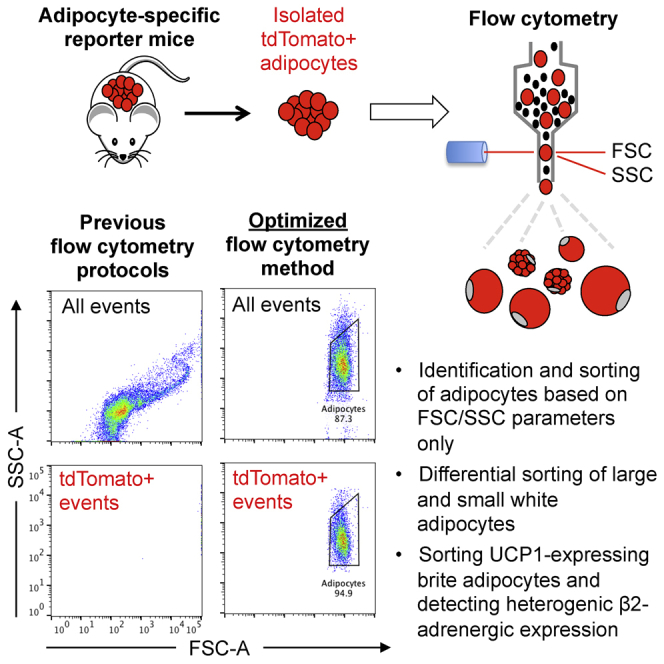
Adipocytes, once considered simple lipid-storing cells, are rapidly emerging as complex cells with many biologically diverse functions. A powerful high-throughput method for analyzing single cells is flow cytometry. Several groups have attempted to analyze and sort freshly isolated adipocytes; however, using an adipocyte-specific reporter mouse, we demonstrate that these studies fail to detect the majority of white adipocytes. We define critical settings required for adipocyte flow cytometry and provide a rigid strategy for analyzing and sorting white and brown adipocyte populations. The applicability of our protocol is shown by sorting mouse adipocytes based on size or UCP1 expression and demonstrating that a subset of human adipocytes lacks the β2-adrenergic receptor, particularly in the insulin-resistant state. In conclusion, the present study confers key technological insights for analyzing and sorting mature adipocytes, opening up numerous downstream research applications.
Keywords: adipocyte, adipose tissue, flow cytometry, FACS, mouse, human, uncoupled protein 1, beta 2 adrenergic receptor
Graphical Abstract
Highlights
-
•
Protocol to sort freshly isolated adipocytes based on size or UCP1 expression
-
•
Previously described methods fail to detect the majority of white adipocytes
-
•
A subset of human adipocytes lacks the β2-adrenergic receptor
Freshly isolated adipocytes are a notoriously difficult cell type to study. Hagberg et al. provide a detailed flow cytometry protocol for the analysis and sorting of mouse and human adipocytes by defining the critical factors and conditions required for studying this specialized cell type and pinpointing common pitfalls.
Introduction
White adipocytes are large, unilocular, lipid-filled cells that make up approximately 30% of white adipose tissue (WAT) cells but the majority of WAT mass (Eto et al., 2009). These cells carry out our body’s major nutrient storing function, as well as having important endocrine and immune roles (Rutkowski et al., 2015). WAT also contains a number of other stromal cell types, collectively termed the stromal-vascular fraction (SVF). This fraction includes vascular cells, fibroblasts, tissue-resident immune cells, and adipocyte progenitor cells (pre-adipocytes) (Rosen and Spiegelman, 2014). In addition, both mice and humans have brown and/or brite (brown-in-white, also called beige) adipocytes, which are typically multilocular, have higher mitochondrial content than classical white adipocytes, and express the thermogenic protein uncoupling protein 1 (UCP1) (Shabalina et al., 2013, Wang and Seale, 2016). Brown UCP1+ adipocytes are found in mice in discrete depots (classic brown adipose tissue [BAT]), whereas brown adipocytes in humans and brite adipocytes in mice and humans are found dispersed within WAT (Wang and Seale, 2016). Because of their potential capacity to dissipate energy, brown and brite adipocytes have received much attention in obesity research (Nedergaard and Cannon, 2010, Betz and Enerbäck, 2018). Despite this interest, the brite cells remain difficult to isolate from WAT and are hard to study at a single-cell level.
Flow cytometry is unique in facilitating multiparametric analysis of thousands of events at a single-cell level in a relatively short time (Cossarizza et al., 2017). In addition to quantifying fluorescence data from antibody and dye stainings, flow cytometry also classically provides approximate data on particle size using forward scatter (FSC) and granularity using side scatter (SSC). These parameters, with or without fluorescence labeling, can be used to analyze and sort pure cell populations of interest for downstream applications. This technique has been widely used to analyze normal-size cells, such as lymphocytes and cancerous cells; however, widespread use of flow cytometry for large cells, such as adipocytes, has been largely restricted (Cossarizza et al., 2017). Freshly isolated adipocytes are notoriously difficult to study at a single-cell level because of their large cell size (diameter 20–150 μm in mice and 40–200 μm in humans), fragile nature, and high buoyancy. Developing a protocol that allows for analyzing and sorting adipocytes using flow cytometry would thus considerably advance the ability to study these cells. In addition to enabling downstream molecular and metabolic analyses, flow cytometry would facilitate the efficient quantification of antibody and dye staining per adipocyte, independent of cell size—something that is currently tedious and challenging to perform.
Recently, a number of papers have described flow cytometric analysis and fluorescence-activated cell sorting (FACS) of freshly isolated white and brite adipocytes (Crossno et al., 2006, Majka et al., 2010, Majka et al., 2012, Majka et al., 2014, Rosenwald et al., 2013, Chau et al., 2014, Katz et al., 2014, Tang et al., 2016, Gavin et al., 2016, Wang et al., 2016, Boumelhem et al., 2017). Some reports have identified adipocytes as an SSC_high population that is positive for the neutral lipid dye LipidTOX (Thermo Fisher Scientific), as well as the adipocyte markers Adipoq and Plin1 (Majka et al., 2012, Majka et al., 2014, Rosenwald et al., 2013, Gavin et al., 2016). Others have identified a spiral-like population on FSCs/SSCs as mature adipocytes and validated this conclusion by staining with different combinations of lipid, membrane, and DNA dyes (Majka et al., 2010, Chau et al., 2014, Tang et al., 2016, Boumelhem et al., 2017). Despite the extensive work conducted in these studies, we demonstrate that the cellular identity of these defined flow cytometry populations is incorrect, in part because of the assumption that lipophilic dyes specifically stain adipocytes.
In the present study, we present a detailed flow cytometry method for the analysis and sorting of freshly isolated primary white, brite, and brown adipocytes, applicable for human and mouse samples. Our method allows for the efficient flow cytometric detection of white adipocytes based on size and granularity parameters only. We describe three critical components needed for successful adipocyte flow cytometry and use our protocol to retest the staining patterns of the most common lipophilic dyes in metabolic research. Previously unavailable downstream applications, such as sorting and transcriptional profiling of mouse white adipocytes by size and quantifying heterogeneity in human adipocyte ADRB2 expression, are also demonstrated.
Results
Using AdTomato Mice to Optimize Adipocyte Flow Cytometry
To unequivocally identify adipocytes using flow cytometry, we crossed an inducible Adiponectin-Cre/ERt mouse expressing Cre-recombinase specifically in white and brown adipocytes (Jeffery et al., 2014) with a Cre-driven tdTomato reporter mouse (Figures S1A and S1B). This yields mice that upon tamoxifen (TMX) treatment express fluorescent tdTomato protein in all adipocytes (called AdTomato mice hereafter). In line with previous reports (Jeffery et al., 2014), microscopic analysis of isolated AdTomato adipocytes showed that 99% of mature adipocytes in subcutaneous WAT (scWAT) and gonadal WAT (gWAT) and 92% of adipocytes in BAT) express tdTomato (Figures 1A and S1C–S1E). As expected, most SVF cells were tdTomato− (Figure 1A); however, a small population of tdTomato+ cells within the SVF fraction could also be seen, most likely representing differentiating pre-adipocytes (Figure S1F). Lipid from AdTomato adipocytes and cells isolated from wild-type (WT) mice or mice lacking either reporter genes showed no tdTomato fluorescence (Figure S1; data not shown). We confirm that the AdTomato reporter mouse efficiently labels the vast majority of mature fat cells in scWAT, gWAT, and BAT.
Figure 1.

Developing the Adipocyte Flow Cytometry Protocol
(A) Freshly isolated adipocytes and SVF cells from AdTomato and WT mice, stained with fluorescein isothiocyanate (FITC)-labeled lectin (green) and Hoechst (blue) and imaged for tdTomato expression (red). Scale bars, 100 μm; note the differences in length.
(B) Flow cytometry using standard settings for scWAT adipocytes and samples containing only pure mouse lipid or sunflower seed oil. Adipocyte samples show ungated and tdTomato+ (T+) gated events.
(C) Flow cytometry using optimized adipocyte flow cytometry settings for scWAT adipocytes, BAT adipocytes, or SVF cells, showing ungated and tdTomato+ (T+) or Hoechst+ (H+) gated events.
All of the experiments were repeated at least four times. See also Figures S1 and S2.
Recent flow cytometry studies have attributed mature adipocytes to either a spiral-like population or an SSC_high population when visualized using FSC/SSC (Majka et al., 2010, Majka et al., 2012, Majka et al., 2014, Chau et al., 2014, Gavin et al., 2016, Tang et al., 2016, Boumelhem et al., 2017). When attempting to detect AdTomato adipocytes using the same settings and sorter (Majka et al., 2014), we observed that all tdTomato+ events were saturated on FSC, rendering them out of scale and easy to miss (Figure 1B, left). Further analysis revealed very few tdTomato+ events found in the tdTomato (532-A) channel (≈5%–10% of total events; Figures S2A and S2B, b2). More important, all spiral-forming events on FSC/SSC were tdTomato− and therefore did not represent the bulk of mature adipocytes, contrary to previous suggestions (Majka et al., 2010, Chau et al., 2014, Tang et al., 2016, Boumelhem et al., 2017) (Figure 1B, b2). In our analysis of samples containing only pure mouse lipid or sunflower seed oil, we found that free lipid droplets alone cause a spiral-like population on FSC/SSC (in accordance with earlier observations [Fattaccioli et al., 2009]), such as the spiral-like population that was previously reported to be adipocytes (Figure 1B, right).
Using tdTomato+ adipocytes, we determined the optimal flow cytometry settings for detecting freshly isolated white adipocytes. This included using a larger nozzle (150 μm diameter), lowering the sheath pressure to 6 psi, and enhancing the detection of larger events. Unfixed adipocyte samples contained less debris than paraformaldehyde (PFA)-fixed samples and gave identical results; as such, unfixed adipocytes were used for all of the analyses, unless otherwise stated. These optimizations identified a panel of critical settings (Table S1), which when applied enables one to obtain a clear and representative visualization of WAT and BAT adipocytes and SVF cells using FSC/SSC only (Figures 1C and S2C–S2F). Using these settings, we show that unilocular white adipocytes from scWAT and gWAT do not have high SSC, in contrast to what has been reported previously (Majka et al., 2014). This is in line with the notion that these cells harbor a single, large lipid droplet with low internal complexity and hence low SSC. Conversely, multilocular brown adipocytes isolated from BAT had relatively high SSC, reflecting their multiple intracellular lipid droplets and high mitochondrial content (Figures 1C and S2D). SVF cells had lower FSC than WAT adipocytes and lower SSC than BAT adipocytes, forming a distinct population from white and brown adipocytes (Figure 1C). In line with image analysis, flow cytometry confirmed the existence of a small population of tdTomato+ cells within the SVF fraction (Figure S2F, f5). More important, both multilocular adipocytes and SVF cells had FSC/SSC profiles similar to those in previous reports for white adipocytes (Majka et al., 2012, Majka et al., 2014, Gavin et al., 2016). These cells were, however, distinct from the true tdTomato+ white adipocytes identified using our newly defined settings (Figure 1C). Taken together, these results suggest that previous flow cytometry methods used to analyze freshly isolated adipocytes favor the detection of multilocular adipocytes, maturing pre-adipocytes, lipid droplets, and/or cell debris, while unfortunately missing the bulk of intact mature white adipocytes.
Critical Settings for Flow Cytometric Analysis of White Adipocytes
Using AdTomato mice, we identified three components that are critical for adipocyte flow cytometric analysis (Table S1). First, the large size of adipocytes causes a signal saturation on FSC, rendering adipocytes easy to overlook (Figure 2A, first column). This saturation persists independent of nozzle diameter or sheath pressure (Figure S3A). Inserting a neutral density (ND) filter in front of the FSC detector reduces the signal intensity and thereby shifts the dynamic FSC range to the left (Figure S3B). This results in the emergence of a novel FSC-high cell population (Figure 2A, second column), containing the majority of all tdTomato+ events in the white adipocyte sample, and hereafter called Adipocytes.
Figure 2.

Impact of FSC-ND Filter, High FSC Thresholding, and In-Tube Stirring
(A and B) scWAT adipocytes ungated or gated for tdTomato+ (T+) (A), as well as pure mouse lipid samples (B). The same sample was run without an ND filter on FSC (first column), after adding an ND filter (second column), or with an ND filter plus increased FSC threshold (third and fourth columns). A 150-μm nozzle and 6 psi pressure were used throughout.
(C) Ungated mouse scWAT adipocytes run using the Beckman MoFlo XDP cell sorter with the in-tube stirring turned off or on or run using the DB Fusion cell sorter, which has a rotational stirring mechanism. All of the samples were acquired using a low threshold to visualize the lipid droplets. Note the disappearance of the Adipocyte population when stirring is turned off or when only rotational stirring is available.
(D) Images of BODIPY-stained scWAT adipocytes (stained yellow) during sample acquisition with stirring off or on. Stirring leads to increased sample turbidity and mixing of adipocytes with the buffer.
All of the experiments were repeated at least four times. See also Figure S3.
Second, the efficient detection of tdTomato adipocytes using FSC/SSC is hampered by a large degree of debris and free lipids present in the adipocyte sample (Figure 2A, second column). By successively increasing the threshold for FSC detection, it is possible to limit the small events encountered by the machine (Figure S3B), and thereby allow more efficient detection of larger events such as adipocytes (Figure 2A, third to fourth columns). The effect of thresholding can be clearly demonstrated by running pure mouse lipid samples, which become undetectable using an ND filter and high thresholds (Figure 2B). Of note, increasing the threshold too highly hides SVF and brown adipocyte populations because of their smaller cell sizes. To keep these populations, intermediate threshold levels were used for all of the described experiments (Figures S3C and S3D).
Finally, the detection of tdTomato+ adipocytes requires in-tube stirring, such as the SmartSampler system found on the Beckman Coulter MoFlo XDP sorter; with the stirring function turned off, the Adipocyte population is completely undetectable (Figure 2C, first and second columns). Detection of brown adipocytes is also severely hampered by turning off the in-tube stirring, but to a slightly lesser extent than for white adipocytes (Figure S3E, first and second columns). It is important to note that substituting for a rotational mixing of the sample tubes, such as that of the commonly used Becton Dickinson FACS Fusion or FACSAria machines, does not compensate for in-tube stirring because we repeatedly were unable to detect any white tdTomato+ cells and a very low percentage of brown tdTomato+ cells using these machines (Figures 2C and S3E, third columns). No tdTomato+ cells were seen using the Becton Dickinson FACSCanto II machine, which completely lacks a sample mixing function (data not shown). In-tube stirring most likely causes buoyant adipocytes to become mixed into suspension. This is visualized by increased sample turbidity (Figure 2D), allowing the adipocytes to be delivered to the sampler while avoiding the formation of cell aggregates. Turning off in-tube stirring does not hamper the detection of SVF cells or free lipid droplets (Figure S3F; data not shown).
Sorting Freshly Isolated White Adipocytes
To demonstrate that the FSC/SSC Adipocyte gate detects mature adipocytes, PFA-fixed AdTomato adipocytes were sorted onto glycerol-coated imaging slides using only Adipocyte and singlet gating. Subsequent microscopic examination revealed numerous intact white adipocytes that were tdTomato+ (Figure 3A). Approximately 40% of the sorted fixed cells were found intact on the imaging slides, together with remnants of broken cells and free nuclei, suggesting that a fraction of sorted adipocytes break during the sorting process (Figure 3A). Sorting the events located outside the Adipocyte gate resulted only in cellular debris and no intact adipocytes, again confirming that the spiral-forming events are not white adipocytes (Figure 3B). The average size of sorted scWAT and gWAT adipocytes from 11-week-old WT mice was 38 ± 6 μm and 56 ± 8 μm, respectively, similar to the mean diameter of the unsorted adipocyte samples (40 ± 8 μm and 53 ± 10 μm), indicating that there is no discernible bias in adipocyte loss during sorting and that representative adipocyte samples can be sorted (Figure 3C). Similarly, sorting human omental and subcutaneous adipocytes (significantly larger in size) yielded representative sorted cell fractions, although only a small percentage of the fixed human cells were found intact on the imaging slides (Figures 3D, 3E, and S4A).
Figure 3.

Sorting Mature Adipocytes to Validate the FSC/SSC Adipocyte Gate
(A and B) FSC/SSC plots showing the gates used to sort adipocytes (A) and non-adipocytes (B), as well as representative images of the sorted events. Broken cells are marked with asterisks. Hoechst is blue and tdTomato is red. Images in (B) are shown with transmitted light.
(C and D) Measured adipocyte diameters of the same fixed mouse scWAT and gWAT samples (C) or human scWAT and omental WAT (omWAT) samples (D) before sorting and after sorting onto imaging slides. Only intact, nucleated cells were included in the count. All of the differences between pre- and post-sorted samples were non-significant. Lines show means ± SDs.
(E) Confocal stack showing representative image of sorted, intact human omWAT adipocytes. The experiments were repeated three times using mouse adipocytes and two times using human adipocytes.
See also Figure S4.
Based on the acquired flow cytometry data and from testing different sorting cushions, we believe that sorted adipocytes break upon contact with the imaging slide and not during the analysis or sorting itself. This allows for downstream transcriptional and molecular testing of sorted adipocytes, but not for culturing or tests that require intact unfixed cells because in our hands, all sorted unfixed cells broke upon sorting. We therefore sorted unfixed WT mouse adipocytes and SVF cells directly into lysis buffer and performed qPCR on RNA isolated from the lysates to show the applicability of adipocyte FACS for downstream transcript expression analysis. Sorting unfixed adipocytes resulted in the efficient extraction of mRNA from all cellular fractions. Subsequent qPCR analysis showed the expected gene expression profiles for each sample, with the highest Leptin expression detected in gWAT adipocytes and the highest Ucp1 expression detected in BAT adipocytes, and lower levels of both transcripts were found in scWAT adipocytes (Figure S4B). No expression of the leukocyte marker Cd45 was found in any adipocyte cell population, demonstrating that adipocyte FACS yields pure, representative cell populations that are devoid of contamination (Figure S4B).
Throughout this study, we found that SSC, not FSC, seemed to co-vary with cell size for all examined Adipocyte cell populations (see Figures S6A and S7D for a comparison of fat depots). To test whether SSC could be used as a proxy for cell size, allowing sorting of enriched fractions of large or small white adipocytes, we sorted bulk mouse SSC_high (small) adipocytes or SSC_low (large) adipocytes onto imaging slides or into lysis buffer and compared the cell sizes and transcriptional expression patterns to total sorted scWAT cells (Figure 4A). Microscopic examination showed that the SSC_high and SSC_low populations differed significantly in their measured mean cell diameter (Figures 4B and 4C). Expression analysis of the sorted cell fractions revealed an absence of Ucp1 expression and higher Leptin and Thbd expression in the SSC_low (larger) cells, compared to all cells, confirming that size-dependent transcriptional analysis can be achieved by sorting adipocytes based on SSC (Figure 4D). We conclude that our adipocyte flow cytometry method allows for the easy detection of mature white adipocytes as a distinct FSC-high population, which can be used to sort freshly isolated adipocytes for subsequent downstream molecular applications. Further gating for SSC_high or SSC_low adipocytes allows for cell size-dependent sorting, a flow cytometry application that was previously unavailable to the adipocyte field.
Figure 4.

Differential Sorting of Large and Small Adipocytes Using SSC as a Proxy for Adipocyte Size
(A and B) FSC/SSC plots (A) showing the gates used to sort out SSC_high (small) and SSC_low (large) adipocytes from the same sample, as well as representative confocal images (B) of the sorted cells showing the cell outline stained with FITC-lectin (white). Scale bars, 20 μm.
(C) Measured adipocyte diameters of cells sorted from the total scWAT sample (all cells) or sorted using the depicted SSC_high and SSC_low gates. Note that the SSC-based gates efficiently enrich for the occurrence of small or large cells, which are less common in the total sorted sample. Lines show means ± SDs. ∗∗∗∗p < 0.0001.
(D) Relative mRNA expression of Ucp1, Thdb, and Leptin in sorted SSC_high (small), total, or SSC_low (large) adipocyte fractions, compared to Tbp expression. Bars show means ± SDs of technical replicates. The experiment was repeated two times. Bars show mean ± SD.
Staining Mature Adipocytes with Lipophilic Dyes
Neutral lipid dyes such as LipidTOX and BODIPY FL (Thermo Fisher Scientific) fatty acid derivatives have been widely used to identify adipocytes by flow cytometry because they readily stain adipocyte lipid droplets (Figure 5A). We therefore used adipocyte flow cytometry and confocal microscopy to re-examine the staining pattern of these lipophilic dyes and validate their suitability for adipocyte identification. Microscopic analysis showed that in addition to staining lipid droplets, BODIPY FL stains the cell membrane of all SVF cells. Increasing the laser power slightly, LipidTOX was also found to stain a subset of SVF cells (Figure 5A). Adipocyte flow cytometry enabled high-throughput analysis of the staining pattern and replicated the results from image analyses (Figure 5B). Overlaying the flow cytometry plots for stained adipocytes and SVF cells suggests that although adipocytes are more intensely stained, SVF cells can easily be mistaken for mature fat cells if both cell types are not available for comparison (Figure 5C).
Figure 5.

Staining of Mature Adipocytes and SVF Cells with Lipophilic Dyes
(A) Representative images of WT adipocytes and SVF cells stained with Hoechst (H) only, Hoechst and BODIPY FL, or Hoechst and LipidTOX. Images are taken either with standard laser power (1.5%) or using increased laser power (6%). An asterisk denotes the same SVF cells imaged with both settings. Scale bars, 20 μm; note the differences in length.
(B) Flow cytometric analysis of adipocytes, SVF cells, or mouse lipid samples unstained or stained with LipidTOX or BODIPY FL.
(C) Overlay of BODIPY FL- and LipidTOX-stained adipocytes (red) and SVF cells (blue) showing the difference in staining intensity between cell types.
All of the experiments were repeated at least four times.
In addition to using the FSC/SSC Adipocyte gate to distinguish adipocytes from lipid droplets, a DNA dye can be used. However, unlike in other cells, adipocyte nuclei sit adjacent to the large lipid droplet, which obstructs efficient DNA dye penetration. For this reason, the most commonly used nuclear dyes (e.g., Hoechst, DRAQ5) poorly stain adipocyte nuclei compared to SVF nuclei, such that true nuclear staining may be mistaken for flow cytometry background (Figure S5; data not shown). Commonly used lipophilic membrane dyes such as CellVue (Invitrogen) are not a reliable substitute for lipid staining because they stain both free lipid droplets and biological membranes and are thus unable to distinguish between cells and lipid droplets (data not shown). We therefore conclude that caution should be taken when using cellular dyes to stain and analyze adipocytes using flow cytometry. To ensure correct identification of white adipocytes, the Adipocyte gate on FSC/SSC should be used.
Flow Cytometry Enables Sorting of UCP1+ Adipocytes from Mouse WAT and BAT
Several groups have previously described the sorting of intact UCP1+ brown and brite adipocytes from mouse BAT and WAT using UCP1-driven fluorescent reporter mice and various flow cytometric strategies (Rosenwald et al., 2013, Wang et al., 2016). We investigated whether our improved adipocyte flow cytometry approach could be combined with an easily applicable antibody-based protocol that would allow for the quantification and sorting of a pure UCP1+ cell population, without the need for specific reporter strains. Using a fluorescent-conjugated antibody, robust UCP1 staining could be detected in BAT adipocytes isolated from untreated WT mice and WT mice treated with the β3-adrenergic agonist CL 316,243 (Figures 6A, 6B, and S6A), which enhances adipose tissue browning (Himms-Hagen et al., 1994). Few UCP1-expressing cells were detected in scWAT adipocytes isolated from untreated WT mice housed at room temperature, whereas, as expected, adipocyte flow cytometry readily identified the emergence of a population of UCP1-expressing multilocular cells upon CL 316,243 treatment (Himms-Hagen et al., 1994) (Figure 6B, second row). No UCP1 staining was detected in WT gWAT adipocytes (Figure S6B) or adipocytes isolated from any depot of UCP1 knockout (UCP1-KO) mice, with and without CL 316,243 treatment, demonstrating antibody specificity (Figures 6A and 6B, last columns).
Figure 6.

Flow Cytometry Analyses of UCP1 Expression in Mouse White and Brown Adipocytes
(A) Representative images of unsorted BAT adipocytes from untreated or CL 316,243-treated WT or UCP1-KO mice stained with isotype control or anti-UCP1 antibody (red). Intact cells are co-stained with Syto-12 (green). Note the complete lack of UCP1 staining in the knockout sample. Scale bars, 50 μm.
(B) Flow cytometry analysis of BAT (top) and scWAT (bottom) adipocytes from untreated or CL 316,243-treated WT or UCP1-KO mice stained with isotype control or anti-UCP1 antibody.
(C) Representative images of UCP1+ adipocytes (red, SYTO-12 in green) sorted from BAT and scWAT of CL 316,243-treated WT mice. Scale bars, 50 μm. n = 3 mice for each treatment and genotype. See also Figure S6.
UCP1+ adipocytes were subsequently sorted onto imaging slides based on positive antibody and nuclear dye staining. Approximately 75% of the sorted, fixed BAT adipocytes were found intact after sorting (Figures 6C and S6C). This number was higher than it was for white adipocytes, most likely reflecting the smaller size of brown adipocytes and the higher cytoplasmic content, providing improved cell rigidity. Of note, the sorted BAT adipocyte sample lacked the large amount of debris that is commonly found in unsorted BAT samples (Figures S1E and S6C), illustrating a high-throughput way to obtain pure brown fat cell fractions. Sorting UCP1+ adipocytes from scWAT of CL 316,243-treated mice produced highly enriched fractions of multilocular brite adipocytes that were slightly larger in size and more paucilocular compared to sorted BAT cells (Figure 6C). Thus, flow cytometry coupled with immunocytochemistry can be used to enable high-throughput sorting of pure brown or brite adipocyte populations and to detect endogenous adipocyte subpopulations within WAT.
Flow Cytometry of Human Adipocytes Facilitates the Comparison of β2-Adrenergic Receptor Expression between Depots
The variation of adipocyte characteristics, such as cell size, adipokine secretion, and lipolysis, between different fat depots is well characterized (Rosen and Spiegelman, 2014). Differences in adipocyte size, and therefore protein content per cell, can skew experimental data if normalization is undertaken based on total protein content instead of cell number. In addition, existing methods such as western blot or radioactive labeling of isolated membranes only quantify average protein expression in a bulk sample (whether it is normalized per cell or per gram starting tissue), losing all information about cell-to-cell variability within the sample. In contrast, flow cytometry provides information at both population and single-cell levels.
To demonstrate that adipocyte flow cytometry can be applied to human WAT samples and used to quantify differences in protein expression per adipocyte, independent of cell size, we investigated β2-adrenergic receptor (ADRB2) expression in isolated mature adipocytes from human abdominal subcutaneous and omental fat biopsies. ADRB2 is the most important human adrenoreceptor regulating adipocyte lipolysis (Arner, 1995, Lafontan and Langin, 2009). It is highly expressed by both omental and subcutaneous adipocytes, although quantifications of inter-depot differences in ADRB2 expression have yielded inconsistent results (Hellmér et al., 1992, Lönnqvist et al., 1992, Reynisdottir et al., 1994, Hoffstedt et al., 1997, McConnaughey et al., 2004, Kurylowicz et al., 2015). Using adipocyte flow cytometry and immunostaining against ADRB2, we analyzed nine paired human omental and subcutaneous adipocyte samples using an anti-ADRB2 antibody conjugated to allophycocyanin (APC) (Figures S7A–S7D). No significant differences in ADRB2 expression were found between the two depots, both in terms of the percentage of stained cells and the staining intensity (Figures 7A and 7B). However, the number of ADRB2-expressing adipocytes in both depots varied depending on patient metabolic health and serum insulin (S-insulin) levels. While the level of ADRB2 expression per cell remained constant for all patients, the percentage of adipocytes that were positive for ADRB2 decreased from almost 100% to <50% as fasting insulin levels increased (Figures 7A, 7C, and S7B). Healthy obese patients, identified based on having a homeostatic model assessment-insulin resistance (HOMA-IR) index <2.5, had a significantly higher percentage of ADRB2+ cells compared to unhealthy obese patients (Figure 7D). These results were validated using confocal microscopy, which demonstrated a heterogeneous immunostaining pattern, especially in samples from unhealthy obese patients (Figure 7E). In conclusion, adipocyte flow cytometry provides a rapid, high-throughput platform for the phenotypic characterization of single adipocytes, allowing for the determination of protein expression per adipocyte and avoiding the need to normalize for size-dependent factors such as total protein or lipid content.
Figure 7.

Flow Cytometry Analyses of ADRB2 Expression in Human Adipocytes
(A) Flow cytometric analysis of paired human omWAT and scWAT adipocyte samples unstained or stained with anti-ADRB2 antibody conjugated to APC. Samples are arranged from left to right in order of increasing patient HOMA-IR index.
(B) Analysis of the percentage of ADRB2+ cells in paired scWAT and omWAT adipocyte samples.
(C) Correlation of the percentage of scWAT ADRB2+ cells with patient fasting S-insulin levels.
(D) Comparison of the percentage of scWAT adipocytes expressing ADRB2 between metabolically healthy (HOMA-IR index <2.5) and metabolically unhealthy obese patients. Lines shows means ± SDs. ∗∗∗∗p < 0.0001. See also Figure S7.
(E) Human adipocytes unstained or stained with anti-ADRB2 antibody conjugated to APC (red; Hoechst in blue). Scale bars, 50 μm.
n = 9 patients.
Discussion
Most analyses today are performed on cultured adipocyte-like cell lines or differentiated pre-adipocytes (Wang et al., 2014), cells that in many respects do not mimic freshly isolated primary adipocytes. As such, there is a need to develop technologies to support working with freshly isolated fat cells. We describe a flow cytometry method to study freshly isolated white and brown adipocytes from mouse and human adipose tissue. This method is validated using an adipocyte-specific inducible Adiponectin-Cre/ERt-driven reporter mouse (Jeffery et al., 2014), with sorted populations confirmed by confocal microscopy. Adipocyte flow cytometry has the advantage of offering fast, high-throughput analyses of a large number of events, while providing approximate data on cell size and granularity. Performing a large-scale single-cell analysis of mature adipocytes, a notoriously difficult cell type to study, enables a multitude of previously unavailable downstream research applications.
Previous studies have suggested that adipocytes form either a spiral-like or an SSC_high population on FSC/SSC and have validated their finding using the lipid dye LipidTOX and expression of the general adipocyte markers Adipoq and Plin1 (Crossno et al., 2006, Majka et al., 2010, Majka et al., 2012, Majka et al., 2014, Chau et al., 2014, Gavin et al., 2016, Tang et al., 2016, Boumelhem et al., 2017). We report the spiral-like population to be tdTomato− and Hoechst−, and therefore devoid of adipocytes. This population most likely reflects free lipid droplets and lipid micelles, which is in line with a previous report that studied oil-in-water emulsions by flow cytometry (Fattaccioli et al., 2009). Moreover, we found only multilocular brown adipocytes to have high SSC, while white tdTomato+ adipocytes were undetectable using current protocols (Figures 1B and 1C). We speculate that some previous studies detected and analyzed multilocular adipocytes instead of white adipocytes, especially given a report showing extensive WAT browning in mouse WAT depots (Crossno et al., 2006). In addition, both adipocyte markers used previously to define white adipocytes, Adipoq and Plin1, are expressed by brown adipocytes: Plin1 codes for a lipid droplet protein found in most lipid-containing cells, and Adiponectin is clearly expressed by multilocular fat cells and a subset of SVF cells, as demonstrated using the AdTomato mice. As such, care needs to be taken when using SSC, Adipoq, or Plin1 as definitive markers for mature white adipocytes.
The experiments detailed here were performed using a MoFlo XDP FACS instrument equipped with the SmartSampler system, which is capable of acquiring and sorting buoyant adipocytes. Many flow cytometry and FACS machines on the market lack one or more of the required flow cytometry components listed in Table S1, potentially explaining why adipocyte flow cytometry has previously been considered difficult to perform. We determined that the most essential component for the analysis and sorting of adipocytes is the in-tube stirring system. Our striking result, showing that no adipocytes were acquired by the flow cytometer when the stirring function is turned off or by the use of the rotational stirring found in many commonly used FACS machines (Figure 2C), highlights the need for new technical solutions that could facilitate adipocyte sampling in all FACS machines without this inbuilt function.
In addition to specific equipment requirements, previous attempts to analyze adipocytes using flow cytometry have been impaired by relying on the use of neutral lipid dyes as a marker for adipocytes (Majka et al., 2010, Majka et al., 2012, Majka et al., 2014, Chau et al., 2014, Katz et al., 2014, Gavin et al., 2016, Tang et al., 2016, Boumelhem et al., 2017). As well as staining free lipid droplets, we report that both SVF cells and adipocytes stain positive with LipidTOX and BODIPY FL, most likely the result of binding of the lipophilic dyes to cellular membranes (Figure 4). Although adipocytes stain more intensely than SVF cells, the small difference in staining intensity between the cell types makes it impossible to determine whether a cell population is composed of adipocytes or non-adipocytes based on lipid dyes only (Figure 5C). We show that the Adipocyte gate on FSC/SSC contains the majority of mature white adipocytes (Figure 2) and can be used to identify and sort white adipocytes, avoiding the need for a lipid dye (Figure 3). We further show that SSC can be used to sort large and small adipocytes from the same sample. This is most likely due to the combination of intracellular complexity decreasing with increasing cell and lipid droplet size and of quenching of the SSC signal by the large dense lipid core. Conducting high-throughput, single-cell analyses of adipocytes based on cell size will significantly facilitate studies examining fat cell hypertrophy and heterogeneity.
We illustrate the ability to use flow cytometry to define subpopulations of adipocytes within fat depots and for comparing adipocyte populations across fat depots and individuals. UCP1+ adipocytes, while largely absent in WAT depots of adult lean mice housed at room temperature, constitute ∼18% of adipocytes in the scWAT after treatment with the β3-adrenergic agonist CL 316,243 for 5 days (Figure 6B). Studies aimed at investigating the potency of various treatments in promoting WAT browning would benefit greatly from improved methods that allow for the precise and high-throughput quantification of UCP1+ cells. The applicability of adipocyte flow cytometry is additionally shown by examining adipocyte expression of the lipolytic mediator ADRB2 in a cohort of obese patients. We show that ADRB2 expression per cell does not significantly differ between human fat depots, but rather the number of fat cells expressing ADBR2 in human WAT decreases with increasing hyperinsulinemia and metabolic dysfunction. Conventional methods used to determine receptor levels, such as western blot, are not able to distinguish between a general downregulation of ADRB2 in all adipocytes and a subset of adipocytes completely downregulating the receptor. Indeed, a previous study using radiolabeling reported 50% lower ADRB2 expression in adipocytes isolated from insulin-resistant men compared to insulin-sensitive men (Reynisdottir et al., 1994). The authors, however, were unable to establish whether the receptor downregulation was a general response across all adipocytes or whether there was a heterogeneic response across adipocytes. Several well-described, commonly found ADRB2 haplotypes that result in altered ADRB2 receptor expression have been linked to lipolytic dysfunction and insulin resistance in women (Drysdale et al., 2000, Eriksson et al., 2004, Dahlman and Arner, 2010, Prior et al., 2011). Moreover, lipolytic dysfunction has been connected to obesity and impaired glucose metabolism (Langin et al., 2005, Arner et al., 2018). Further flow cytometric studies that allow for the investigation of ADRB2 expression at a single-cell level and at a population level need to be performed to determine the impact of these results and how they relate to patient haplotypes, insulin sensitivity, lipolysis, and obesity.
Our study presents key technological insights for analyzing mouse and human adipocytes using flow cytometry and demonstrates that the method can be applied to study UCP1 and adrenergic receptor expression in mouse and human adipose tissue. Adipocyte flow cytometry will greatly facilitate a better understanding of the molecular and cell biologies of adipocytes, thus helping to improve our understanding of the mechanisms that regulate obesity and metabolic disease.
STAR★Methods
Key Resources Table
| REAGENT or RESOURCE | SOURCE | IDENTIFIER |
|---|---|---|
| Antibodies | ||
| Mouse monoclonal anti-UCP1 antibody | R&D Systems | Cat#MAB6158; RRID: AB_10572490 |
| Mouse IgG2B Alexa Fluor 647-conjugated Isotype Control antibody | R&D systems | Cat#IC0041R; RRID: AB_2737095 |
| Rabbit polyclonal anti-ADRB2 antibody conjugated to APC | LSBio | Cat#LS-C274967; RRID: AB_2737096 |
| Mouse monoclonal anti-ADRB2 antibody conjugated to Alexa647 | Santa Cruz | Cat#SC-81577; RRID: AB_1119478 |
| Mouse monoclonal anti-Actin antibody | Sigma-Aldrich | Cat#A5441; RRID: AB_476744 |
| Chemicals, Peptides, and Recombinant Proteins | ||
| CL 316,243 | Sigma-Aldrich | C5976; CAS:138908-40-4 |
| Specific synthetic blocking peptide toward anti-ADRB2 antibody LS-C274967 | LSBio | Cat#LS-E8815 |
| Critical Commercial Assays | ||
| Alexa Fluor 647 antibody labeling kit | ThermoFisher | A20186 |
| Experimental Models: Organisms/Strains | ||
| Mouse: Adipoq-CreERt: B6.129-Tg(Adipoq-cre/Esr1∗)1Evdr/J | Jeffery et al., 2014 | RRID: IMSR_JAX:024671 |
| Mouse: Ai14 tdTomato: B6.Cg-Gt(ROSA)26Sortm14(CAG-tdTomato)Hze | The Jackson Laboratory | RRID: IMSR_JAX:007914 |
| Mouse: UCP1-KO: B6.129-Ucp1tm1Kz/J | Enerbäck et al., 1997 | RRID: IMSR_JAX:003124 |
| Oligonucleotides | ||
| Tbp (Mm00446971_m1) | ThermoFisher | Cat#4331182 |
| Cd45 (Mm01293577_m1) | ThermoFisher | Cat#4331182 |
| Ucp1 (Mm01244861_m1) | ThermoFisher | Cat#4331182 |
| Thbd (Mm00437014_s1) | ThermoFisher | Cat#4331182 |
| Leptin (Mm00434759_m1) | ThermoFisher | Cat#4331182 |
| Software and Algorithms | ||
| FlowJo flow cytometry analysis platform | FlowJo, LLC | https://www.flowjo.com |
| GraphPad Prism 6 | GraphPad Software | https://www.graphpad.com/scientific-software/prism/ |
Contact for Reagent and Resources Sharing
Further information and requests for resources and reagents should be directed to and will be fulfilled by the Lead Contact, Kirsty L. Spalding (Kirsty.Spalding@ki.se).
Experimental Model and Subject Details
Animals
All animal experimental protocols were reviewed and approved by the Norra Swedish Animal Welfare and Ethical Review Boards at Karolinska Institutet or University of Stockholm, Stockholm, Sweden. Adiponectin-Cre/ERt mice with a C57BL/6J background were a generous gift from Professors Evan Rosen and Lazaros Foukas. The founder line can be purchased from Jackson Laboratories, stock no. 024671. Ai14 tdTomato reporter mice were purchased from Jackson Laboratory (stock no. 007914) and bred with Adiponectin-Cre/ERt mice at the animal facility at Karolinska Institutet. All mice were maintained on a 12-h light/dark cycle at 21°C and were housed in groups of two to five with food and water ab libitum. Male and female adult (age 18 ± 4 weeks old) tamoxifen (TMX) treated Adipoq-Cre+;tdTomato+/+ mice were used as experimental animals (termed AdTomato throughout the paper) and Cre-;tdTomato+/+ or wild-type C57BL/6J mice were used as wild-type (WT) controls. Both Adipoq-Cre+;tdTomato+/+ and Cre-;tdTomato+/+ mice were given TMX-solution (20 mg/ml dissolved in peanut oil) via oral gavage at the dose of 80 mg/kg body weight/day for 5 consecutive days. After the last gavage the mice were left to rest for at least 7 days before sacrifice by cervical dislocation.
Male UCP1-KO mice (progeny of those described (Enerbäck et al., 1997) and backcrossed for more than 10 generations to C57BL/6J mice) and wild-type C57BL/6J mice were used to study brown and brite/beige adipocytes. Mice were housed at room temperature (RT) in conventional cages with a 12 h light/dark cycle and had ad libitum access to chow diet and water. Age-matched 15-17-week old WT and UCP1-KO mice received 1 mg/kg body weight /day of the beta-agonist CL 316,243 (Himms-Hagen et al., 1994) (Sigma) dissolved in PBS. Control mice received corresponding amount (90-100 μl) of PBS (vehicle). CL 316,243 or vehicle was administered i.p. for 5 consecutive days and animals were sacrificed on day 6 by decapitation.
Human subjects
Surgical biopsies from omWAT and scWAT were obtained from 9 obese patients (BMI 38.4 ± 5.3 kg/m2, 1 male and 8 females, median age 40 ± 13 years) undergoing bariatric surgery at Ersta Hospital in Stockholm, Sweden. None of the patients were on medication targeting adrenergic signaling. Patients were fasted overnight and blood glucose, serum insulin, triglycerides and high density lipoprotein cholesterol (HDL-C) levels were measured the morning of surgery and analyzed at Karolinska Universitetslaboratoriet. Body fat percentage was measured prior to surgery using a BC-418 Segmental Composition analyzer (Tanita). Omental adipose tissue was dissected from the greater omentum and subcutaneous tissue was dissected from the epigastric region of the abdomen. Glucose and insulin values were used to calculate the insulin sensitivity index Homeostasis Model of Assessment-Insulin Resistance (HOMA-IR). HOMA-IR ≥ 2.5 was used as a cut-off for insulin resistance and metabolic unhealthy, as this has been suggested in large population-based studies (Kuk and Ardern, 2009). All experiments were performed in accordance with the Helsinki declaration. The study was approved by the Regional ethics committee in Stockholm (2014/1115-31/2) and written informed consent for participation in the study was obtained from all participants.
Method Details
Isolation of mouse WAT adipocytes and SVF cells
Subcutaneous (scWAT) and visceral gonadal (gWAT) white fat pads were dissected and processed for cell isolation. Mouse adipocytes were isolated as described (Kir et al., 2014) with minor modifications. Briefly, mouse WAT fat pads were dissected and minced carefully with scissors for 2-5 min until no obvious tissue pieces were visible. The minced tissue was digested in a 37°C shaking water bath at 170 rpm with 10 mL Phosphate Buffer Saline (PBS) containing 1% bovine serum albumin (BSA), 400 nM adenosine, 50 μg/ml gentamicin, 2.5 mg/ml Dispase II and 10 mM CaCl2 together with Collagenase D (Roche): minced scWAT was digested 12-20 min using 4 mg/ml Collagenase D and minced gWAT was digested 8-12 min using 2.5 mg/ml collagenase D. Collagenase digestion was followed by filtration through a 300 μm nylon mesh strainer (PluriSelect), where after adipocytes were washed 3 times by free floating using a total of 40 mL Wash buffer (1% BSA, 400 nM adenosine, 50 μg/ml gentamicin in PBS, pH 7.4) at RT. For each round of washing cells were allowed to float for > 5 minutes and the infranatant removed with a syringe and needle. The first infranatant is saved and further processed for SVF cell isolation (see below). After removing the last round of Wash buffer, isolated adipocytes were filtered using a 100 or 300 μm nylon mesh strainer depending on sample and left in Dulbecco’s PBS (DPBS) for further staining. Centrifugation of primary adipocytes was avoided, as in our hands this leads to increased cell breakage and sample debris. When fixing was required, adipocytes were fixed with Fixative buffer (2% PFA and 1% Sucrose in DPBS) for 30 min under gentle agitation. Cells were subsequently washed with Wash buffer.
Mouse SVF cells were isolated from the first scWAT infranatant by centrifugation at 400 g for 10 min. Pelleted SVFs were re-suspended in 5 mL of Erythrocyte lysis buffer (0.155 M NH4Cl, 5.7 mM K2HPO4, 0.1 mM EDTA, pH 7.3), incubated for 10 min and centrifuged again as above. After discarding the supernatant, the SVF pellet was washed with 25 mL of Wash buffer, filtered through a 70 μm nylon filter mesh, pelleted again by centrifugation as above and finally re-suspended in 0,5- 1 mL DPBS.
Isolation of mouse BAT adipocytes
BAT from the interscapular, dorsal cervical and axillary BAT regions was dissected and processed for cell isolation using a slower and slightly harsher protocol than above. Briefly, mouse BAT was minced carefully with scissors for 2-3 min and digested for 60 min in a 37°C shaking water bath at 190 rpm, with 10 mL BAT digestion buffer containing 3.5 mg/ml Dispase II, 10 mM CaCl2 and 1 mg/ml Collagenase II (GIBCO, note the different Collagenase) in PBS. At the end of the digestion, 2 mM EDTA was added to stop the digestion, and the cells were filtered through a 300 μm strainer (PluriSelect) together with 10 mL 3% BSA in PBS. The cells allowed to float to the top for 1-2 h. Floating cells were transferred to a 5 mL Eppendorf tube using wide pipet tips, and if required, fixed for 30 min under gentle rocking with Fixative buffer. Cells were subsequently filtered through a 70 μm cell strainer and washed with 3-5 mL 3% BSA in PBS. After the cells have floated to the top for 1 h they were collected and used for downstream applications. WAT adipocytes isolated for UCP1 staining were digested using the WAT protocol, but washed and floated using the above BAT protocol.
Isolation of human adipocytes
After collection WAT biopsies fat cells were isolated from the biopsies using the Rodbell method (Rodbell, 1964). In brief, adipose tissue pieces were washed and minced carefully, followed by digestion in Krebs-Ringer-phosphate buffer (127 mM NaCl, 12.3 mM NaPO4, 1.36 mM CaCl2, 5.07 mM KCl, 1.27 MgSO4, pH 7.4) containing 0.05% collagenase I from Clostridium histolyticum (#C0130, Sigma), 5 mM D-glucose, 50 μg/ml gentamicin and 4% albumin in a 37°C shaking water bath for 45-60 min. Any remaining undigested tissue was removed by filtration using a 250 μm nylon filter. The floating adipocytes were washed three times with wash buffer containing 1% BSA, 5mM D-glucose and 50 μg/ml gentamicin in DPBS, pH 7.4. After removing the last round of Wash buffer, isolated adipocytes were fixed with Fixative buffer (2% PFA and 1% sucrose in DPBS) for 15 min under gentle agitation, washed with wash buffer and left in DPBS for further staining.
Microscopic examination of adipocytes and SVF cells
Isolated adipocytes or SVF cells were fixed with Fixative buffer for 15 min under gentle agitation, washed with DPBS and stained for 30 min at RT with different combinations of the following dyes: FITC- labeled Lens culinaris agglutinin (LCA) lectin (1:500 dilution, FL-1041, Vector Laboratories), Hoechst 33342 (1:500 dilution, Molecular Probes), SYTO-12 (1:500 dilution, ThermoFisher), BODIPY FL C12 (1:1000 dilution, D-3822, Molecular Probes), or LipidTOX Green neutral lipid stain (1:200 dilution, #H34475, Molecular Probes). After removing the staining solution with a needle and syringe, the stained adipocytes were washed with DPBS, mixed with 80% glycerol and pipetted onto a glass slide fitted with a 200 μm thick cell frame (iSpacer, SunJin Lab) to keep the adipocytes from becoming flattened. Cell frames were covered with a 1.5 cover glass and sealed with nail polish. Stained SVF cells were pelleted by centrifugation at 400 g for 10 min at 4°C, re-suspended in hardening mounting medium (DAKO), applied onto a glass slide with a coverslip on top and sealed with nail polish.
All cell images were taken using an inverted confocal Zeiss LSM 700 or LSM 880 confocal laser scanning microscope using the ZEN software (Carl Zeiss, Germany) to construct maximal projections and filtering noise. The same settings were used for all images within an experiment. Image size and pixel content was subsequently modified using Adobe Photoshop. The percentage of tdTomato+ positive cells was determined by manually counting > 500 nucleated Hoechst+ scWAT or gWAT adipocytes or > 100 nucleated Hoechst+ BAT adipocytes or SVF cells from each of three Adipoq-Cre+;tdTomato+/+ animals.
Preparation of flow cytometry samples
All flow cytometry samples were prepared in round bottom polypropylene FACS tubes (Falcon). For each adipocyte sample, 100 μL of packed adipocytes or 200 μL of SVF cell solution was added to 400 μL of DPBS containing the appropriate staining dyes, as this relationship was found to be optimal for sample acquisition and analysis. For flow cytometry lipid samples 10 μL of either mouse lipid (see below) or pure Sunflower Seed oil from Helianthus annuus (Sigma) was added to 500 μL DPBS followed by vigorous vortexing. Prior to sample acquisition, lipid samples were mixed thoroughly by “racking” in order to induce the formation of lipid micelles/tiny droplets.
Mouse lipid was collected following homogenizing of whole mouse WAT in DPBS containing 1% Triton X-100 using a VDI 12 homogenizer (VWR), vigorous mixing of the sample for 1 h, filtration through a 100 μm nylon mesh filter and centrifugation at 2000 g for 10 minutes at RT. The absence of both free nuclei and intact cells in the lipid sample was confirmed by staining lipid samples with the DNA dye Hoechst and the membrane-specific dye CellMask Deep Red Plasma Membrane stain (1:1000 dilution, C10046, Molecular probes) and analyzing by flow cytometry (data not shown). Identical results were obtained in all experiments where mouse lipid and pure Sunflower Seed oil was used, again assuring that the mouse lipid samples did not contain cell fragments.
The following dyes were used throughout the study: Hoechst 33342 (1:500, Molecular Probes), BODIPY FL C12 (1:500, D-3822, Molecular Probes) and LipidTOX Green neutral lipid stain (#H34475, 1:200, Molecular Probes). All stainings were performed on unfixed cells unless otherwise stated. Prolonged exposure of unfixed adipocytes to lipid dyes, especially if the adipocyte samples are of suboptimal quality or were isolated from old mice, resulted in partial adipocyte breakage, something that could be counteracted by fixation prior to lipid dye staining.
MoFlo XDP settings and flow cytometry data acquisition
All flow cytometry samples, unless otherwise indicated, were analyzed using a MoFlo XDP cell sorter together with the Summit 5.4 software (Beckman Coulter), equipped with 100 mW 355 nm (JDSU, San Jose, CA), 200 mW 488 nm (Coherent, Santa Clara, CA), 80 mW 532 nm (Cobolt AB, Sweden) and 60 mW 640 nm lasers (Coherent, Santa Clara, CA). Throughout the study a 150 μm nozzle was used with a sheath pressure of 6 psi, with sheath fluid consisting of Isoflow (Beckman Coulter, Fullerton, CA). The exception is those experiments where the influence of nozzle size and sheath fluid was explicitly tested by running the same adipocyte sample with either the 150 μm nozzle using 30 psi or the 100 μm nozzle using 30 psi. Adipocyte samples and collection tubes were best maintained and analyzed at RT throughout all experiments, as adipocyte lipids stiffen at lower temperatures leading to an increase in cell breakage (data not shown). To keep cells in suspension a MoFlo SmartSampler sample station with in-tubing sample agitation cycles of 3 s on and 2 s off was used. Doublets were discriminated using standard SSC-Height versus SSC-Area plots.
To detect white adipocytes a 2.0 ND filter on FSC was used, unless otherwise stated. Threshold levels depend on machine setup and stability and varied slightly from day to day. Changing the threshold does not shift the placement of a population, it only hides or unmasks smaller events. In general, a FSC threshold of 0.01 was used as low and thereafter the threshold gradually increased, depending on the sample type and experiment. Typical optimal threshold levels were 0.9 for white adipocytes, 0.4 for brown adipocytes and 0.15 for SVF cells, and 0.15-0.4 was used for most application experiments. For data acquisition from tdTomato we used 532 nm excitation and a 580/23 nm bandpass emission filter (BP). Fluorescence of LipidTOX Green and BODIPY-FL Green was excited by the 488 nm laser and collected using a 529/28 nm BP with a 1.0 ND filter in front of the dedicated detector. The 355 nm laser was used to excite Hoechst 33342 and the signal was detected with a 457/50 nm BP. Alexa647 and APC were excited by the red 640 nm laser and detected by a 670/30 nm BP.
In total, approximately 30 mice were used for the study. For each separate experiment 2-4 mice were typically used, with all experiments repeated at least 4 times. When comparing flow cytometry settings, the same sample tubes were run for all settings tested in parallel. Similar numbers of events were recorded for all settings within one experiment, typically ranging between 10k-15k for each adipocyte, SVF and lipid sample and 30k for each BAT sample due to the presence of debris. When stirring was turned off the data was acquired for the exact same time it took to collect 10k events with stirring on. Similar data acquisition times were used for SVF, BAT and lipid samples when using the highest threshold settings, with no or very few events recorded. All data analysis was done based on Area values using the FlowJo 10.2 flow cytometry analysis platform and representative graphs from three or more repeated experiments are shown. Positive gates were set separately for each sample type and dye and set to include less than 1% of the acquired events in the unstained sample.
Fusion settings and data acquisition
To compare the MoFlo XDP to other commonly used sorters on the market, adipocyte and SVF cell samples isolated from WT and AdTomato mice were also analyzed using the BD FACSAria Fusion cell sorter equipped with a 100 μm nozzle, a 1.5 ND filter on FSC and run with a sheath pressure of 20 psi and rotational stirring maintained at 300 rpm. TdTomato expression was analyzed using a 561 nm laser and a 582/15 bandpass filter. Temperature control was disabled to maintain samples at RT. Samples were run using low thresholds on FSC as no difference in the number of tdTomato-positive event were seen by increasing the threshold.
Sorting mature adipocytes
For sorting, standard glass microscopy slides or eppendorf tubes of different sizes were used depending on the experiment and downstream application. For microscopic analysis samples were sorted onto a 5 μL cushion consisting of Vectashield mounting medium with DAPI (Vector Labs) or 90% glycerol. Typical sort settings include 15,120 Hz of drop drive frequency, amplitude of 51 V, deflection plate voltage of 3200 V, 25% R1/L1 side stream deflection charge and 45% R2/L2 side stream deflection charge. Sorting efficiency varies depending on target population, for a typical sort in Purify mode, drop envelope 1 efficiency varies from 20% to 80%. For microscopic analysis and counting of intact cells we used single cell sorting mode with a 0.5-1 drop envelope, for bulk sort for transcriptional analysis we used Enrich mode with a drop envelope of 1-2. For drop charge delay determination we have found that Flow-Check Fluorospheres (Beckman Coulter) are not optimal in combination with the 150 μm nozzle, instead we prefer to use 20,5 μm SPHERO Yellow beads (Specherotech Cat. No. FP-20052-5). Typical drop delay values were around 21 μs.
Sorting gates were set as depicted in the manuscript. To quantify the number of sorted intact adipocytes, 100 events were sorted onto each of five imaging slides and the number of intact, nucleated adipocytes were counted manually by confocal microscopy. This experiment was repeated three separate times for both mouse scWAT and BAT adipocytes as well as two times for human adipocytes. To size unsorted and sorted cells, Hoechst- and FITC-Lectin stained adipocytes were used and imaging slides of an aliquot of the unsorted sample was made prior to flow cytometry. 500-1000 adipocytes were subsequently sorted onto imaging slides and all intact, nucleated cells were imaged at their largest (widest) equatorial plane using a LSM 700 confocal microscope and the diameter determined using ImageJ Fiji software.
Transcriptional analysis of sorted adipocytes
Unfixed, Hoechst-stained freshly isolated (all, SSC_high or SSC_low) scWAT, gWAT and BAT adipocytes and scWAT SVF cells from 11 week old WT mice were sorted, based on gating for adipocytes, singlets and Hoechst-staining, into 250 μL RLT lysis buffer (QIAGEN) at 100k cells/tube. Samples were further lysed in 1ml TRIzol reagent (ThermoFisher Scientific) and the aqueous phase was extracted using PhaseMaker tubes (Invitrogen) and chloroform. RNA was subsequently precipitated by adding 1 volume of 75% EtOH and isolated using the RNeasy MinElute Spin Columns (RNeasy Micro Kit, QIAGEN) according to manufacturer’s instructions. The QuantiTect Reverse Transcription Kit (QIAGEN) was used for reverse transcription according to manufacturer’s protocol. Transcription levels were analyzed using TaqMan Fast Universal PCR Master Mix (without AmpErase UNG) and 2 ng cDNA per well in a CFX384 Touch Real-Time PCR Detection System (BioRad) and the following commercial mouse TaqMan probes (ThermoFisher): Tata binding protein (Tbp, Mm00446971_m1), Cd45 (Mm01293577_m1), Ucp1 (Mm01244861_m1), Thrombomodulin (Thbd, Mm00437014_s1) and Leptin (Mm00434759_m1).
Immunocytochemistry of isolated white and brown mouse adipocytes
50-80 μL fixed brown adipocytes or 80-150 μL fixed white mouse adipocytes were used for each sample. Cells were blocked overnight with 250 μL blocking buffer (3% normal donkey serum, 2% BSA, 0.1% Triton X-100 for WAT or 0.25% Triton X-100 for BAT in DPBS) under gentle agitation. The human/mouse Anti-UCP1 antibody (MAB6158, monoclonal Mouse IgG2B Clone # 536435, R&D Systems) was conjugated to Alexa647 (ThermoFisher Alexa Fluor 647 antibody labeling kit A20186) and incubated with adipocytes at 1:300 for 1 h. Mouse IgG2B Alexa Fluor 647-conjugated Isotype Control antibody (R&D systems) was used as a control. Staining solution was removed and cells washed twice for 10 min with 500 μL wash buffer (3% BSA and 0.1% Triton X-100 in DPBS) under gentle agitation, leaving the adipocytes at least 30 min to float to the top between washes. Adipocytes were subsequently stained for microscopy with Hoechst 33342 at 1:500 to visualize nuclei or with SYTO-12 (ThermoFisher) at 1:500 that stains both the nuclei and cytoplasm of intact adipocytes.
Immunocytochemistry of isolated human scWAT and omWAT adipocytes
Isolated human adipocytes were stained immediately after isolation and analyzed the following day. 300-500 μL fixed human scWAT and omWAT adipocytes were used for each sample. Cells were blocked 30 min with 500 μL blocking buffer (10% normal donkey serum, 0.01% Tween-20 in DPBS) under gentle agitation. The anti-human ADRB2 Ser364 antibody (polyclonal Rabbit IgG antibody made toward a synthetic peptide between 345 and 373 amino acids of human ADRB2 and conjugated to APC, cat. no. LS-C274967, lot 1102018, LSBio) or the anti-human ADRB2 clone R11E1 antibody (mouse monoclonal IgG antibody raised against the purified, intact human ADRB2 protein and conjugated to Alexa647, cat.no. SC-81577, Santa Cruz) was incubated with adipocytes at a 1:100 dilution overnight in blocking buffer. No antibody was used as an unstained control. Staining solution was removed and cells washed twice for 10 min with 500 μL wash buffer (1% BSA and 0.01% Tween-20 in DPBS) under gentle agitation before filtering the adipocytes through a 300 μm nylon mesh strainer (PluriSelect) and subjecting them to analysis by flow cytometry and microscopic analysis, as described above. To prove antibody specificity the LS-C274967 antibody was in one experiment pre-incubated 1 h at RT with a 5x excess (in weight) of specific blocking peptide (synthetic peptide between 345 and 373 amino acids of human ADRB2, LS-E8815, LSBio) and then used to stain adipocytes as described.
Western blot
Approximately 0.5 mL frozen human omental adipocytes were lyzed in 500 μL RIPA buffer including Complete protease inhibitors (Roche). The samples were snap frozen and thawed rapidly at 90°C twice and spun at 10,000 g x 5 min at 4°C. The clarified lysate was removed from lipid and pellet, and spun again at 10,000 g x 5 min at 4°C to remove all remaining carryover lipid. Proteins were separated on 4%–12% Bis-Tris NuPAGE gels (Invitrogen) and transferred to PVDF membranes. ADRB2 protein was detected using the same human Anti-ADRB2 Ser364 antibody as for immunocytochemistry (conjugated to APC, polyclonal Rabbit IgG, cat. no. LS-C274967, lot 1102018, LSBio) and Actin was detected as loading control (monoclonal Mouse IgG1 clone AC-15, cat.no. A5441, Sigma) together with secondary antibodies from Dako (Anti-Rabbit, P0448 and anti-mouse P0447).
Quantification and Statistical Analysis
Unpaired t test with Welch’s correction or non-parametric Mann Whitney U-test (for samples with unequal distribution) was used to calculate the difference between groups in cell size (Figure 3 and 4) or percentage of ADRB2 expression (Figure 7), statistical detail can be found in the respective figure legends. Significance was defined as p < 0.05. For the analysis of human ADRB2 expression, two type-1 diabetic patients were excluded due to unavailability of serum insulin levels, preventing calculation of their HOMA-IR index. Final sample number (n = 9) depended on availability of human adipose tissue. All statistical calculations and linear regression analysis were performed using GraphPad Prism 6.
Data and Software Availability
The FCS files generated and analyzed during the current study are available from the corresponding authors upon request.
Acknowledgments
We would like to thank Professors Evan Rosen and Lazaros Foukas for the kind gift of the Adiponectin-Cre/ERt mice. We also thank Lena Appelsved for technical assistance in isolating human adipocytes. This study was supported by grants from the European Research Council (Starting Investigator Grant No. 261258 to K.L.S.), the Swedish Research Council, the Novo Nordisk Foundation, the Karolinska Institutet, the Karolinska Institutet/AstraZeneca Integrated Cardio Metabolic Centre (KI-AZ ICMC), the Vallee Foundation, and the Diabetes Research Program at Karolinska Institutet. C.E.H. was supported by the Swedish Society for Medical Research, Wilhelm och Else Stockmanns Stiftelse, and the Swedish Research Council. A.T. was supported by The Erling-Persson Family Foundation.
Author Contributions
C.E.H. designed and performed all of the flow cytometry experiments, interpreted the data, and wrote the manuscript. Q.L. characterized the mouse model, set up the flow cytometry method, and performed the image analysis. M.K. performed the mice experiments, the cell isolation experiments, and the immunocytochemistry (ICC) and immunohistochemistry (IHC) staining. D.B. ran and optimized the flow cytometry and interpreted the data. E.K. developed the flow cytometry protocol. I.G.S. and J.N. performed and directed the UCP1-KO mice experiments. M.J.H. and J.B. performed the antibody validation. O.S. performed the mice and cell isolation experiments. V.K. developed the UCP1 staining protocol. A.T. was responsible for the recruitment of human subjects, as well as the sampling of blood and adipose tissue. K.L.S. led the study, interpreted the data, and contributed to the manuscript. All of the authors commented on the manuscript.
Declaration of Interests
The authors declare no competing interests.
Published: September 4, 2018
Footnotes
Supplemental Information includes seven figures and one table and can be found with this article online at https://doi.org/10.1016/j.celrep.2018.08.006.
Contributor Information
Carolina E. Hagberg, Email: carolina.hagberg@ki.se.
Kirsty L. Spalding, Email: kirsty.spalding@ki.se.
Supplemental Information
References
- Arner P. Differences in lipolysis between human subcutaneous and omental adipose tissues. Ann. Med. 1995;27:435–438. doi: 10.3109/07853899709002451. [DOI] [PubMed] [Google Scholar]
- Arner P., Andersson D.P., Bäckdahl J., Dahlman I., Rydén M. Weight gain and impaired glucose metabolism in women are predicted by inefficient subcutaneous fat cell lipolysis. Cell Metab. 2018;28:45–54.e3. doi: 10.1016/j.cmet.2018.05.004. [DOI] [PubMed] [Google Scholar]
- Betz M.J., Enerbäck S. Targeting thermogenesis in brown fat and muscle to treat obesity and metabolic disease. Nat. Rev. Endocrinol. 2018;14:77–87. doi: 10.1038/nrendo.2017.132. [DOI] [PubMed] [Google Scholar]
- Boumelhem B.B., Assinder S.J., Bell-Anderson K.S., Fraser S.T. Flow cytometric single cell analysis reveals heterogeneity between adipose depots. Adipocyte. 2017;6:112–123. doi: 10.1080/21623945.2017.1319536. [DOI] [PMC free article] [PubMed] [Google Scholar]
- Chau Y.Y., Bandiera R., Serrels A., Martínez-Estrada O.M., Qing W., Lee M., Slight J., Thornburn A., Berry R., McHaffie S. Visceral and subcutaneous fat have different origins and evidence supports a mesothelial source. Nat. Cell Biol. 2014;16:367–375. doi: 10.1038/ncb2922. [DOI] [PMC free article] [PubMed] [Google Scholar]
- Cossarizza A., Chang H.D., Radbruch A., Akdis M., Andrä I., Annunziato F., Bacher P., Barnaba V., Battistini L., Bauer W.M. Guidelines for the use of flow cytometry and cell sorting in immunological studies. Eur. J. Immunol. 2017;47:1584–1797. doi: 10.1002/eji.201646632. [DOI] [PMC free article] [PubMed] [Google Scholar]
- Crossno J.T., Jr., Majka S.M., Grazia T., Gill R.G., Klemm D.J. Rosiglitazone promotes development of a novel adipocyte population from bone marrow-derived circulating progenitor cells. J. Clin. Invest. 2006;116:3220–3228. doi: 10.1172/JCI28510. [DOI] [PMC free article] [PubMed] [Google Scholar]
- Dahlman I., Arner P. Genetics of adipose tissue biology. Prog. Mol. Biol. Transl. Sci. 2010;94:39–74. doi: 10.1016/B978-0-12-375003-7.00003-0. [DOI] [PubMed] [Google Scholar]
- Drysdale C.M., McGraw D.W., Stack C.B., Stephens J.C., Judson R.S., Nandabalan K., Arnold K., Ruano G., Liggett S.B. Complex promoter and coding region beta 2-adrenergic receptor haplotypes alter receptor expression and predict in vivo responsiveness. Proc. Natl. Acad. Sci. USA. 2000;97:10483–10488. doi: 10.1073/pnas.97.19.10483. [DOI] [PMC free article] [PubMed] [Google Scholar]
- Enerbäck S., Jacobsson A., Simpson E.M., Guerra C., Yamashita H., Harper M.E., Kozak L.P. Mice lacking mitochondrial uncoupling protein are cold-sensitive but not obese. Nature. 1997;387:90–94. doi: 10.1038/387090a0. [DOI] [PubMed] [Google Scholar]
- Eriksson P., Dahlman I., Rydén M., Hoffstedt J., Arner P. Relationship between beta-2 adrenoceptor gene haplotypes and adipocyte lipolysis in women. Int. J. Obes. Relat. Metab. Disord. 2004;28:185–190. doi: 10.1038/sj.ijo.0802521. [DOI] [PubMed] [Google Scholar]
- Eto H., Suga H., Matsumoto D., Inoue K., Aoi N., Kato H., Araki J., Yoshimura K. Characterization of structure and cellular components of aspirated and excised adipose tissue. Plast. Reconstr. Surg. 2009;124:1087–1097. doi: 10.1097/PRS.0b013e3181b5a3f1. [DOI] [PubMed] [Google Scholar]
- Fattaccioli J., Baudry J., Émerard J.-D., Bertrand E., Goubault C., Henry N., Bibette J. Size and fluorescence measurements of individual droplets by flow cytometry. Soft Matter. 2009;5:2232–2238. [Google Scholar]
- Gavin K.M., Gutman J.A., Kohrt W.M., Wei Q., Shea K.L., Miller H.L., Sullivan T.M., Erickson P.F., Helm K.M., Acosta A.S. De novo generation of adipocytes from circulating progenitor cells in mouse and human adipose tissue. FASEB J. 2016;30:1096–1108. doi: 10.1096/fj.15-278994. [DOI] [PMC free article] [PubMed] [Google Scholar]
- Hellmér J., Marcus C., Sonnenfeld T., Arner P. Mechanisms for differences in lipolysis between human subcutaneous and omental fat cells. J. Clin. Endocrinol. Metab. 1992;75:15–20. doi: 10.1210/jcem.75.1.1320047. [DOI] [PubMed] [Google Scholar]
- Himms-Hagen J., Cui J., Danforth E., Jr., Taatjes D.J., Lang S.S., Waters B.L., Claus T.H. Effect of CL-316,243, a thermogenic beta 3-agonist, on energy balance and brown and white adipose tissues in rats. Am. J. Physiol. 1994;266:R1371–R1382. doi: 10.1152/ajpregu.1994.266.4.R1371. [DOI] [PubMed] [Google Scholar]
- Hoffstedt J., Arner P., Hellers G., Lönnqvist F. Variation in adrenergic regulation of lipolysis between omental and subcutaneous adipocytes from obese and non-obese men. J. Lipid Res. 1997;38:795–804. [PubMed] [Google Scholar]
- Jeffery E., Berry R., Church C.D., Yu S., Shook B.A., Horsley V., Rosen E.D., Rodeheffer M.S. Characterization of Cre recombinase models for the study of adipose tissue. Adipocyte. 2014;3:206–211. doi: 10.4161/adip.29674. [DOI] [PMC free article] [PubMed] [Google Scholar]
- Katz L.S., Geras-Raaka E., Gershengorn M.C. Heritability of fat accumulation in white adipocytes. Am. J. Physiol. Endocrinol. Metab. 2014;307:E335–E344. doi: 10.1152/ajpendo.00075.2014. [DOI] [PMC free article] [PubMed] [Google Scholar]
- Kir S., White J.P., Kleiner S., Kazak L., Cohen P., Baracos V.E., Spiegelman B.M. Tumour-derived PTH-related protein triggers adipose tissue browning and cancer cachexia. Nature. 2014;513:100–104. doi: 10.1038/nature13528. [DOI] [PMC free article] [PubMed] [Google Scholar]
- Kuk J.L., Ardern C.I. Are metabolically normal but obese individuals at lower risk for all-cause mortality? Diabetes Care. 2009;32:2297–2299. doi: 10.2337/dc09-0574. [DOI] [PMC free article] [PubMed] [Google Scholar]
- Kurylowicz A., Jonas M., Lisik W., Jonas M., Wicik Z.A., Wierzbicki Z., Chmura A., Puzianowska-Kuznicka M. Obesity is associated with a decrease in expression but not with the hypermethylation of thermogenesis-related genes in adipose tissues. J. Transl. Med. 2015;13:31. doi: 10.1186/s12967-015-0395-2. [DOI] [PMC free article] [PubMed] [Google Scholar]
- Lafontan M., Langin D. Lipolysis and lipid mobilization in human adipose tissue. Prog. Lipid Res. 2009;48:275–297. doi: 10.1016/j.plipres.2009.05.001. [DOI] [PubMed] [Google Scholar]
- Langin D., Dicker A., Tavernier G., Hoffstedt J., Mairal A., Rydén M., Arner E., Sicard A., Jenkins C.M., Viguerie N. Adipocyte lipases and defect of lipolysis in human obesity. Diabetes. 2005;54:3190–3197. doi: 10.2337/diabetes.54.11.3190. [DOI] [PubMed] [Google Scholar]
- Lönnqvist F., Wahrenberg H., Hellström L., Reynisdottir S., Arner P. Lipolytic catecholamine resistance due to decreased beta 2-adrenoceptor expression in fat cells. J. Clin. Invest. 1992;90:2175–2186. doi: 10.1172/JCI116103. [DOI] [PMC free article] [PubMed] [Google Scholar]
- Majka S.M., Fox K.E., Psilas J.C., Helm K.M., Childs C.R., Acosta A.S., Janssen R.C., Friedman J.E., Woessner B.T., Shade T.R. De novo generation of white adipocytes from the myeloid lineage via mesenchymal intermediates is age, adipose depot, and gender specific. Proc. Natl. Acad. Sci. USA. 2010;107:14781–14786. doi: 10.1073/pnas.1003512107. [DOI] [PMC free article] [PubMed] [Google Scholar]
- Majka S.M., Miller H.L., Sullivan T., Erickson P.F., Kong R., Weiser-Evans M., Nemenoff R., Moldovan R., Morandi S.A., Davis J.A., Klemm D.J. Adipose lineage specification of bone marrow-derived myeloid cells. Adipocyte. 2012;1:215–229. doi: 10.4161/adip.21496. [DOI] [PMC free article] [PubMed] [Google Scholar]
- Majka S.M., Miller H.L., Helm K.M., Acosta A.S., Childs C.R., Kong R., Klemm D.J. Analysis and isolation of adipocytes by flow cytometry. Methods Enzymol. 2014;537:281–296. doi: 10.1016/B978-0-12-411619-1.00015-X. [DOI] [PMC free article] [PubMed] [Google Scholar]
- McConnaughey M.M., Sheets K.A., Davis J., Privette J., Hickner R., Christian B., Barakat H. Differences in beta-adrenergic receptor densities in omental and subcutaneous adipose tissue from obese African American and Caucasian women. Metabolism. 2004;53:247–251. doi: 10.1016/j.metabol.2003.09.014. [DOI] [PubMed] [Google Scholar]
- Nedergaard J., Cannon B. The changed metabolic world with human brown adipose tissue: therapeutic visions. Cell Metab. 2010;11:268–272. doi: 10.1016/j.cmet.2010.03.007. [DOI] [PubMed] [Google Scholar]
- Prior S.J., Goldberg A.P., Ryan A.S. ADRB2 haplotype is associated with glucose tolerance and insulin sensitivity in obese postmenopausal women. Obesity (Silver Spring) 2011;19:396–401. doi: 10.1038/oby.2010.197. [DOI] [PMC free article] [PubMed] [Google Scholar]
- Reynisdottir S., Ellerfeldt K., Wahrenberg H., Lithell H., Arner P. Multiple lipolysis defects in the insulin resistance (metabolic) syndrome. J. Clin. Invest. 1994;93:2590–2599. doi: 10.1172/JCI117271. [DOI] [PMC free article] [PubMed] [Google Scholar]
- Rodbell M. Metabolism of isolated fat cells. I. Effects of hormones on glucose metabolism and lipolysis. J. Biol. Chem. 1964;239:375–380. [PubMed] [Google Scholar]
- Rosen E.D., Spiegelman B.M. What we talk about when we talk about fat. Cell. 2014;156:20–44. doi: 10.1016/j.cell.2013.12.012. [DOI] [PMC free article] [PubMed] [Google Scholar]
- Rosenwald M., Perdikari A., Rülicke T., Wolfrum C. Bi-directional interconversion of brite and white adipocytes. Nat. Cell Biol. 2013;15:659–667. doi: 10.1038/ncb2740. [DOI] [PubMed] [Google Scholar]
- Rutkowski J.M., Stern J.H., Scherer P.E. The cell biology of fat expansion. J. Cell Biol. 2015;208:501–512. doi: 10.1083/jcb.201409063. [DOI] [PMC free article] [PubMed] [Google Scholar]
- Shabalina I.G., Petrovic N., de Jong J.M., Kalinovich A.V., Cannon B., Nedergaard J. UCP1 in brite/beige adipose tissue mitochondria is functionally thermogenic. Cell Rep. 2013;5:1196–1203. doi: 10.1016/j.celrep.2013.10.044. [DOI] [PubMed] [Google Scholar]
- Tang Y., Qian S.W., Wu M.Y., Wang J., Lu P., Li X., Huang H.Y., Guo L., Sun X., Xu C.J., Tang Q.Q. BMP4 mediates the interplay between adipogenesis and angiogenesis during expansion of subcutaneous white adipose tissue. J. Mol. Cell Biol. 2016;8:302–312. doi: 10.1093/jmcb/mjw019. [DOI] [PubMed] [Google Scholar]
- Wang W., Seale P. Control of brown and beige fat development. Nat. Rev. Mol. Cell Biol. 2016;17:691–702. doi: 10.1038/nrm.2016.96. [DOI] [PMC free article] [PubMed] [Google Scholar]
- Wang Q.A., Scherer P.E., Gupta R.K. Improved methodologies for the study of adipose biology: insights gained and opportunities ahead. J. Lipid Res. 2014;55:605–624. doi: 10.1194/jlr.R046441. [DOI] [PMC free article] [PubMed] [Google Scholar]
- Wang H., Liu L., Lin J.Z., Aprahamian T.R., Farmer S.R. Browning of white adipose tissue with roscovitine induces a distinct population of UCP1+ adipocytes. Cell Metab. 2016;24:835–847. doi: 10.1016/j.cmet.2016.10.005. [DOI] [PMC free article] [PubMed] [Google Scholar]
Associated Data
This section collects any data citations, data availability statements, or supplementary materials included in this article.