

Abstract
Dual energy x-ray absorptiometry (DEXA) has the ability to rapidly and non-invasively measure bone mineral density and is the most widely accepted method for quantitative assessment of bone mineral status in vivo. There is scarce information available on the baseline bone mineral density (BMD) values in adult intact Suffolk Dorset ewes (5–7 years), a frequently used animal model for the study of post-menopausal osteoporosis. The objective of the present study was to determine the baseline bone mineral density values in 26 adult intact Suffolk-Dorset hybrid ewes using a Lunar Prodigy DPX x-ray bone densitometer. The DEXA scans of the femur, lumbar spine (L3-L6) and calcaneus were obtained. Because of the low variability between the scans for the lumbar vertebrae and calcaneus in the first two animals, only two scans were obtained for the remaining animals of the study. The femoral scans were rejected due to high variability between the scans. The BMD was calculated using the standard GE antero-posterior human spine acquisition software. The bone mineral densities of regions of interest (ROIs) were compared by the Bonferroni significant difference technique. The results of the study demonstrated that the BMD progressively reduced from L3 to L6 and a strong correlation was found between the BMD values for the ROIs from L3 to L6. The present study provided a precise and rapid method for measuring the BMD of the lumbar spine in Suffolk-Dorset breed of sheep and recorded reference values in adult sheep.
Keywords: Sheep, Bone mineral density, DEXA, Lumbar spine, Region of interest
1. Introduction
The most widely used techniques of assessing bone mineral density are dual-energy x-ray absorptiometry (DEXA) and quantitative computerized tomography (CT) [1]. DEXA is the established standard for measuring bone mineral density and allows rapid and non-invasive measurements of BMD and bone mineral content (BMC) providing greater resolution at a low radiation dose [2], [3]. Quantitative CT is the most sensitive method presently available, but results in substantially greater radiation exposure than DEXA. Further, CT is less accessible, technically more difficult to perform and a software package appropriate for sheep has not been developed as yet. DEXA is the most widely accepted method for quantitative assessment of bone mineral status in vivo, and currently serves as an operational definition of osteoporosis by the World Health Organization (WHO) [4] and is used most frequently in measuring the spine and proximal femoral bone densities to estimate the current or future risk of bone fracture or bone loss [5]. DEXA is considered as a gold standard for diagnosing osteoporosis [6].
Although, DEXA has been adapted for use in animals, there is scarce information on the BMD and BMC values in adult sheep, reported to be a viable animal model for the study of post-menopausal osteoporosis in humans [7], [8], [9], [10]. The size of the animal, gross skeletal and vascular anatomy, hormonal profiles, bone histology and skeletal kinetics of bone turnover approximate human skeletal system thus making them a suitable model for osteoporosis research [11], [12], [13], [14]. Finally, yet importantly, societal and ethical implications are low as compared to other large animal models [15], [16]. Sheep are docile, inexpensive, easy to handle and have hormonal profiles similar to women [17].
Although the BMD values have been previously reported for lumbar spine in 3 to 5 year old ewes using the Hologic QDR 1000/W-X ray bone densitometer, the breed of sheep was not reported [18]. Ovariectomised three year old Merino sheep have been validated as a large animal model for the study of vertebral osteoporosis [19]. In humans, each manufacturer of densitometry equipment has his own set of reference values especially for the caucasian female population and hence the BMD differs depending on the equipment used [20]. Therefore, it is possible that the BMD values reported for sheep previously are not uniformly valid for all sheep breeds and for different types of densitometers. Moreover, baseline BMD values in Suffolk-Dorset hybrid ewes (age range 5–7 years, body weight range 138–185 lbs) have not been established as yet. The objective of the present study was to determine the baseline BMD values in sheep of specified breed and age. In this study, we determined the BMD of lumbar spine (L3-L6), femur and calcaneus in 26 adult intact Suffolk-Dorset hybrid ewes using a GE Lunar Prodigy DPX x-ray bone densitometer. The results of this study may be serve as reference values for BMD measurements in Suffolk-Dorset hybrid sheep models used for human osteoporosis research. The creation of standardized reference data must be an important priority in order to harmonize patient management using standardized BMD measurements [21].
2. Materials and methods
2.1. Anaesthesia
All procedures were approved by the Purdue animal care and use committee. Twenty six healthy intact Suffolk-Dorset hybrid ewes (mean age 5.7 ± 0.96, Age range: 5–7 years and body weight range: 138–185 pounds) were included in the study. Feed was withheld for 12 h prior to the scanning procedure. Anaesthesia was induced with Thiopentone sodium1 at a dose rate of 12 mg/kg IV and maintained with 2–3% Isoflurane2 in a closed system.
2.2. Positioning of animal and scanning procedure
Under general anaesthesia, the DEXA scans of the lumbar spine (L3-L6) were obtained using GE Lunar Prodigy DPX x-ray bone densitometer, with the sheep positioned in ventro-dorsal recumbency (Fig. 1). A part of the sacrum incorporated in the images when L6-L7 was scanned was manually removed with edge manipulation. The last four lumbar vertebrae were identified from the DEXA scan images and designated as L3, L4, L5 and L6 (Fig. 2). The regions of interest (ROIs) were defined as the bone areas between two parallel lines located in the inter-vertebral spaces between L3-L4, L4-L5, L5-L6 and L6-S1.
Fig. 1.

DEXA scan of the lumbar spine (L3-L6) using GE Lunar Prodigy DPX X-Ray bone densitometer Scanning procedure with anaesthetized sheep positioned in ventro-dorsal recumbency.
Fig. 2.
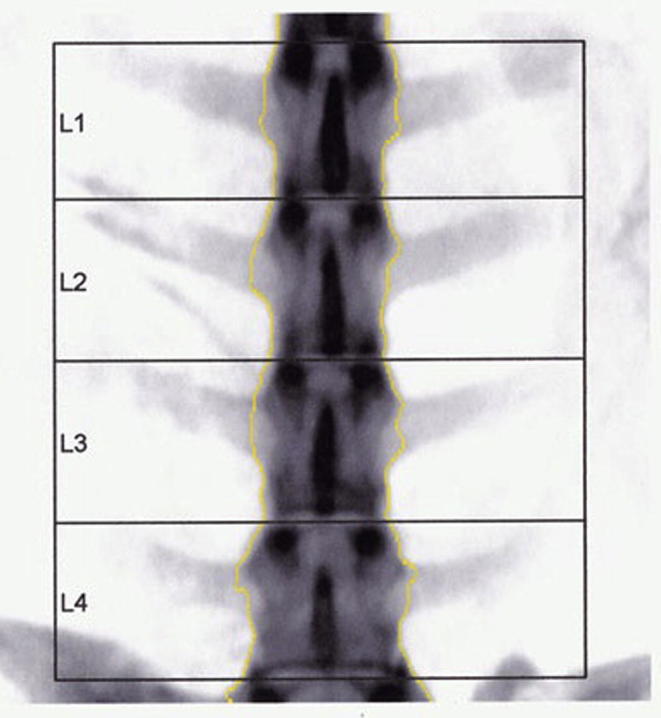
DEXA scan image of the last four lumbar vertebrae. Segment designated L1 in the scan image corresponds to L3, L2 corresponds to L4, L3 corresponds to L5 and L4 corresponds to L6 vertebra in the study.
The iliac crest and the sacral crest were identified to locate the lumbosacral junction in sheep. The scanning started by positioning the laser light indicator on the animals’ midline at the level of the iliac crest, commenced and progressed proximad until all the vertebrae were visible on the display screen. The scanning was stopped at this time to centre the spines such that the spaces on the right and left of the lumbar vertebrae were symmetrical. Lumbar scanning was repeated at the ROI four and three times, respectively, in the first two animals, with repositioning after each scan. To test for precision, consecutive scans were performed. Because of the low variability between the scans per animal for the first two animals, only two scans were obtained for the remaining animals of the study. The scans were repeated if the variability between the successive scans exceeded 2%. The BMC and BMD of the lumbar spine were measured in a standard ventro-dorsal view. Out of the 26 animals, in seven animals the femoral scans were performed on the lateral aspect of the right distal femur and in seven animals, the calcaneal scans were performed on the medial aspect of right calcaneus by restraining the limb securely to the table with sand bags.
2.3. Image acquisition and statistical analysis
The right calcaneal scans were performed using a standard left hip human protocol (Fig. 3). The BMD (g/cm2) was calculated using the standard GE antero-posterior human spine acquisition software (version 3.60). Default settings for the lumbar spine as recommended by the manufacturer were used for the study. All scans were performed by the same operator. The final images were then acquired and used for BMD calculations. The BMD means and standard deviations as well as correlation of the BMD of all ROIs between L3 and L6 were calculated using Minitab software for the Macintosh (version 9.0). Analysis of the same ROI width was carried out, as a small systematic increase in the BMD was seen with increasing width of ROI. The BMD of ROIs was compared using a one way analysis of variance and the Bonferroni significant difference technique [22]. Precision was evaluated by calculating coefficient of variation (CV) for each variable.
Fig. 3.
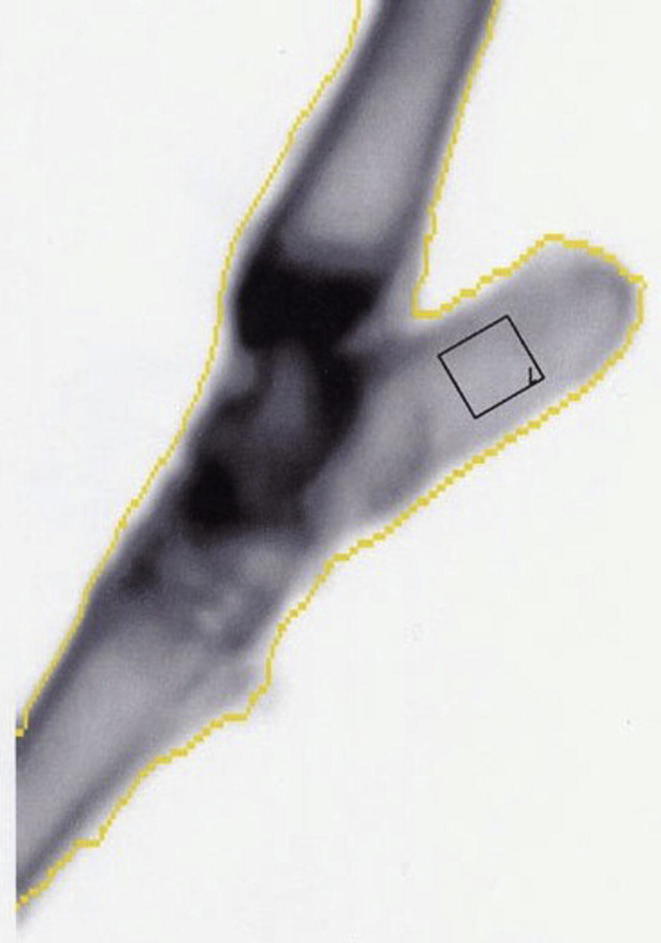
DEXA scan image of calcaneus A right calcaneal scan image obtained using a standard left hip human protocol The rectangular box indicates the region of interest.
3. Results
Suffolk Dorset sheep were docile and easy to handle. The total working time including anaesthetic induction and positioning for each animal was about 25 minutes, the scanning time for lumbar spine was about 10 minutes including repeatable positioning and about 5 minutes for the calcaneus. The means of BMD of L3, L4, L5 and L6 were 1.34 g/cm2 (sd 0.17), 1.30 g/cm2 (sd 0.19), 1.25 g/cm2 (sd 0.18) and 1.15 g/cm2 (sd 0.18), respectively (Fig. 4). The BMD values were higher for the more cranial vertebrae and progressively reduced from L3 to L6. The mean variability between the two scans was 0.65% (sd 0.43, range 0 to 1.54%) (Table 1). The correlation between the BMD of different vertebrae varied between 0.816 and 0.937. The variability was calculated by determining the difference between the maximum and minimum BMD values. In two animals, which were subjected to four and three scans respectively, the variability was calculated for the BMDs with the closest values. The correlation between L3 and L4, L4 and L5, L5 and L6, L3 and L6, L4 and L6, and L3 and L5 was 0.90, 0.94, 0.82, 0.82, 0.83 and 0.82%, respectively. A strong correlation between the BMD values for the ROIs from L3 to L6 was observed. However, this difference was only significant between L3 and L6, and L4 and L6. The BMD correlation between the spine and calcaneus was good.
Fig. 4.

Mean BMD’s of lumbar vertebrae in normal sheep The mean BMD of L3, L4, L5 and L6 were 1.34 g/cm2 (sd 0.17), 1.30 g/cm2 (sd 0.19), 1.25 g/cm2 (sd 0.18) and 1.15 g/cm2 (sd 0.18) respectively.
Table 1.
Descriptive statistics showing mean variability in BMD between two scans.
| Sheep number | Bone mineral density | ||||||||||
|---|---|---|---|---|---|---|---|---|---|---|---|
| SPINE L2-L4 | L2-L4 | L2-L4 | L2-L4 | AVG | DIFF | % variability | avg | % variability “twos” | |||
| 14 | 0.98 | 0.963 | 0.97 | 0.965 | 0.964 | 0.002 | 0.2 | c and e | |||
| 1 | 1.429 | 1.425 | 1.291 | 1.427 | 0.004 | 0.28 | b and c | Mean | 0.694167 | ||
| 5 | 1.241 | 1.222 | 1.231 | 0.019 | 1.54 | Standard Error | 0.088118 | ||||
| 19 | 1.09 | 1.092 | 1.091 | 0.002 | 0.18 | Median | 0.68 | ||||
| 4 | 1.259 | 1.259 | 1.259 | 0 | 0 | Mode | 0 | ||||
| 6 | 1.561 | 1.542 | 1.551 | 0.019 | 1.22 | Standard Deviation | 0.431689 | ||||
| 12 | 1.113 | 1.113 | 1.113 | 0 | 0 | Kurtosis | -0.9595 | ||||
| 8 | 1.448 | 1.461 | 1.454 | 0.013 | 0.89 | Skewness | 0.091154 | ||||
| 13 | 1.434 | 1.42 | 1.427 | 0.014 | 0.98 | Range | 1.54 | ||||
| 21 | 1.001 | 1.009 | 1.005 | 0.008 | 0.8 | Maximum | 1.54 | ||||
| 16 | 1.044 | 1.048 | 1.046 | 0.004 | 0.38 | Sum | 16.66 | ||||
| 20 | 1.007 | 1 | 1.0035 | 0.007 | 0.7 | Count | 24 | ||||
| 15 | 0.878 | 0.876 | 0.877 | 0.002 | 0.23 | Confidence Level (95.0%) | 0.182286 | ||||
| 7 | 1.28 | 1.265 | 1.27 | 0.015 | 1.18 | ||||||
| 17 | 1.029 | 1.023 | 1.026 | 0.006 | 0.58 | % variability of 26 sheep | |||||
| 2 | 1.45 | 1.465 | 1.457 | 0.015 | 1.02 | ||||||
| 11 | 1.246 | 1.23 | 1.238 | 0.016 | 1.29 | ||||||
| 9 | 1.375 | 1.383 | 1.379 | 0.008 | 0.58 | ||||||
| 23 | 1.249 | 1.252 | 1.2505 | 0.003 | 0.24 | ||||||
| 24 | 1.362 | 1.376 | 1.36 | 0.014 | 1.02 | ||||||
| 30 | 1.254 | 1.249 | 1.2515 | 0.005 | 0.4 | ||||||
| 25 | 1.241 | 1.23 | 1.235 | 0.011 | 0.89 | ||||||
| 27 | 1.451 | 1.434 | 1.442 | 0.017 | 1.17 | ||||||
| 31 | 1.285 | 1.28 | 1.2825 | 0.005 | 0.39 | ||||||
| 29 | 1.192 | 1.2 | 1.196 | 0.008 | 0.66 | ||||||
| 28 | 1.243 | 1.239 | 1.241 | 0.004 | 0.32 | ||||||
| MEAN | 1.236 | 1.239 | 1.13 | 0.965 | 0.659 | ||||||
| SD | 0.1765 | 0.1765 | 0.2269 | 0.432 | |||||||
| In sheep 14 and sheep 11, the variability has been calculated for the BMDS with the two closest values. The remaining 2 values in sheep 14 and 1 value in sheep 11 have not been considered | |||||||||||
| SHEEP 16 DIED | |||||||||||
The study demonstrated that repeatable positioning of the ROI was rapidly and easily accomplished with the ventro-dorsal scan of the lumbar vertebrae. The image quality was good and individual vertebra could be accurately identified. The precision error observed in the study was 0.65%. Two animals were rejected in the study due to the presence of a transitional vertebra. The results of the DEXA scan of the distal femur were not considered due to a high percentage of variability ranging from 2.2 to 3.6 per cent between the successive scans. The DEXA scans of the ROI of the calcaneus were found to be repeatable in the study with a precision of 0.75%.
4. Discussion
The present study demonstrated that the GE lunar prodigy system can be used to rapidly measure the BMD values of the lumbar spine in sheep. The results of the study indicated that the BMD progressively reduced from L3 to L6 and a strong correlation was found between the BMD values for the ROIs from L3 to L6. These findings were consistent with the findings of earlier studies [18]. The progressive reduction in the BMD is attributed to the differences in biomechanical forces that act at the mid lumbar spine and the lumbosacral junction. Sheep being a quadruped loads the spine in a way different from a biped. The consistently lower BMD of L5-L6 as compared to L3-L4 is probably due to the decreased movement and mechanical loading at L6 as it articulates with the sacrum and that the vertebrae cranial to L5 –L6 experiencing more motion [18]. Reduced mechanical competence in LS confirmed the suitability of this model for evaluation of potential treatments for osteoporosis [19]. The biomechanical functions of the spine in humans are vastly different from those of deer and sheep. The spines of these species primarily bear load along a single axis, without marked transfer of stress to the periphery whereas in humans, the cancellous bone of the spine plays a role both in weight bearing and load transfer [13]. The variation in BMD values could probably be attributed the quadrupedal nature of sheep and the differences in the characteristics of the horizontal and vertical lumbar cancellous bone microarchitecture between L3-L6. These findings also corroborate earlier studies with sheep cadaver spines, wherein the data obtained from Lunar DPX were excellent and similar to the data obtained using human bones [5]. The correlation between the spine and calcaneus was good and agreed with similar findings in human beings [23], [24]. The best skeletal site for detecting changes in BMD for most disease states that affect the bone is the spine and calcaneus due to the presence of abundant cancellous bone, which has greater surface area and metabolic activity than the cortical bone [25]. The calcaneal and spinal scans provided repeatable values due to a high proportion of trabecular bone at these sites and agreed with the opinion of previously reported literature [18]. The study also demonstrated that repeatable positioning of the ROI was rapidly and easily accomplished with the ventro-dorsal scans of the lumbar vertebrae. It has, however, been reported that the limitations of using densitometers include difficulty in differentiating between the cortical and cancellous bones and scanning in a constant position to ensure repeatability [5] which was not observed in the present study. This was attributed to the restriction in movement of the anaesthetized animal during scanning and to the ability of DEXA scans to provide sufficient contrast between cortical and cancellous bone. Based on the BMD changes observed in DEXA studies, adult ewes may serve as a promising model to evaluate osteopenia and post-menopausal osteoporosis, as bone remodeling occurred in 3 months and a significant decline in bone volume at the iliac crest has been recorded at 6 months after ovariectomy [26]. The present scanning protocol was comparable to a study on validating three year old Merino sheep as a model for osteoporosis using a Dual-energy X-ray absorptiometry (DXA) (QDR 2000, Hologic Inc, Waltham, MA, USA) but the age and breed of sheep was different.
An important feature of DEXA technology is the ability to rescan an identical ROI subsequent to a baseline scan [5]. The precision error was 0.65%, which was comparable to that reported in a human spine study [27]. Coefficient of variation (CV) was found to be reliable in assessing the precision of measurement as demonstrated in earlier studies [18]. The coefficient of variation in the present study varied between 0.8 and 1.5%, which was comparable to an earlier study in sheep that reported a CV between 0.9% and 1.6% for spine BMD [20] and less than 2% for human spine and femur [27]. The study also demonstrated that DEXA allows a rapid and accurate measurement of spine bone mineral density in ewes using the methodology designed for humans [20].
Absolute BMD may vary among the equipment from different manufacturers even if the same skeletal site is measured due to differences in ROI and machine calibration [28]. Human scoliosis protocol using hologic QDR-1000 was reported to be very versatile especially for femoral neck in sheep and could be used to develop measurement techniques for many regional sites but was found ineffective for locating the wards triangle in sheep femur [29]. However, a technique scanning the femur with the left hind limb abducted from the physiological “flexed” normal position in the sheep, without rotation and perpendicular to the spine, to maximise visibility of the femoral neck has been reported [19]. It was also reported that femur BMD measurements in humans were less precise for lunar densitometers than hologic QDR-1000, probably because of the automatic selection of sites for measurements of the femoral neck [30]. In the present study, the femur scans were difficult to perform as the femur could not be extended sufficiently to lie parallel to spine, probably due to the large muscle mass and size of the species. The femur scans were not repeatable and hence were rejected in the study. Lateral scans of the lumbar vertebrae were not considered owing to the difficulty in obtaining repeatable positions and due to the interference of the lumbodorsal fascia and hips in obtaining reproducible scans. When the ROI is too small, poor edge detection is encountered. Edge manipulation can induce errors in analysis and hence using BMD values for the last lumbar vertebra in sheep spine studies is of questionable value [28]. In the present study, the BMD values obtained for L7 was not considered for the study due to poor edge detection. The larger the ROI, the more precise the results [31]. The means of four vertebrae (L4-L6) were taken as representative of BMD changes in spine and the variability in BMD values between L2 andL4 was evaluated. The low variability in the present study was attributed to all scans being performed by the same operator, stable positioning of the animal and accurate location of anatomical landmarks such as the lumbosacral junction and the iliac crest. This facilitated repeatable scans and minimized errors due to incorrect sequential identification of lumbar vertebrae. Misregistration is a cause of precision errors in longitudinal studies involving humans [31]. The variability at different sites is attributed to the difference in body thickness at various skeletal sites. The factors that influenced precision include intrinsic precision of instrument, relationship of bone to position, in-vitro differences between BMC and BMD, repeatability of ROI positioning, selection of large ROI and operator dependent factors [32]. All the scans were performed by the same operator in the present study. The study agreed with earlier reports [30] of high in-vitro precision and reproducibility with DEXA technology.
5. Conclusions
The present study recorded the base line values for the first time in 5–7 years old Suffolk-Dorset breed of sheep using the GE lunar prodigy X-Ray densitometer. The procedure provided a precise and rapid method for measuring the BMD of the lumbar spine in Suffolk-Dorset breed of sheep. The values obtained in this study can be used as the base line reference values to study post-menopausal conditions and osteoporosis using the Suffolk-Dorset sheep model aged between 5 and 7 years and weighing between 138 and 185 lbs. The main advantage of DEXA observed in the present study is the, speed and ease of scanning and reproducibility. This is particularly important in studies using sheep, where prolonged duration under anaesthesia can lead to complications and fatality.
Competing interests
The authors declare that there is no conflict of interest. The funding agency had no role in the study design; in the collection, analysis and interpretation of data; and in the decision to submit the article for publication. None of the authors has any financial or personal relationships that could inappropriately influence or bias the content of the paper.
Ethical approval
All applicable institutional guidelines for the care and use of animals were followed. All procedures performed in studies involving animals were in accordance with the ethical standards of the institution and the approval code for the study is PACUC #: 01-045
Funding
This study was supported by the Century 21st Initiative from the State of Indiana, USA.
Acknowledgement
The authors thank the Department of Foods and Nutrition, Purdue University, USA for the facilities provided.
Footnotes
Peer review under responsibility of Faculty of Veterinary Medicine, Cairo University.
Pentothal TM, Hospira Inc, IL, USA.
IsoFlo, Abbott Animal Health, IL, USA.
References
- 1.Blake G.M., Fogelman I. Applications of bone densitometry for osteoporosis. Endocrinol Metab Clin North Am. 1998;27(2):267–288. doi: 10.1016/s0889-8529(05)70005-0. [DOI] [PubMed] [Google Scholar]
- 2.Kanis J.A., Delmas P., Burckhardt P., Cooper C., Torgerson D.O. Guidelines for diagnosis and management of osteoporosis. Osteoporos Int. 1997;7(4):390–406. doi: 10.1007/BF01623782. [DOI] [PubMed] [Google Scholar]
- 3.Watts N.B., Lewiecki E.M., Miller P.D., Baim S. National Osteoporosis Foundation 2008 Clinician's Guide to Prevention and Treatment of Osteoporosis and the World Health Organization Fracture Risk Assessment Tool (FRAX): what they mean to the bone densitometrist and bone technologist. J Clin Densitom. 2008;11(4):473–477. doi: 10.1016/j.jocd.2008.04.003. [DOI] [PubMed] [Google Scholar]
- 4.World Health Organization, WHO scientific group on the assessment of osteoporosis at primary health care level, 2011.
- 5.Grier S.J., Turner A.S., Alvis M.R. The use of dual-energy x-ray absorptiometry in animals. Invest Radiol. 1996;31(1):50–62. doi: 10.1097/00004424-199601000-00008. [DOI] [PubMed] [Google Scholar]
- 6.Winzenberg T., Jones G. Dual energy X-ray absorptiometry. Aust Fam Physician. 2011;40(1-2):43. [PubMed] [Google Scholar]
- 7.Newton B.I., Cooper R.C., Gilbert J.A., Johnson R.B., Zardiackas L.D. The ovariectomized sheep as a model for human bone loss. J Comp Pathol. 2004;130(4):323–326. doi: 10.1016/j.jcpa.2003.12.007. [DOI] [PubMed] [Google Scholar]
- 8.Turner A.S. The sheep as a model for osteoporosis in humans. Vet J. 2002;163(3):232–239. doi: 10.1053/tvjl.2001.0642. [DOI] [PubMed] [Google Scholar]
- 9.Egermann M., Goldhahn J., Schneider E. Animal models for fracture treatment in osteoporosis. Osteoporos Int. 2005;16(2):S129–S138. doi: 10.1007/s00198-005-1859-7. [DOI] [PubMed] [Google Scholar]
- 10.Martini L., Fini M., Giavaresi G., Giardino R. Sheep model in orthopaedic research: a literature review. Comp Med. 2001;51(4):292–299. [PubMed] [Google Scholar]
- 11.Pastoureau P., Arlot M.E., Caulin F., Barlet J.P., Meunier P.J., Delmas P.D. Effects of oophorectomy on biochemical and histological indices of bone turnover in ewes. J Bone Miner Res. 1989;4(Suppl. 1):58. [Google Scholar]
- 12.Thorndike E.A., Turner A.S. In search of an animal model for postmenopausal diseases. Front Biosci. 1998;3(10):17–26. doi: 10.2741/a260. [DOI] [PubMed] [Google Scholar]
- 13.Wang Y., Liu G., Li T., Xiao Y., Han Q., Xu R. Morphometric comparison of the lumbar cancellous bone of sheep, deer, and humans. Comp Med. 2010;60(5):374–379. [PMC free article] [PubMed] [Google Scholar]
- 14.Lill C.A., Fluegel A.K., Schneider E. Sheep model for fracture treatment in osteoporotic bone: a pilot study about different induction regimens. J Orthop Trauma. 2000;14(8):559–565. doi: 10.1097/00005131-200011000-00007. [DOI] [PubMed] [Google Scholar]
- 15.Turner A.S. Animal models of osteoporosis—necessity and limitations. Eur Cell Mater. 2001;1:66–81. doi: 10.22203/ecm.v001a08. [DOI] [PubMed] [Google Scholar]
- 16.Oheim R., Amling M., Ignatius A., Pogoda P. Large animal model for osteoporosis in humans: the ewe. Eur Cell Mater. 2012;24:372–385. doi: 10.22203/ecm.v024a27. [DOI] [PubMed] [Google Scholar]
- 17.Newman E., Turner A.S., Wark J.D. The potential of sheep for the study of osteopenia: current status and comparison with other animal models. Bone. 1995;16(4):S277–S284. doi: 10.1016/8756-3282(95)00026-a. [DOI] [PubMed] [Google Scholar]
- 18.Turner A.S., Mallinckrodt C.H., Alvis M.R., Bryant H.U. Dual-energy X-ray absorptiometry in sheep: experiences with in vivo and ex vivo studies. Bone. 1995;17(4):S381–S387. doi: 10.1016/8756-3282(95)00315-5. [DOI] [PubMed] [Google Scholar]
- 19.Zarrinkalam M.R., Beard H., Schultz C.G., Moore R.J. Validation of the sheep as a large animal model for the study of vertebral osteoporosis. Eur Spine J. 2009;18(2):244–253. doi: 10.1007/s00586-008-0813-8. [DOI] [PMC free article] [PubMed] [Google Scholar]
- 20.Pouilles J.M., Collard P., Tremollieres F., Frayssinet P., Railhac J.J., Cahuzac J.P. Accuracy and precision of in vivo bone mineral measurements in sheep using dual-energy X-ray absorptiometry. Calcif Tissue Int. 2000;66(1):70–73. doi: 10.1007/s002230050014. [DOI] [PubMed] [Google Scholar]
- 21.Simmons A., Simpson D.E., O'doherty M.J., Barrington S., Coakley A.J. The effects of standardization and reference values on patient classification for spine and femur Dual-energy X-ray absorptiometry. Osteoporosis Int. 1997;7(3):200–206. doi: 10.1007/BF01622289. [DOI] [PubMed] [Google Scholar]
- 22.Moore D.S., McCabe G.P. 2nd ed. Freeman and company; New York, W.H.: 1993. Introduction to the practice of statistics. [Google Scholar]
- 23.Hashimoto K., Satoh T., Takagi-Kobayashi S., Hashizume K., Kinoshita J. Relation of spine BMD and calcaneus BMD measured by DEXA. Osteoporosis Int. 1993;(Suppl. 3):251. [Google Scholar]
- 24.Lindsay R., Cosman F., Herrington B.S., Himmelstein S. Bone mass and body composition in normal women. J Bone Miner Res. 1992;7(1):55–63. doi: 10.1002/jbmr.5650070109. [DOI] [PubMed] [Google Scholar]
- 25.Miller P.D., Bonnick S.L. Bone Densitometry and Osteoporosis. In Primer on the metabolic bone diseases and disorders of Mineral metabolism. 4th Ed. Williams and Wilkins; Philadelphia, Lippincott: 1999. Clinical application of bone densitometry; pp. 152–159. [Google Scholar]
- 26.Turner A.S., Alvis M., Myers W., Stevens M.L., Lundy M.W. Changes in bone mineral density and bone-specific alkaline phosphatase in ovariectomized ewes. Bone. 1995;17(4):S395–S402. doi: 10.1016/8756-3282(95)00317-7. [DOI] [PubMed] [Google Scholar]
- 27.Lochmüller E.M., Krefting N., Bürklein D., Eckstein F. Effect of fixation, soft-tissues, and scan projection on bone mineral measurements with dual energy X-ray absorptiometry (DXA) Calcif Tissue Int. 2001;68(3):140–145. doi: 10.1007/s002230001192. [DOI] [PubMed] [Google Scholar]
- 28.Miller P.D. Principles of bone biology. 2nd ed. Academic press; MA: 2002. Controversial issues in bone densitometry; pp. 1587–1597. [Google Scholar]
- 29.Kaymakci B., Wark J.D. Precise accurate mineral measurements of excised sheep bones using X-ray densitometry. Bone Miner. 1994;25(3):231–246. doi: 10.1016/s0169-6009(08)80241-3. [DOI] [PubMed] [Google Scholar]
- 30.Laskey M.A., Flaxman M.E., Barber R.W., Trafford S., Hayball M.P., Lyttle K.D. Comparative performance in vitro and in vivo of Lunar DPX and Hologic QDR-1000 dual energy X-ray absorptiometers. Br J Radiol. 1991;64(767):1023–1029. doi: 10.1259/0007-1285-64-767-1023. [DOI] [PubMed] [Google Scholar]
- 31.Mazess R., Chesnut C.H., III, McClung M., Genant H. Enhanced precision with dual-energy X-ray absorptiometry. Calcif Tissue Int. 1992;51(1):14–17. doi: 10.1007/BF00296209. [DOI] [PubMed] [Google Scholar]
- 32.Rozenberg S., Vandromme J., Neve J., Aguilera A., Muregancuro A., Peretz A. Precision and accuracy of in vivo bone mineral measurement in rats using dual-energy X-ray absorptiometry. Osteoporosis Int. 1995;5(1):47–53. doi: 10.1007/BF01623658. [DOI] [PubMed] [Google Scholar]