

Abstract
The authors describe a methodology for helping computational biologists diagnose discrepancies they encounter between experimental data and the predictions of scientific models. The authors call these discrepancies data-model conflicts. They have built a prototype system to help scientists resolve these conflicts in a more systematic, evidence-based manner.
In computational biology, data-model conflicts are the result of complex computations in which data and models are transformed and evaluated. Increasingly, the data, models, and tools employed in these computations come from diverse and distributed resources, contributing to a widening gap between the scientist and the original context in which these resources were produced. This contextual rift can contribute to the misuse of scientific data or tools and amplifies the problem of diagnosing data-model conflicts. The authors' hypothesis is that systematic collection of metadata about a computational process can help bridge the contextual rift and provide information for supporting automated diagnosis of these conflicts.
The methodology involves three major steps. First, the authors decompose the data-model evaluation process into abstract functional components. Next, they use this process decomposition to enumerate the possible causes of the data-model conflict and direct the acquisition of diagnostically relevant metadata. Finally, they use evidence statically and dynamically generated from the metadata collected to identify the most likely causes of the given conflict. They describe how these methods are implemented in a knowledge-based system called Grendel and show how Grendel can be used to help diagnose conflicts between experimental data and computationally built structural models of the 30S ribosomal subunit.
Computational tools are critical for helping scientists build models from large volumes of biological data. Models built using computational tools include three-dimensional molecular models,1,2,3,4,5,6 statistically derived models of molecular binding sites,7 models for classifying proteins based on structure,8,9 and models for classifying proteins based on sequence.9,10,11,12 These models typically are constructed by stringing together the results of several computations and are evaluated on the basis of how well their predictions match new experimental observations.
In the course of testing these models, scientists encounter data-model conflicts—disagreements between experimental data and the predictions of a model. Understanding the causes of these conflicts is important for building better models and, ultimately, for scientific discovery,13 yet no general-purpose methodology exists for addressing the wide range of data-model conflicts that can occur in computational biology. Some work has been done to systematize records of experimental procedures in large computational laboratories,14,15 while other approaches have focused on troubleshooting specialized computational processes.16,17
Our method aims to help scientists diagnose a broader array of data-model conflicts encountered in biological computation. Our system utilizes metadata—information about the data, model, instruments, researchers, and algorithms involved at each step of a computational process—to provide a context for diagnosing conflicting computational results.
Unfortunately, recording such metadata can be difficult, given the distributed nature of biological data and computational tools. Increasingly, computational biologists are separated from the original context in which the data, models, and tools they use are generated. We call this the contextual rift. Computational biologists now access large databases of data collected from thousands of scientists, while many analytic tools can either be downloaded or directly accessed on the Internet.18,19,20,21,22,23,24,25,26,27 The contextual rift can result in researchers' overlooking diagnostically important metadata and being unable to find the metadata they need for troubleshooting a computational result.
In this paper we show that an automated diagnostic system can be built that uses metadata about a given data-model conflict to identify the steps in the computational process most likely to be responsible for a given conflict. Our methodology includes a systematic way to define and collect metadata about a computational process as well as a mechanism for using that metadata to support automated diagnosis of conflicts.
In this paper, we present a prototype system that implements the main features of our methodology and allows us to test the feasibility of approaching data-model conflicts in a manner that is more systematic than has been previously possible.
Evaluating Computed Models of the 30S Ribosomal Subunit: An Example
The ribosome structure problem helps to illustrate how metadata can be used diagnostically. A large biological complex composed of a large RNA molecule and 21 proteins, the 30S ribosomal subunit is a cellular component of wide biological and medical interest.6 Several research groups have used different (but overlapping) sets of experimental data to compute three-dimensional structural models of the 30S ribosomal subunit based on experimentally derived distance data.2,4,5,6
In the course of refining and evaluating these models, data-model conflicts arise. ▶ shows an example in which an experimental datum suggests that the distance between two of the atoms is smaller than the distance predicted by the model. This conflict represents an important decision point for the model builder. Revising the model on the basis of erroneous data results in a model less accurate than the original. On the other hand, ignoring valid data results in a model that is limited or incomplete in its explanatory power. Clearly, understanding why a data-model conflict has occurred is crucial to making an informed modeling decision, yet we often lack systematic methods for resolving these conflicts.
Figure 1.

Data-model conflict in the ribosomal modeling problem. The expected distance between two atoms as indicated by new experimental data (staggered line) is much smaller than that predicted by the model (solid line). The mismatch between the distance reported by the data and that predicted by the model constitutes a data-model conflict.
Better understanding of the computational process and the metadata surrounding that process gives insight into the data-model conflict at hand. Evaluation of experimental data in the context of a computed ribosomal model is a multistep process that involves successive manipulations of the original data, culminating in comparison of the data with the predictions of a model. Take, for example, a paper reporting the results of a biochemical experiment showing that a particular RNA component is strongly protected from attack by chemical probes because of its proximity to a large blocking, or “protecting,” ribosomal protein.28 To evaluate how well this structural datum matches a computed model of the 30S ribosomal subunit, this textual information must first be transcribed to an electronic format. Next, the phrase “strongly protected” must be translated into a range of physical distances (in angstroms) between the protein and the RNA base. Finally, this translated (or interpreted) datum is compared with the distance computed between the corresponding molecules in the model. In this process, a data-model conflict could arise from a transcription error, an inappropriate interpretation of distance data, an incorrect computation of distance, or a poor evaluation metric. Metadata about the data-model evaluation process can help us identify which of these steps is most likely to be problematic. For example, more experienced scientists are less likely to incorrectly interpret the data, whereas scientists with less experience might be expected to make more interpretation errors. Correlations found between metadata features and data-model evaluation outcomes can also be used as diagnostic evidence. For example, we may find that a particular experimental technique is consistently correlated with data-model conflicts.
In the following sections, we formalize the diagnostic process by describing methods for systematically defining, acquiring, and using metadata about a data-model conflict for diagnosis; and implementing and integrating these methods in the Grendel system. The output of the Grendel system is a list of the most likely causes of a given data-model conflict. Grendel achieves this diagnosis by:
Explicitly modeling the computational process that gives rise to the data-model conflict
Using the process model to dynamically generate a diagnostic Bayesian belief network
Using the process model to direct the acquisition of diagnostically relevant metadata
Instantiating the diagnostic belief network using evidence generated from the acquired metadata
Performing inference on the diagnostic belief network to generate a list of possible diagnoses
Decomposition of Computational Processes
The experimental process in computational biology can be conceptualized as a series of data transformations and manipulations. Although no specific methodology exists for representing processes in computational biology, there is an extensive literature on the representation of similar “information flow” processes.29,30,31,32,33,34 In particular, we draw on previous work on data flow diagrams and the process interchange format (PIF) to create a representation capable of representing processes in computational biology (although extensible to other computational processes).30,32,33 In the process representation we have developed, there are three different process components—objects, operators, and states. Objects represent the data or models used for computation. Manipulations of objects are carried out by operators, while intermediate data storage are called states. Our method further breaks down these categories to specify the kinds of data objects, operators, and states involved in computational processes. We use a framebased knowledge representation system to provide a flexible framework for defining and representing knowledge about these different process components.35,36,37 By building an ontology of process components, we can provide an extensible “library” of components that can be linked together to form a process description. At the root of the process components ontology is the concept of a process entity; its immediate children are objects, operators, and states. We next discuss each of these subclasses in more detail.
Ontology of Operators
At the highest level of abstraction, we have identified four classes of operators—filters, transcriptions, transformations, and combinations. Each of these high-level classes can be broken down into more specific subclasses (▶).
Figure 2Top.
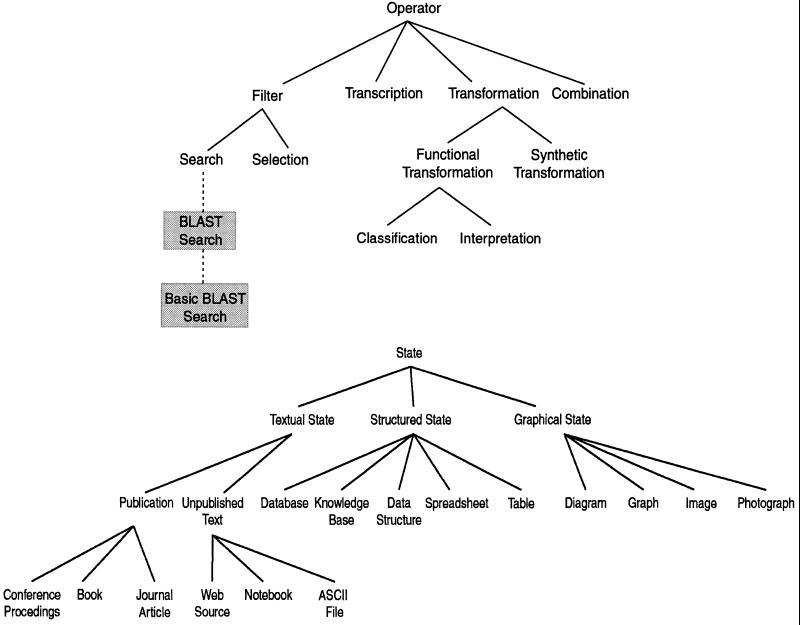
, Ontology of operators. Operators are methods of manipulating data and models. The BLAST search operator and the basic BLAST search operator classes are shown to illustrate how subclasses can be added to the upper level operator classes. These subclasses inherit properties from their ancestor classes, as shown in ▶. Bottom, Ontology of states. States are methods of storing data and models.
Filter operations involve the selection of data from a larger body of data using specified criteria. Filter operations have two major subclasses—selection and search operators. Search operators involve automated selection of the data through user-specified search criteria. Selection operators involve selection of the data through criteria that are not available to the system. We can further define subclasses for even more specific tasks. For example, BLAST searches are a subclass of the search operator specific to using the BLAST search engine of the National Center for Biotechnology Information (NCBI) to search a biologic sequence database for similar sequences.25 BLAST searches can be further divided into basic BLAST searches and advanced BLAST searches, based on the version of the search tool used. There are hundreds of such tools and algorithms commonly used by scientists, and we have not enumerated all of them in our present system but have provided the higher-level ontology for classifying them.
Combination operations take data from different sources and create their union. Representation of this type of operation is useful, because problems are often encountered when multiple data sources are combined. The JOIN operation in a database query language is an example of a combination operator.
Transcription operations involve the duplication of data from one format (state) to another. Transferring data from a database to an ASCII file or data structure is an example of a transcription. Transcription operators are often overlooked during troubleshooting of computational processes but are an important source of human and computer error.38
Transformation operations alter the input data to produce some output. Transformations are a very large class of operators, and many computational tools fall into this category. Transformations range from simple calculation of variance in a sample population to calculating the distance between two molecules and computing ribosomal models from experimental data. We define two subclasses of transformations—functional transformations and synthetic transformations.
A functional transformation operator takes a datum as input and generates an output that is some function of the original input. These transformations preserve the one-to-one correspondence between the input and the output data. In contrast, a synthetic transformation operator generates outputs that have no one-to-one correspondence with the input data. Classification operators (a subclass of functional transformation operators) place an input datum into one of several categories. Interpretation operators (a subclass of functional transformation operators) represent subjectively determined functional mappings. Together, these high-level classes of operators cover many of the operators common in computational processes, although it is possible to elaborate more specific subclasses or change the taxonomy.
Ontology of States
Data states are the different formats and media in which data can be stored (▶). We focus on the storage states that are germane to computational processes. There are three major classes of states—textual, structured, and graphic states. Textual states are media in which the data are stored as free text. A subclass of textual states are publications, whose subclasses include books, conference proceedings, and journals. Other textual states include ASCII files, html-formatted pages, and unpublished text. Structured states are media in which the data are formatted in a more systematic way. Subclasses of structured states include databases, knowledge bases, spreadsheets, data structures, and tables. Graphic states are formats in which the data is nontextual. Subclasses include diagrams, graphs, photographs, and images.
Ontology of Objects
Objects represent the information being manipulated in a computational process. There are two major subclasses of objects—data and models. Although there are many subclasses of data, we focus on one subclass within the scope of this work—experimental data. As for models, we deal with one subclass—computational models.
Each of these classes will have subclasses specific to the problem domain. For instance, for the ribosomal problem, under experimental data, we have defined a class of ribosomal structural data, which in turn has a subclass called cross-linking data. Similarly, under computational models, we have defined a problem-specific class called ribosomal models. We do not claim to have exhaustively enumerated the types of data and models that exist. This ontology must be augmented with concepts specific to the problem domain being addressed.
Building Process Representations from Process Components
The process components ontology defines the “building blocks” for representing computational processes. These components can be linked together to form abstract decompositions of the computational processes underlying data-model conflicts. There are five basic elements in the process descriptions—objects, operators, states, source arcs, and flow arcs. ▶ summarizes these basic components and the rules that govern how they are constructed.
Figure 3.

Process representation method applied to modeling a ribosomal data-model evaluation. The figure represents the step-by-step process of evaluating experimentally derived distance data against the predictions of a three-dimensional ribosomal model using tools provided by the RiboWEB system. The ribosomal atom-to-atom distance data are first extracted from a journal article and transcribed to the RiboWEB knowledge base. Those data are selected from the knowledge base and then interpreted by the user. These interpreted data are compared with the predicted atom-to-atom distance of a user-selected model, yielding a numeric result measuring the discrepancy between the predicted and expected atom-to-atom distances. This discrepancy is then classified by the user as being problematic (i.e., a data-model conflict) or within the margin of error. Notice that each step in this process has parameters and assumptions that ultimately make the troubleshooting of problematic results difficult. The diagram represents the successive manipulations and transformations of an object, starting with the original object, until some final result is achieved. The rules for constructing these diagrams are as follows: 1) An object must be at the source of every process sequence. 2) A source arc must connect the object to the first state of the process sequence that manipulates it. 3) There cannot be a data flow arc connecting two states directly. 4) There must be at least one data flow arc connecting the output of an operator with a state. 5) States can have data flow arcs connecting them to several operators. This indicates that the same object is being passed as input into several different operators. 6) Operators can have data flow arcs connecting them to several states. This indicates that the same object is being stored in several different states. Circles indicate transcription; inverted triangles, filter; quadrilateral, transformation. JA indicates journal article; KB, knowledge base; DS, data structure.
We have applied this method to representing the data-model evaluation process in the RiboWEB system. The RiboWEB system provides computational tools for evaluating ribosomal experimental data against published ribosomal model information.20,39 On the basis of user selection of an experimental datum, a numeric interpretation of that datum, and a three-dimensional structural model, RiboWEB calculates the difference between the interpreted datum and the distance actually calculated between the corresponding pair of molecules in the model. The user then determines whether the discrepancy is large enough to classify the result as a data-model conflict. ▶ shows how this computational process can be represented using our proposed process representation.
In this example, we represent the process from a user's perspective; on the other hand, we could have chosen to represent the process from a system view, at a finer granularity than what users typically see. At a system-level view, some of the process components in ▶ would be further decomposed. Furthermore, we have started modeling the process at the point where the data are published in a journal article and the model is published in some publicly available database. If we were interested in the computational process used to derive the model itself, we could have “pushed back” the system boundary to include a detailed representation of the computational process that produced the model itself. The choice of a system boundary is based on the scope of diagnosis desired and the extent of the modeler's knowledge about the computational process itself.
▶ shows examples of the types of errors that can occur at each step in the ribosomal data-model evaluation process and shows how the process decomposition method provides a systematic way of enumerating possible causes of a given data-model conflict. The diagnostic problem then becomes a problem of identifying the process steps that are most likely to be the causes of a given data-model conflict.
Figure 4.

Errors that can occur at each step in the ribosomal data-model evaluation process. For each component of the process modeled in ▶, an example problem associated with that component is shown. Similar problems also exist for the right side of the process model.
Definition and Collection of Diagnostically Relevant Metadata
Efforts in other domains suggest that the definition and collection of metadata must be closely tied to the intended application. Several groups have looked at collecting metadata to support computing environments at large laboratories for data archiving and retrieval.14,15,40 The Dublin Core group has defined a core set of metadata features to help describe networked resources, thus enhancing their search and retrieval.41,42 Metadata tags have been added to Web-based documents using XML.43 To facilitate comparison among different data sources, the U.S. National Geological Survey's Biological Resources Division has spearheaded the National Biological Metadata Standard.44 Metadata have also been used to help identify errors in the computational analysis of the data in social science databases.45
We use the diagnostic task to focus the definition and acquisition of relevant metadata. For each process component, we define a set of metadata features that are relevant to determining whether that component is likely to be the source of the data-model conflict. The metadata features relevant to diagnosing a given data-model conflict can be defined as the sum of all metadata features relevant to diagnosing individual process components.
By enumerating metadata features for process components, rather than processes as a whole, we can build lists of diagnostically relevant metadata that are specific for a particular data-model conflict and we can ease the task of instantiating important metadata features. Nonetheless, enumerating diagnostically relevant metadata for each process component is a labor-intensive task. Some metadata features may be relevant to more than one process component.
The process components ontology provides a natural framework in which to represent metadata features for the different process components. For any given process component, metadata properties are inherited from its ancestors in the ontology. ▶ describes the metadata features for a basic BLAST search as defined in the process ontology.
Table 1.
List of Metadata Features for a Basic BLAST Search*
| Metadata Feature | Ancestor Class | Possible Values | Description | Significance |
|---|---|---|---|---|
| User_Experience | Operator | Extensive, moderate, very_little | The experience level of the person doing the search | If it is extensive, the probability of error should be lower. |
| User_Occupation | Operator | Undergraduate, graduate, research-assistant, post-doc, professor, professional | The occupation of person doing the analysis | Possible correlation with outcome. |
| User_Name | Operator | <any string> | The name of the person carrying out the search | Possible correlation with outcome. |
| Number_of_Input_Data_Sources | Filter Operator | One, more_than_one | The number of data sources being searched | Possible correlation with outcome. |
| Number_of_User_Set_Parameters | Search Operator | One, 1_to_3, 3_to_10, greater_than_10 | The number of search criteria that are set by the user | Possible correlation with outcome. |
| Search_Defaults_Changed | Search Operator | Yes, no | This feature records whether the search criteria have been changed from their default values | If the user experience is high but the search defaults have not been changed, then there is greater possibility of error. If the user is relatively inexperienced but has changed the default settings, then there is a greater probability of error. |
| BLAST_version | BLAST Search Operator | Version_1.0, version_2.0 | The version of BLAST used | Possible correlation with outcome |
| Program | Basic BLAST Search Operator | Blastn, Blastp, Blastx, Tblastn, Tblastx | Parameter that must be set for a basic BLAST search | Possible correlation with outcome |
| Database | Basic BLAST Search Operator | Nr, Month, Swissprot, Dbest, Dbsts, Mouse_ests, Human_ests, Other_ests, Pdb | Parameter that must be set for a basic BLAST search | Possible correlation with outcome |
| Ungapped_Alignment | Basic BLAST Search Operator | Yes, no | Parameter that must be set for a basic BLAST search | Possible correlation with outcome |
| Data_Format | Basic BLAST Search Operator | Fasta, Accension_Or_Gi | Parameter that must be set for a basic BLAST search | Possible correlation with outcome |
A basic BLAST search is a common operation performed by computational biologists when searching for a specific DNA sequence. The first column shows the complete list of metadata features for a basic BLAST search. This list is the union of all the metadata features of its ancestors. The second column identifies the ancestors of the basic BLAST search operator (in the process components ontology) from which the metadata features were inherited. Some of the metadata properties listed in the table are considered correlative features. The correlations found between those features and the occurrence of data-model conflicts can be used as diagnostic evidence.
Using the process description for a given computational process and the process ontology populated with metadata features, we can construct a list of diagnostically relevant metadata features for a given data-model conflict. We call this list a metavector. This template is generic for data-model evaluations done using the same computational process and thus must be defined only once and then filled in for each specific instance of a data-model comparison. To construct the metavector, we look up the metadata features associated with each component in the process decomposition and collect them in a list. Instantiated metavectors consist of metadata feature-value pairs. In principle, much of the metadata can be acquired automatically from the computational components used. Currently, however, users enter some of this information manually using a simple acquisition tool (▶). The next section describes how we use a Bayesian framework to build a diagnostic system that reasons using metadata.
Figure 5.

Interface for acquiring metadata and instantiating a metavector. Each process step has a set of metadata that must be collected. In many cases, these values can be acquired automatically from the computer programs performing the actual calculations.
Construction of a Bayesian Framework for Diagnosis
We use Bayesian belief networks to support automated diagnosis using evidence generated from process metadata. A Bayesian belief network is a graphic representation of probabilistic dependencies between evidence and conclusions.46
In the data-model conflict diagnosis problem, belief networks have specific advantages over rule-based and machine learning methods because they represent uncertainties in relationships between metadata evidence and possible diagnoses; have a mathematically sound basis in probability theory; provide an expressive, intuitive graphic representation; make independence assumptions explicit; and use statistical information directly as knowledge.47,48,49
Each diagnostic belief network produced by the Grendel system consists of two node types—evidence nodes representing metadata features and problem nodes representing causes of data-model conflicts. The dependencies between evidence nodes and problem nodes are represented by arcs pointing in the direction of causality. This is similar to the two-level belief network topology used in some automated medical diagnostic systems.46 On the basis of the process description for a given data-model conflict, we generate one problem node corresponding to each component in the process. ▶ shows how these nodes are created. Associated with each of these nodes is a prior probability of a problem occurring in that step of the process. These probabilities can come from statistical analysis of previous experience or be subjective probability estimates.
Figure 6.

Dynamic generation of a diagnostic belief network specific for a data-model conflict. Problem nodes are generated from a process decomposition, while evidence nodes are generated using a metavector. The metavector itself is generated from appending together the metadata features for all process components in the process decomposition. The conditional probabilities are added on the basis of statically and dynamically derived evidence, as discussed in the text.
Similarly, for each metadata feature in the metavector, we create one evidence node (▶). Arcs connect each problem node with evidence nodes relevant to its diagnosis. For each evidence node, a conditional probability table is specified on the basis of the probability of the observed metadata feature given the causes of data-model conflicts it is conditioned on. These conditional probabilities are either statically generated by a domain expert or dynamically generated on the basis of correlations found between the metadata features and the outcomes of the corresponding data-model evaluations, as described in the following section.
Static and Dynamic Conditionals
Static conditionals are based on heuristic rules acquired from experts. These rules are created and enumerated by experts with experience diagnosing data-model conflicts. In general, these rules have a very simple form:
If [Feature Name is Feature Value]* then <Increase or Decrease> the likelihood of A Cause of Data-model Conflict
The asterisk indicates that the rule can be conditioned on more than one feature-value pair. Examples of rules are:
If User_Experience_With_Computational_Method is Extensive then Decrease the likelihood of Error_In_Computational_Step
If Review_Status_Of_Journal_Article is Not_Peer_Reviewed then Increase the likelihood of Error_In_Primary_Data
If The_Basis_Of_The_Interpretation is Expert_Opinion then Decrease the likelihood of Error_In_Interpretation_Step
If The_Database is Not_Curated then Increase the likelihood of Error_In_The_Database
If The_Input_And_Output_States_For_A_Transcription are Very_Different then Increase the likelihood of Error_In_Transcription_Step
Enumerating these rules is a labor-intensive task. We have built an initial set of 23 heuristics based on our own experiences diagnosing data-model conflicts. These rules, conditioned on metadata feature-value pairs, provide one line of evidence for identifying the cause of a conflict.
Whereas static conditionals represent compiled knowledge about the association between metadata and the possible causes of data-model conflicts, our system can also learn such associations by examining the results of many training runs and inferring new associations. Such conditional dependencies are “dynamic” in the sense that they may be recognized by the system in the context of a particular data set. These rules may subsequently be added to the rule set if they have sufficient generality. We use simple tests of correlation (chi squared) to infer dynamic rules, as illustrated in ▶.
Figure 7.

Dynamic generation of evidence by finding correlations between metadata values and evaluation outcome over many data-model evaluations. It is important to collect metadata for all data-model evaluations done, regardless of outcome. This example shows a possible correlation between the type of experiment used to derive the primary data and the occurrence of data-model conflicts, suggesting that experimental mutation methods may be problematic. Both positive and inverse correlations can be used as evidence for updating beliefs about which process components may be contributing to the data-model conflict.
Estimating Prior Probabilities and Solving Diagnostic Problems
We instantiate the belief network evidence nodes with the metadata values we have acquired and then run an inference algorithm to generate posterior probabilities of error for each of the problem nodes. The nodes with the highest probabilities of error represent the most likely causes of the data-model conflict being diagnosed (as shown in ▶).
Figure 9.

Testing Grendel's response to static rules. a, Diagnostic belief network generated for diagnosing ribosomal data-model conflicts. b, Probabilities of error for each step in the process prior to the introduction of static evidence. c, Updated probabilities of error after simulated interpretation error (metadata values: default_parameters_changed=yes, user_experience=very_little, interpretation_basis=personal_experience). The interpretation step is correctly singled out as the step most likely to be problematic. Notice that most of the prior probabilities remain unchanged because they are unaffected by the metadata we introduced. d, Updated probabilities of error after simulated journal article error (metadata values: peer_reviewed=no, journal_quality=poor). Based on the new metadata evidence, the same belief network now identifies the journal article reporting the data as a potential source of error.
Our belief network formalism is based on several assumptions. First, we assume that evidence is conditionally independent. In addition, given that we have broken down the data-model evaluation task into independently functioning components, we assume that problems are independent. Finally, we assume that the evidence can be generated independently by multiple problems. We model this causal independence assumption using a noisy-OR gate.46,50
Because no prior systematic attempt has been made to collect quantitative data about the probabilities of different errors in the processes we model, we use subjective estimates based on our experience troubleshooting data-model conflicts. Our formal evaluation of this system will involve testing the sensitivity of our system to these estimates. We expect that as our system is used to systematically record metadata about many data-model conflicts, we will be able to empirically derive these probabilities.
Implementation and Experimental Results
We have implemented our methodology in the Grendel system. ▶ describes each component of the system. We describe here the results of applying Grendel to diagnosing data-model conflicts arising from modeling of the 30S ribosomal subunit.
Figure 8.

Grendel system architecture. Unless otherwise noted, these components are implemented in Allegro LISP 3.0 for PC/Windows. Starting with a process decomposition and a data-model conflict, the system gathers data to diagnose the likely cause of the conflict. The process knowledge base (process KB) stores metadata features, prior probability of error, and component-specific, metadata-dependent diagnostic rules for each process component class defined in the knowledge base. The process decomposition tool allows construction of process descriptions from the components defined in the knowledge base. The metavector generator takes the process decomposition and the metadata features defined in the process KB as input and outputs the corresponding metavector. The metadata acquisition tool takes a metavector as input and queries the user for values for each of the features in the metavector. The result is an instantiated metavector that contains the metadata needed to diagnose a data-model conflict. The diagnostic belief network generator takes the process description for a data-model conflict as input and outputs a file that specifies the belief network topology. The evidence generator generates a file with the instantiations of the evidence nodes needed for diagnostic inference. The belief network inference engine we used is MSBN, a belief network builder and inference tool publicly available for the PC from Microsoft.54 The diagnostic belief network generator and the evidence generator both provide input files for the MSBN tool. The MSBN tool makes it possible to visualize the belief network (that was generated by the belief network generator), instantiate it with evidence (that was generated by the evidence generator), and do diagnostic inference on the belief network given the evidence. The output is a bar graph showing the probability of error for each problem node in the diagnostic belief network.
Decomposition of the Ribosomal Data-Model Evaluation Process Using Grendel
Using the process decomposition tool, we represented the process of doing a data-model evaluation in the RiboWEB system, as described earlier, using the domain-independent process components that were already part of the process components knowledge base (process KB). For each step in the computational process, we chose the most specific component in the process KB that described the RiboWEB component we wanted to represent. For example, one step in the data-model comparison process requires the users to choose the datum they want from a knowledge base of ribosomal structural data. To represent this step in the process, we chose the selection operator from the process KB. This was the most specific component in the KB applicable to the process step at hand. We also could have chosen to represent this step as a filter operation, which is more general than the selection operation.
The problem with choosing a more general abstraction of a particular process step is that we lose the more specific metadata features. Alternatively, we could have chosen to populate the ontology with components that are more domain specific, thus giving us the ability to specify other unique metadata properties relevant to diagnosing a particular process step. For example, we could have added a child to the selection operator called select_from_KB, which has metadata features specific to the task of choosing information from a knowledge base. The decomposition of the ribosomal data-model evaluation process was shown graphically in ▶.
Acquisition of Diagnostically Relevant Metadata Using Grendel
Using this process decomposition and the metadata features defined in the process KB as input, the metavector generator automatically produced a metavector with 153 diagnostically relevant metadata features specific to data-model evaluations done using the RiboWEB system. This metavector was used as input to the metadata acquisition tool (▶), which was used to acquire metadata about the ribosomal data-model evaluation process as each computational step was being carried out.
Generation of a “Custom-fit” Belief Network
On the basis of process decomposition and the instantiated metavector, the diagnostic belief network generator automatically created a description of the nodes in the belief network, the dependencies between these nodes, and the evidence used to instantiate these nodes. This description was used as input to the MSBN belief network tool, which did inference on the belief network to generate updated probabilities for each of the problem nodes.
Diagnostic Results Using Only Static Conditionals in the Belief Network
We first tested Grendel's diagnostic capability using statically generated conditionals (based on expert generated heuristics) alone. On the basis of the process model shown in ▶, Grendel automatically generated a diagnostic belief network and a tool for acquiring metadata evidence about the process. We simulated two problem scenarios by entering metadata appropriate to these scenarios during the metadata acquisition phase. First, we simulated the experience of users relatively inexperienced in the data translation step, where users either choose a default set of interpretations provided by the RiboWEB system or modify the default interpretations on the basis of their experience. Recall that these “interpretations” map qualitative data describing RNA and protein proximity to a set of numeric distance constraints. Using the statically defined rules, the diagnostic belief network is able to identify potentially problematic steps in the data-model evaluation process in different problem scenarios. In particular, on the basis of metadata about the extent of users' previous experience doing data interpretations, the alteration of the default set of data interpretations, and the scientific basis for the new data interpretations, Grendel was able to single out the data interpretation step as the step most likely to be problematic using the set of statically defined conditional probabilities represented in the diagnostic belief network (and stored in the Grendel knowledge base). ▶ shows the change in the probabilities for each of the problem nodes, given the metadata evidence for this scenario. In the second scenario, also summarized in ▶, Grendel diagnoses conflicts that may arise when using data from a non-peer-reviewed data source.
Testing the Ability to Find Correlations between Metadata Values and Outcome
To demonstrate the feasibility of dynamically generating conditionals (rules based on empirical evidence), we looked for correlations between metadata values and evaluation outcomes over a large set of instantiated metavectors. To perform this test, we first collected 153 metadata values for each of 1,973 separate ribosomal data-model evaluations done using the RiboWEB system. In these evaluations, different sets of data were compared against different models using different sets of parameters. The resulting group of 1,973 instantiated metavectors contained both positive data-model evaluation results (i.e., data-model evaluations that resulted in no conflict being found) and negative results (i.e., data-model evaluations where a conflict was found). For each metadata value in this reference metavector, we used the chi-squared test to determine whether the value for that feature was significantly associated with positive or negative evaluation results (i.e., conflict or no conflict) over all 1,973 instantiated metavectors.
The results of the analysis showed that, of the 153 metadata values of the reference metavector, five were significantly correlated with computational outcome (i.e., conflict or no conflict). ▶ shows these five results. Each of these five correlations points to a possible diagnosis of the reference metavector. (In these examples, we have replaced the actual names of researchers and algorithms with pseudonyms.).
Figure 10.

Correlations found using a chi-squared algorithm. See text for detailed explanation of each result. The parameters for each correlation can be interpreted as follows. Process step: the identification of the step in the evaluation process. Class: the class of the process step (as defined in the process components ontology). Metadata feature: the name of the metadata feature. Metadata value: the value of the metadata feature in the reference vector. This is the value that is correlated with evaluation outcome. Chi-squared statistic: The statistic calculated over all 1,973 metavectors. Cutoff for 0.01 significance: the cutoff value for a significance level of P = 0.01 and df = 1. Cramer V: the statistic that measures the strength of the association. The closer this statistic is to 1, the stronger the association.
Data published by “author A” may be problematic (▶). The chi-squared statistic indicates that of the 1,973 data-model evaluations, the number of instances in which the author of the ribosomal data was author A and the outcome of the evaluation was a conflict was greater than would be expected by chance (P = 0.01). The Cramer V statistic indicates that the strength of this relationship, however, is relatively weak. Nevertheless, this may be a possible cause of the data-model conflict.
The default data interpretation may be problematic (▶). In the RiboWEB system, many different sets of data interpretations are available to the user, but this result indicates that the default set of interpretations is associated with data-model conflicts. This result is not surprising, since the data interpretations can be sensitive to precise interpretations and the default parameter settings are selected as a reasonable average.
“Algorithm A” for building ribosomal models may be problematic (▶). Based on the Cramer V statistic, the association between the use of algorithm A for building ribosomal models and the occurrence of data-model conflicts is stronger than most of the other metadata associations found.
-
Models built by “author B” may be problematic (▶). In this case, we see that the calculated chi-squared statistic is identical to that calculated for algorithm A. This suggests a dependency between the author of the model and the algorithm used to build the model. Indeed, author B always uses algorithm A to build ribosomal models, and no other researchers have used algorithm A to build models, so we have no way of telling whether the problem is with algorithm A or with author B's modeling techniques, without further information. To distinguish between these two possibilities, we need to evaluate models built by author B using an algorithm different from algorithm A and also evaluate models built by others using algorithm A.
This example points out that the system can suggest new lines of experimentation or data gathering that can help the quality (and specificity) of the diagnosis. Since the system assumes that evidence is independent, we should not use the information from this correlation at the same time that we use the information correlating the author with conflicts, since these two observations are highly dependent. We can use measures of correlation, in general, to ensure that redundant information is not introduced dynamically into the system.
Data involving cross-linking with proteins may be problematic (▶). This result indicates that data that involving RNA bases cross-linked with proteins are correlated with data-model conflicts. This finding could indicate that distance constraints involving proteins are, in general, less precise than base-to-base cross-linking constraints. The Cramer V statistic, however, indicates that this is a weak association and probably of diminished diagnostic importance.
Notice that the system makes two kinds of inference. The first type of inference concerns the people and algorithms performing the analyses, and the second type of inference finds correlations between certain scientific concepts (e.g., cross-links) and incompatibilities. Both inferences can be useful in debugging unexpected results.
Conclusion
Our methodology has been made possible by two lines of work. First, techniques for structured, semantically rich representations of scientific information now provide the opportunity to use metadata to support automated reasoning about scientific data and models.19,20,51,52 Second, tools for probabilistic diagnosis have matured and are now available as a component of larger software systems. Together, these technologies produce capabilities for supporting scientific reasoning that has not been possible until now.
Development and testing of Grendel continues, as it is the first prototype implementation of our ideas on how to diagnose data-model conflicts. We are encouraged that we have already identified examples of how our system can help computational biologists troubleshoot data-model conflicts that they encounter. In contrast to manual, ad hoc approaches to diagnosing data-model conflicts, we provide a systematic framework for understanding data-model conflicts that result from computational processes. In the short term, our system may allow us to make sense of more than 10,000 pieces of data and multiple proposed models stored in the RiboWEB knowledge base (http://www.smi.stanford.edu/projects/helix/riboweb.html) and build better models of the 30S ribosomal subunit.
Our system must be evaluated further (in the context of RiboWEB and other domain applications) along several dimensions—accuracy, generalizability, and utility. We can add basic explanation capability to increase the acceptance of diagnostic support by its users.53 We are also exploring the use of other statistical and machine learning techniques that can find more complex correlations between metadata values and computational outcomes. There are also opportunities for implementing more complex heuristics and rules that can reason using process topology information and local context information.
In summary, we have presented a new methodology (and a prototype implementation) for approaching the problem of diagnosing data-model conflicts. Our methodology is designed particularly for data-model conflicts that arise out of multistep processes involving the interaction of people, machines, and instruments. These are certainly characteristics of many computational processes, but they are also characteristics of other problem domains as well—diagnosis of disease, understanding poor clinical laboratory results, and troubleshooting failed biological experiments.
This work was supported in part by grants LM05652 and LM06422 from the National Institutes of Health, grant DBI-9600637 from the National Science Foundation, and grants from IBM and SUN Microsystems.
References
- 1.Koehl P, Levitt M. A brighter future for protein structure prediction. Nat Struct Biol. 1999;6(2):108-11. [DOI] [PubMed] [Google Scholar]
- 2.Fink DL, Chen RO, Noller HF, Altman RB. Computational methods for defining the allowed conformational space of 16S rRNA based on chemical footprinting data. RNA. 1996;2(9):851-66. [PMC free article] [PubMed] [Google Scholar]
- 3.Altman RB, Weiser B, Noller HF. Constraint satisfaction techniques for modeling large complexes: application to the central domain of 16S ribosomal RNA. In: Altman R, Brutlag D, Karp P, Lathrop R, Searls D (eds). Proceedings of the 2nd International Conference on Intelligent Systems for Molecular Biology. Menlo Park, Calif.: AAAI Press, 1994:10-8. [PubMed]
- 4.Hubbard JM, Hearst JE. Computer modeling 16S ribosomal RNA. J Mol Biol. 1991;221(3):889-907. [DOI] [PubMed] [Google Scholar]
- 5.Malhotra A, Harvey SC. A quantitative model of the E. coli 16S RNA in the 30S ribosomal subunit. J Mol Biol. 1994;240:308-40. [DOI] [PubMed] [Google Scholar]
- 6.Noller HF, Powers T, Heilek GM, Mian S, Weiser B. A refined model for the folding of 16S rRNA in 30S ribosomal subunits incorporating hydroxyl radical probing data. 1996.
- 7.Wei L, Altman RB. Recognizing protein binding sites using statistical descriptions of their 3D environments. In: Altman RB, Dunker AK, Hunter L, Klein TE (eds). Proceedings of the Pacific Symposium of Biocomputing '98. Maui, Hawaii: World Scientific, 1997:497-508. [PubMed]
- 8.Swindells MB, Orengo CA, Jones DT, Hutchinson EG, Thornton JM. Contemporary approaches to protein structure classification. Bioessays. 1998;20(11):884-91. [DOI] [PubMed] [Google Scholar]
- 9.Bork P, Koonin EV. Protein sequence motifs. Curr Opin Struct Biol. 1996;6(3):366-76. [DOI] [PubMed] [Google Scholar]
- 10.Tatusov RL, Koonin EV, Lipman DJ. A genomic perspective on protein families. Science. 1997;278(5338):631-7. [DOI] [PubMed] [Google Scholar]
- 11.Holm L. Unification of protein families. Curr Opin Struct Biol. 1998;8(3):372-9. [DOI] [PubMed] [Google Scholar]
- 12.Bowie J, Luthy R, Eisenberg D. A method to identify protein sequences that fold into a known three-dimensional structure. Science. 1991;253(5016):164-70. [DOI] [PubMed] [Google Scholar]
- 13.Kuhn T. The Structure of Scientific Revolutions. Chicago, Ill.: University of Chicago Press, 1962.
- 14.Keller T, Jones D. Metadata: the foundation of effective experiment management. In: Coyne R, Colucci J, Miller C, et al. (eds). Proceedings of the 1st IEEE Metadata Conference. Silver Spring, Md.: IEEE, 1996.
- 15.Baru C, Frost R, Marciano R, Moore R, Rajasekar A, Wan M. Metadata to support information-based computing environments. In: Coyne B, Colucci J, Musick R (eds). Proceedings of the 2nd IEEE Metadata Conference. Silver Spring, MD.: IEEE, 1997.
- 16.Karp PD (ed). A qualitative biochemistry and its application to the regulation of the tryptophan operon. Menlo Park, Calif.: AAAI Press, 1993.
- 17.Karp PD. Design methods for scientific hypothesis formation and their application to molecular biology. Machine Learning. 1993;12:89-116. [Google Scholar]
- 18.Baker PG, Brass A. Recent developments in biological sequence databases. Curr Opin Biotechnol. 1998;9(1):54-8. [DOI] [PubMed] [Google Scholar]
- 19.Karp P, Riley M, Paley S, Pellegrini-Toole A. EcoCyc: electronic encyclopedia of E. coli genes and metabolism. Nucleic Acids Res. 1996;24(1):32-40. [DOI] [PMC free article] [PubMed] [Google Scholar]
- 20.Chen RO, Felciano R, Altman RB. RiboWeb: linking structural computations to a knowledge base of published experimental data. In: Gassterland T, Karp P, Karplus K, Ouzounis C, Sander C, Valencia A (eds). Proceedings of the 5th International Conference on Intelligent Systems for Molecular Biology. Menlo Park, Calif.: AAAI Press, 1997:84-7. [PubMed]
- 21.Barioch A, Apweiler R. The SWISS-PROT protein sequence data bank and its supplement TrEMBL. Nucleic Acids Res. 1997;25(1):31-6. [DOI] [PMC free article] [PubMed] [Google Scholar]
- 22.Bernstein FC, Koetzle TF, Williams GJB et al. The Protein Data Bank: a computer-based archival file for macromolecular structures. J Molec Biol. 1977;112:535-42. [DOI] [PubMed] [Google Scholar]
- 23.Benson DA, Boguski MS, Lipman DJ, Ostell J. GenBank. Nucleic Acids Res. 1997;25(1):1-6. [DOI] [PMC free article] [PubMed] [Google Scholar]
- 24.Felciano RM, Chen RO, Altman RB. RNA Secondary structure as a reusable interface to biological information resources. Gene-COMBIS. 1997;190:GC59-70. [DOI] [PubMed] [Google Scholar]
- 25.Altschul SF, T.L. M, Schaffer AA, et al. Gapped BLAST and PSI-BLAST: a new generation of protein database search programs. Nucleic Acids Res. 1997;25(17):3389-402. [DOI] [PMC free article] [PubMed] [Google Scholar]
- 26.Richardson DC, Richardson JS. Kinemages: simple macromolecular graphics for interactive teaching and publication. Trends Biochem Sci. 1994;19(3):135-8. [DOI] [PubMed] [Google Scholar]
- 27.Richardson DC, Richardson JS. The kinemage: a tool for scientific communication. Protein Sci. 1992;1(1):3-9. [DOI] [PMC free article] [PubMed] [Google Scholar]
- 28.Powers T, Changchien L-M, Craven GR, Noller HF. Probing the assembly of the 3′ major domain of 16S ribosomal RNA. J Molec Biol. 1988;200:309-19. [DOI] [PubMed] [Google Scholar]
- 29.Musen M, Combs DM, Walton JD, Shortliffe EH, Fagan LM. OPAL: toward the computer-aided design of oncology advice systems. Proc 10th Annu Symp Comput Appl Med Care. 1986:43-52.
- 30.DeMarco T. Structured Analysis and System Specification. Englewood Cliffs, N.J.: Prentice-Hall, 1979.
- 31.Bussler C. Metadata in workflow management systems. In: Coyne B, Colucci J, Musick R, Miller C, Jones M, Kobler B (eds). Proceedings of the 2nd IEEE Metadata Conference. Silver Spring, Md.: IEEE, 1997.
- 32.Lee J, Gruninger M, Jin Y, et al. The process interchange format and framework. Knowledge Eng Rev. 1998;13(1):91-120. [Google Scholar]
- 33.[No reference 33.]
- 34.Peterson JL. Petri Net Theory and the Modeling of Systems. Englewood Cliffs, N.J.: Prentice-Hall; 1981.
- 35.Karp PD, Paley SM. Knowledge representation in the large. In: Proceedings of the 1995 International Joint Conference on Artificial Intelligence. 1995:751-8.
- 36.Minsky M. A framework for representing knowledge. In: Brachman RJ, Levesque HJ (eds). Readings in Knowledge Representation. Los Altos, Calif.: Morgan Kaufmann, 1985.
- 37.Russell S, Norvig P. Artificial Intelligence: A Modern Approach. Englewood Cliffs, N.J.: Prentice-Hall, 1995.
- 38.Bailey RW. Human Error in Computer Systems. Englewood Cliffs, N.J.: Prentice-Hall, 1983.
- 39.Bada MA, Altman RB. Computational modeling of structured experimental data. Methods Enzymol, in press. Also published in Methods in RNA-Ligand Interactions, in press.
- 40.Baldonado M, Chang K, Gravano L, Paepcke A. Stanford Digital Library Metadata architecture. In: Stanford Digital Library Project.
- 41.Thiele H. The Dublin Core and Warwick framework: a review of the literature. D-Lib Magazine [online magazine]. Jan 1998. Available at: http://www.dlib.org/dlib/january98/01thiele.html. Accessed Jun 14, 1999.
- 42.Weibel S, Iannella R, Cathro W. The Fourth Dublin Core Metadata Workshop report. D-Lib Magazine [online magazine]. Jun 1997. Available at: http://www.dlib.org/dlib/june97/metadata/06weibel.html. Accessed Jun 14, 1999.
- 43.Guha RV, Bray T. Meta Content Framework Using XML. 1997. Available at: http://www.w3.org/TR/NOTE-MCFXML. Accessed May 15, 1998.
- 44.Stitt S, Nyquist M, Frondorf A. Development of a Metadata Content Standard for Biological Resource Data: National Biological Information Infrastructure Draft Metadata Standard. In: Coyne R, Colucci J, Miller C, et al. (eds). Proceedings of the 1st IEEE Metadata Conference. Silver Spring, Md.: IEEE, 1996.
- 45.Green S. Metadata for units of measure in social science databases. Int J Digital Libraries. 1997;1:161-75. [Google Scholar]
- 46.Middleton, B, Shwe M, Heckerman D, et al. Probabilistic diagnosis using a reformulation of the INTERNIST-1/QMR knowledge base, part II: evaluation of diagnostic performance. Methods Inf Med. 1991;30:256-67. [PubMed] [Google Scholar]
- 47.Heckerman DE, Horvitz EJ, Nathwani BN. Toward Normative Expert Systems, part I: The Pathfinder Project. Methods Inf Med. 1992;31:90-105. [PubMed] [Google Scholar]
- 48.Heckerman DE, Nathwani BN. Toward Normative Expert Systems, part II: probability-based representations for efficient knowledge acquisition and inference. Methods Inf Med. 1992;31:106-16. [PubMed] [Google Scholar]
- 49.Cooper G. NESTOR: A Computer-Based Medical Diagnostic Aid that Integrates Causal and Probabilistic Knowledge. Stanford, Calif.: Stanford University, 1984.
- 50.Pearl J. Probabilistic Reasoning in Intelligent Systems: Networks of Plausible Inference. San Mateo, Calif.: Morgan Kaufman, 1988.
- 51.Altman RB, Abernethy NF, Chen RO. Standardized representations of the literature: combining diverse sources of ribosomal data. In: Gassterland T, Karp P, Karplus K, Ouzounis C, Sander C, Valencia A (eds). Proceedings of the 5th International Conference on Intelligent Systems for Molecular Biology. Menlo Park, Calif.: AAAI Press, 1997:15-24. [PubMed]
- 52.Euzenat J, Chemla C, Jacq B. A knowledge base for D. Melanogaster gene interactions involved in pattern formation. In: Gassterland T, Karp P, Karplus K, Ouzounis C, Sander C, Valencia A (eds). Proceedings of the 5th International Conference on Intelligent Systems for Molecular Biology. Menlo Park, Calif.: AAAI Press, 1997. [PubMed]
- 53.Miller RA, Masarie FEJ. The demise of the “Greek Oracle” model for medical diagnostic systems. Methods Inf Med. 1990;29:1-2. [PubMed] [Google Scholar]
- 54.MSBN: Microsoft Bayes Networks, executable version 1.001. DLL version: Microsoft MSBN32 API Library 1.0.1.7. Redmon, Wash.: Microsoft Corp., 1998.