Abstract
Glioblastoma multiforme is the most common form of intracranial malignancy in humans, and is characterized by aggressive tumor growth, tissue invasion and neurodegenerative properties. The present study investigated the expression status of tight junction associated Claudin 1 (CLDN1), Claudin 5 (CLDN5) and Adheren junction associated β-catenin genes in the light of their critical role in the progression of both low- and high-grade human gliomas. Using quantitative PCR and Western blot methods the mRNA and protein status of CLDN1, CLDN5 and β-catenin genes were studied in a total of 25 human gliomas of World Health Organization (WHO) grades I-IV, non-cancerous control brain tissues and their corresponding model cell lines (C6, U373, U118, T98 and U87MG). Quantitative analysis of the transcript and protein expression data showed that CLDN1 and CLDN5 were significantly down regulated (p=<0.001) in tumors of all four grades and model cell lines. This decrease in expression pattern was in accordance with the increasing grade of the tumor. A 4-fold stronger reduction of CLDN1 when compared to CLDN5 was evident in high-grade tumors. Interestingly, β-catenin was up regulated in all tumor types we studied (p=<0.005). Our findings, suggest that down regulated CLDN1 and CLDN5 genes have potential relevance in relation to the progression of glioblastoma multiforme. Hence, their therapeutic targeting may provide both insight and leads to control the cellular proliferation and subsequent invasiveness among affected individuals.
Keywords: Adheren junction, Claudin 1 (CLDN1), Claudin 5 (CLDN5), β-catenin, Glioma, Glioblastoma multiforme (GBM) and Tight junction (TJ)
1. Introduction
Glioblastoma multiforme (GBM) is the most common and aggressive malignant tumor of human brain. Besides its primary occurrence within the cerebral hemispheres, GBM is occasionally reported to occur in brain stem, cerebellum and spinal cord. It accounts for 52% of all astrocytic brain tumors and 20% of all intracranial tumors. The key histopathological features exhibited by GBM include necrotizing tissue, pronounced hypercellularity, hyperplastic blood vessels and excessive vascularisation [1–3]. Aggressive tumor growth, tissue invasion and neurodegeneration are the hallmark properties of these tumors. GBM constitutes a common cause of cancer related deaths in children of 3 to 12 years and adults of 50 to 70 years old, worldwide. Despite the conventional treatments that include surgical debulking, radiotherapy and adjuvant chemotherapies for these tumors, prognostic outcomes evaluated by median survival still remains <1 year for the majority of patients. The specific molecular mechanism(s) underlying the pathogenesis of gliomas are yet to be fully elucidated. However, tracking cellular and molecular alterations may enable us to better understand disease biology and may also aid in identifying potential molecular therapeutic targets.
Neurodegeneration is considered a key hallmark of malignant glioma, along with uncontrolled cell proliferation and tissue invasion. In the past, select studies have shown that glioma cells exhibit glutamate excitotoxicity in brain tumors that induces neuronal cell death of surrounding normal brain tissues [4, 5]. Another study reported that an up regulation of astrocyte elevated gene (AEG)-1 in glioma reduced Anti-Excitatory Amino Acid Transporter 2 (EEAT2) protein expression, which leads to neurodegeneration due to excessive glutamate [6].
The Claudin (CLDN) family proteins are essential in the formation of tight junctions (TJs) in epithelial and endothelial cells. It has been observed that approximately 24 proteins are involved in the formation of TJs, which have a critical role in regulating paracellular transport and the maintenance of cell polarity. It is believed that various CLDN family members can confer different properties to epithelial cell permeability and account for the selective variability of different cellular barriers. The strength of a TJ is determined, in large part, by the combination of CLDN proteins expressed in a particular tissue. Recent observations have demonstrated that mutations within CLDN genes are responsible for various diseases, which include neonatal sclerosis cholangitis (CLDN1) [7–9], nonsyndromic recessive deafness (CLDN14) [10–12] and familial hypomagnesemia (CLDN16) [13, 14].
Recent knowledge indicates that CLDNs are able to form TJs in the absence of occludins. Upon fibroblasts transfection with CLDN1 and CLDN2, CLDN1 forms a TJ with the protoplasmic face (P-face), whereas CLDN2 forms exocytoplasmic fracture face (E- face) [15]. Expression of CLDN1 and CLDN5 has been reported within the brain [16–18], whereas CLDN11 expression has only been described in oligodendrocytes [19]. Both CLDN1 and CLDN5 are the important elements of blood-brain barrier (BBB) endothelial TJs. Earlier reports suggested that the particle association with the P-/E face in endothelial cells is believed to be a combination of CLDN1 and CLDN5 [64]. Furthermore, several studies have reported that CLDN gene expression is frequently altered in various cancers of the lung, pancreas, brain, breast and prostate [20– 27]. For example, the down regulation of CLDN1 and CLDN7 have been observed in breast cancer, prostate cancer and esophagus cancer, respectively [28– 30]. A loss of CLDN1 and CLDN5 has been described in blood vessels of GBM [31], and a significant reduction of CLDN1 expression associated with BBB changes in West Nile virus infected encephalitis [32]. Finally, down regulation of CLDN5 has been associated with BBB leakage in both mouse brain tissue with leukemia [33] and rat brain glioma [34].
Disruption of TJs causes the loss of cohesion, invasiveness and lack of differentiation which ultimately leads to the tumorigenesis in epithelial cells. The phosphorylation of CLDN family proteins has been identified as to be responsible for disruption of TJs in cancer [35]. Interestingly up regulation of CLDN genes was also observed in some cancers. For example CLDN3 and CLDN4 are over expressed in ovarian cancer [35]. Additionally, CLDN3 and CLDN4 are reported up regulated in breast, prostate and pancreatic cancers [36– 39]. In nasopharyngeal cancers, increased CLDN1 expression was found to confer cell death [40]. Immunohistochemical analysis revealed a significant association between high CLDN1 expression and basal-like breast cancer [41]. TJs are an integral component of epithelial junction complexes, which play a vital role in maintaining epithelial integrity and cell polarity. Disruption of TJs is not only a hallmark of epithelial cancer development and malignant expression but also associated with a number of pathological conditions such as kidney disorders, inflammatory bowel disease, pulmonary edema, diarrhea and jaundice [42– 45].
Adheren junctions are known to be crucial for the development and maintenance of epithelial and endothelial TJs [46– 49]. Adheren junctions of endothelial cells are composed of cadherins and catenins, both of which in conjunction with TJ proteins participate in the maintenance of paracellular barriers. The catenins include β-catenin and plakoglobin, and both of these belong to the Armadillo protein family that is characterized by multiple repeats of a 42-amino acid sequence named the Armadillo or arm repeat. These catenins mediate the linkage of transmembraneous cadherins to the cytoskeleton to form a functional adheren junction that plays an important role in intracellular signal transduction [50, 51]. To achieve these functions, β-catenin present in cytoplasm is translocated into the nucleus and generates a complex with lymphoid enhancer factor-1/T-cell factor (LEF-1/TCF) transcription factors. The tumor suppressor genes adenomatous polyposis coli (APC) and glycogen synthase kinase 3β (GSK) regulate β catenin expression and its degradation [52, 53]. In addition, catenins also act as transcriptional factors in several developmental processes in humans [54–56]. Furthermore, studies have shown that TJ opening can occur consequent to removal of extracellular Ca2+ from adheren junctions [57]. The abundance of β-catenin in tumor microvessels can alter TJ proteins and the morphology of undifferentiated microvessels within brain tumors that, in turn, can impact the blood brain characteristics [31].
Owing to the importance of CLDNs and adheren junction proteins in the progression of various malignant tumors, and the lack of such data on gliomas, we investigated the transcript and protein expression of CLDN1, CLDN5 and β-catenin in human gliomas of grades I–IV to evaluate whether there are molecular differences between high- and low-grade gliomas. As a cross validation these findings in human gliomas were compared with widely used immortal glioma cell culture lines. Our studies demonstrated a positive correlation between the down regulation of CLDN1 and CLDN5 and the up regulation of β-catenin in both patient samples and model cell cultures.
2. Materials and Methods
2.1 Patient samples
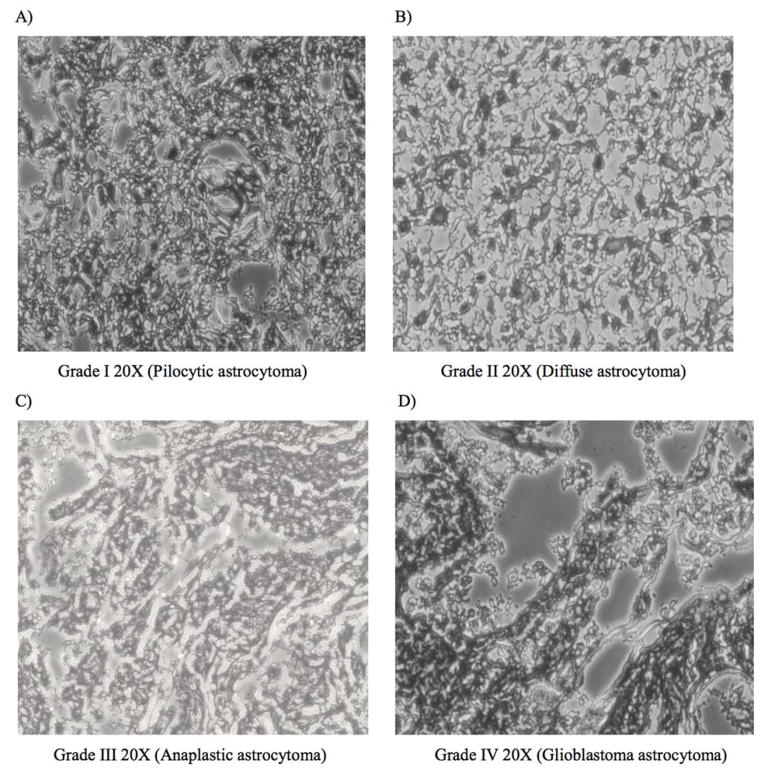
A total of 25 gliomas were collected from patients while they underwent neurosurgical resection of their tumors at the Neurosurgery Department of the Krishna Institute of Medical Sciences (KIMS), Hyderabad, India. Glioma tumor typing was performed by the Pathology Department, KIMS, as per the WHO classification based on histopathological characteristics [Figure 1]. Of the gliomas biopsies obtained, 2 were of Pilocytic astrocytomas (grade I), 7 were of Diffuse astrocytomas (grade II), 4 were of Anaplastic astrocytomas (grade III) and 12 were of GBM (grade IV) type. Additionally, biopsies of non-cancerous brain tissues of 3 epilepsy patients who underwent surgical resection for the treatment of medically intractable epilepsy were used as control tissues [58]. All tissues were immediately snap frozen in liquid nitrogen and stored at −80°c until they were further processed for RNA and protein isolation. Protocols followed for collecting patient samples and consent was in accordance to the approved guidelines of the KIMS institutional ethics committee.
Figure 1.
Hematoxylin and Eosin staining of low- and high-grade glioma tissues. Low grade glioma A Pilocytic astrocytoma, WHO grade I (20x) and B Diffuse astrocytoma, WHO grade II (20X), and high grade gliomas C. Anaplastic astrocytoma WHO grade III (20x) and D. Glioblastoma multiforme WHO grade IV (20x)
2.2 Glioma Cell cultures
The malignant glioma cell lines comprising C6 (low-grade), U373, U118, T98MG, U87MG (high-grade) and the control non-CNS cell line ECV304 were used in the current study, and were obtained from the cell line repository of the National Centre for Cell Science (NCCS), India, and from American Type Culture Collection (ATCC). All cell lines were maintained in Dulbecco’s modified Eagle’s media [DMEM] with supplementations of 10% heat-inactivated fetal bovine serum, 2 mM L-glutamine, 50 U/mL penicillin, and 50 μg/mL streptomycin. All were grown up to 80% confluence in 75 cm2 culture flasks at 37°C in a humidified incubator supplied with 5% CO2. Cell line sub culturing was performed for 48 hours with a cell scraper, centrifuging and resuspending in fresh DMEM. Finally, the cultured cells were scraped from culture flasks and single cell suspensions were prepared in TRIZOL reagent (Invitrogen) by passing pieces of cells through series of sequentially smaller hypodermic needles (22–30 gauge). Cells were stored at −80°c until processed further for RNA and protein isolations.
2.3 Cell viability assays
The viability of cultured cells was determined by a standard trypan blue exclusion test. In brief, 15 μl of trypan blue solution was added to 15 μl of cell suspension containing approximately 2×10⁴ cells at logarithmic growth phase. Cell viability was evaluated using a hemocytometer to aid quantify viable cell number.
2.4 RNA extractions and Real-time polymerase chain reaction analysis
Total RNA from biopsies (approximately 50 mg) or cultured cells (approximately 106 cells) was isolated using TRIZOL reagent (Invitrogen) according to the manufacturer’s recommendations. After DNaseI treatment, all RNAs were reverse-transcribed into cDNAs with Superscript II reverse transcriptase (Invitrogen, USA) and oligo (dT) primers in accordance to the manufacturer’s protocol instructions. The specific mRNA quantities of CLDN1, CLDN5 and β-catenin in all cDNA samples were determined by Real-time reverse transcriptase (RT)-polymerase chain reaction (PCR) method using ABI Prism 7000 Sequence Detection System. Each 25 μl reaction mixture contained 12.5 μl of 2X Power SYBR Green PCR Master Mix (Applied Biosystems), 5 μl of cDNA, and 10 pm primer pairs (listed in Table 1). Oligonucleotide primers for CLDN1, CLDN5 and β-catenin were selected from published reports [59]. To counterbalance variations in PCR efficiency, standard curve analysis with a serially diluted pool of cDNAs was undertaken for primer sets in each reaction set up. PCR reaction conditions included 2 mins at 95°C for initial denaturing, then 40 cycles of 95°C for 20 s, 63°C for 30 s, and 72°C for 30s annealing, followed by melting analyses from 55°C to 95°C. The real time PCR reactions of CLDN1, CLDN5 and β-catenin for each sample were performed in triplicate in 96-well plates. Melting curves were checked to verify the melting temperatures of PCR amplicons. Additionally, PCR amplicons from the real-time master plate were subjected to electrophoresis on 2% agarose gel to confirm the success of the PCR reaction. GAPDH was used as an endogenous control gene. The relative expression levels for CLDN1, CLDN5 and β-catenin were calculated according to the ΔΔCt approximation method, by normalizing estimates of CLDN1, CLDN5 and β-catenin to GAPDH levels [XN=2(−Δ Ct), where ΔCt=(Ct of CLDN1, CLDN5 or β-catenin-Ct of GAPDH)]. The normalized levels of the transcripts in gliomas were then expressed in the form of 2(−ΔΔCt) [60].
Table 1.
Primer sequences
| Gene | Primer sequence | Product Size |
|---|---|---|
|
| ||
| CLDN1-FP | 5′-GATGAGGTGCAGAAGATGAGG-3′ | 200 |
| CLDN1-RP | 5′-AGAAGGCAGAGAGAAGCAGC-3′ | |
| CLDN5-FP | 5′-TTCGCCAACATTGTCGTCC-5′ | 232 |
| CLDN5-RP | 5′-TCTTCTTGTCGTAGTCGCCG-3′ | |
| β-catenin-FP | 5′-GTGCTATCTGTCTGCTCTAGTA-3′ | 152 |
| β-catenin-RP | 5′-CTTCCTGTTTAGTTGCAGCATC-3′ | |
| GAPDH-FP | 5′-TTCGTACCTGGCATTGACTGG-3′ | 225 |
| GAPDH-RP | 5′-GAAGGTGAAGGTCGGAGT-3′ | |
2.5 Preparation of soluble glioma tumor tissue lysates
All frozen tumor tissues were washed twice with ice-cold phosphate buffered saline (PBS) and scraped into Radio-Immunoprecipitation Assay (RIPA) buffer. After sonication for 2–3 min, insoluble material was separated by centrifuging at 14000g for 15 min at 4°C. The resulting supernatant was collected as a whole cell lysate and frozen at −80°C before it was used for further protein analysis. Quantification of protein concentrations in cell lysates were determined by direct UV measurement at 280 nm using a NanoVue™ Spectrophotometer.
2.6 Western immunoblotting analysis
Tumor tissue lysates were subjected to electrophoresis on SDS-polyacrylamide gels and transferred onto nitrocellulose papers at 100V and 4°C, for 1.5 h using Towbin buffer. After blocking the nitro cellulose paper in non-fat dry milk (5%) in Tris Buffered Saline (TBS) (10mM Tris (pH 7.5), 150 mM NaCl) for 1 h at room temperature, the membrane was incubated with primary antibody CLDN1(1:100), CLDN5 (1:100) and β-catenin (1:200) overnight. The blot was thereafter incubated with a secondary antibody, i.e. goat anti-mouse IgG (dilution rate of 1:2000) conjugated to alkaline phosphatase (ALP), for 1–2 h at room temperature. Before and after incubation of blots with secondary antibodies, each blot was washed twice with TBS, 0.05% Tween 20 and once more in TBS. Immunoreactivity was determined by incubating the blots with BCIP (5-bromo-4-chloro-3-indolyl-phosphate) - NBT (nitro blue tetrazolium) chromagen solution.
2.7 Immunofluorescence Analysis
The resected tissue samples were prepared for immunofluorescence analysis by cutting them into small halves and they were subjected to subsequent fixation for 3 h at 4°C in 2% paraformaldehyde plus 0.2% glutaraldehyde solution. All the specimens were washed with PBS three times before they were sectioned by microtome (Leika) and subsequently layered onto slides. Thin tissue sections were permeabilzed using acetone and methanol mixture, which was followed by overnight primary antibody incubation. Single immunolabeling was carried out with CLDN1 (diluted 1:20 in blocking buffer BB: 1xPBS, 1% bovine serum albumin) and CLDN5 (diluted 1:50 in BB). Further sections were incubated with secondary antibody rabbit anti-mouse conjugated to FITC (1:200). Before and after incubating the tissue sections with secondary antibodies, the tissues were thoroughly washed with PBS, 0.05% Tween 20. After DAPI staining, immunofluorescence images were taken with an Immunofluorescence microscope camera (Olympus).
2.8 Statistical analysis
All continuous variable data derived from the sets of gene expression experiments are presented as mean and standard deviation values. The relative differences between the expression ratios of transcripts were compared by use of a standard two-tailed t-test using InStat Software (GraphPad, San Diego, CA). A statistically significant difference between the expression of individual transcripts is reported when a p value <0.05 was obtained.
3. Results
3.1 Down regulation of CLDN1 in glioma patient samples and glioma cell lines
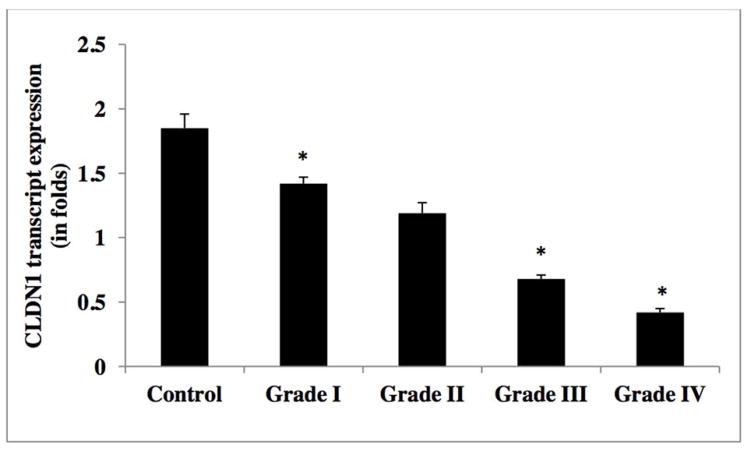
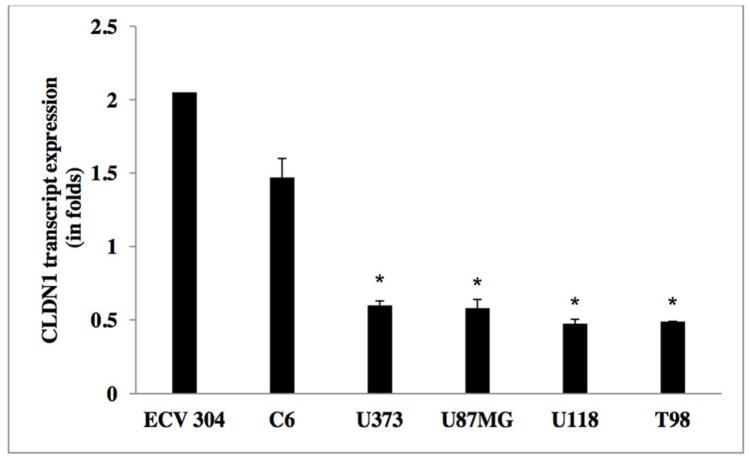
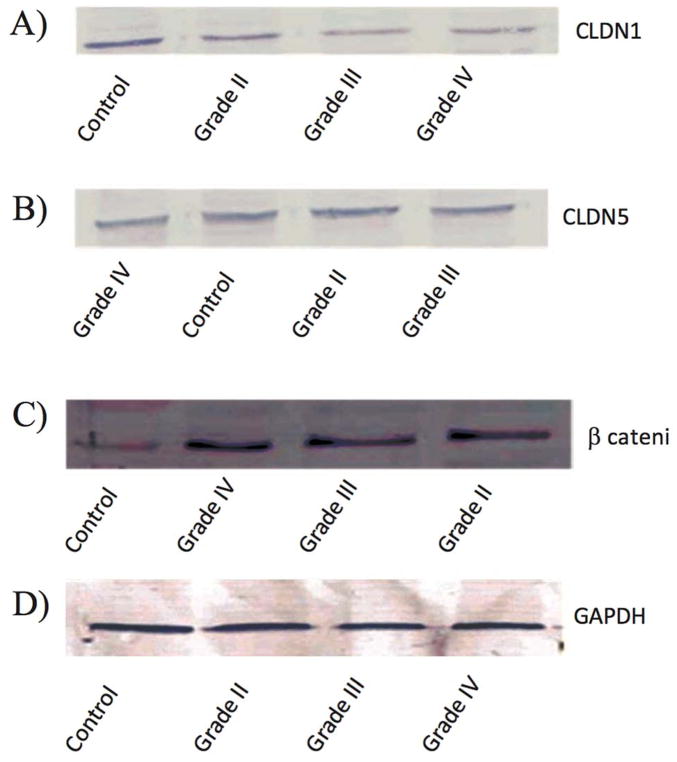
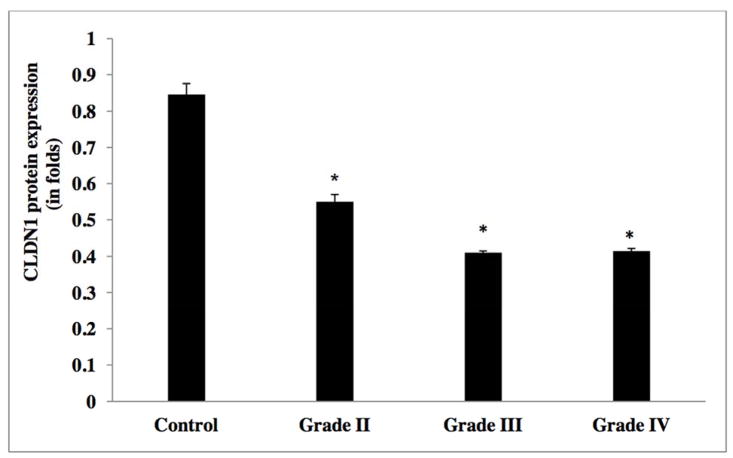
In order to evaluate the CLDN1 expression status across tumors, we analyzed the transcript expression levels of CLDN1 in our human glioma samples. Figure 2 reveals that CLDN1 expression is significantly decreased in gliomas of all four grades. Specifically, higher grade tumors (e.g., grade IV GBM) showed a 4-fold reduction and grade III anaplastic astrocytomas a greater than two-fold reduction, as compared to tumors of lower grade and control samples (Table 2a). A significant down regulation of CLDN1 expression was also evident in glioma cell lines of higher grade, of more than three-fold in U373, U87MG, U118 and T98, as compared to their lower grade counterpart and the ECV 304 control cell line [Figure 5 and Table 2b]. Western blot analysis of protein lysates from low- (I and II) and high-grade (III and IV) tumor tissues was performed to evaluate correlations between transcripts and protein expression levels. Notably, Western blot analysis results similarly demonstrated a decreased expression pattern of CLDN1 protein in grade IV (GBM) and grade III (anaplastic astrocytomas) tumors versus low-grade diffuse astrocytomas and epilepsy control tissue [Figures 8a&9, and Table 2c].
Figure 2.
Transcript expression of CLDN1 in human glioma tumors grades (I–IV)
Table 2a.
CLDN1 mRNA expression levels in glioma tumor grades.
| WHO Grade | Mean (SD) |
|---|---|
| Control | 1.85±0.11 |
| I | 1.42±0.05 |
| II | 1.19±0.082 |
| III | 0.68±0.03 |
| IV | 0.42±0.03 |
Figure 5.
Transcript expression of CLDN1 in human glioma cell lines
Table 2b.
CLDN1 protein expression levels in glioma tumor grades.
| WHO Grade | Mean (SD) |
|---|---|
| Control | 0.8465±0.03 |
| II | 0.55±0.02 |
| III | 0.41 ±0.005 |
| IV | 0.415±0.007 |
Figure 8.
Western blot results of CLDN1, CLDN5 and β-catenin in glioma tumor grades of I–IV
Figure 9.
Protein expression of CLDN1 in human glioma tumors grades (I–IV)
Table 2c.
CLDN1 mRNA expression levels in glioma cell lines.
| WHO Grade | Mean (SD) |
|---|---|
| ECV 304 | 2.05±0.11 |
| C6 | 1.47±0.13 |
| U373 | 0.60 ± 0.03 |
| U87MG | 0.58±0.06 |
| U118 | 0.475± 0.03 |
| T98 | 0.489± 0.002 |
Evaluation of the microvascular expression of CLDN1 in tumor tissues and non neoplastic tissues was performed by Immunofluorescence microscopy. Whereas CLDN1 expression was evident in control epilepsy tissue, its expression was not detected in high-grade tumors (GBM). In synopsis, there was concordance between the results obtained by real time PCR and Western blot analysis of glioma tumors as well as cell lines supporting a down regulated expression of CLDN1, and this decreased expression significantly associated with the high-grade of the glioma. Moreover, this result was further supported by Immunofluorescence data in which decreased expression of CLDN1 was evident in high-grade gliomas.
3.2 CLDN5 is down regulated in glioma patient samples and glioma cell lines
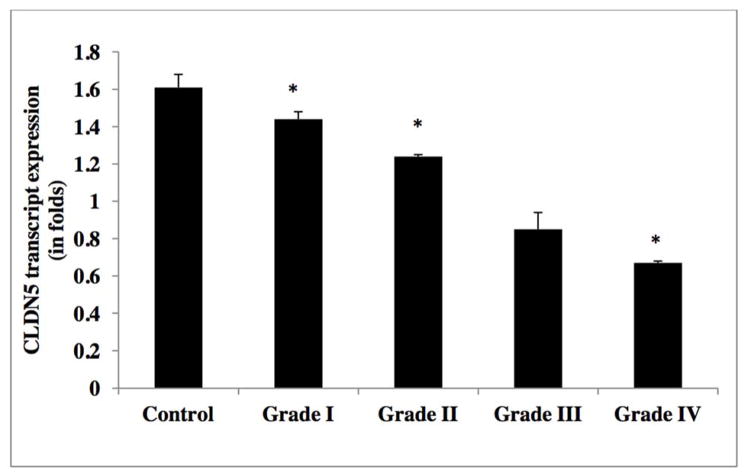
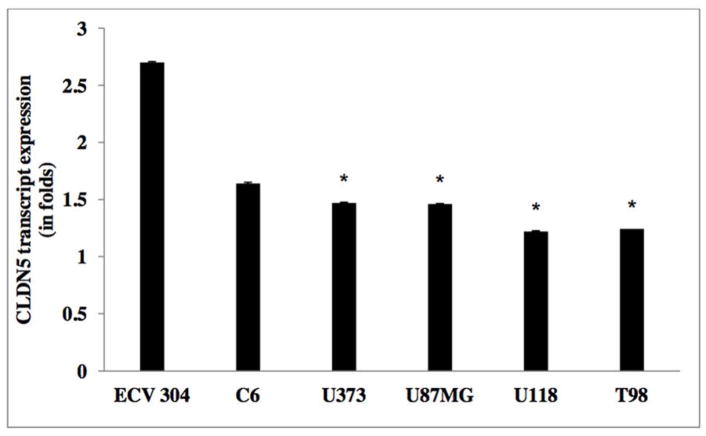
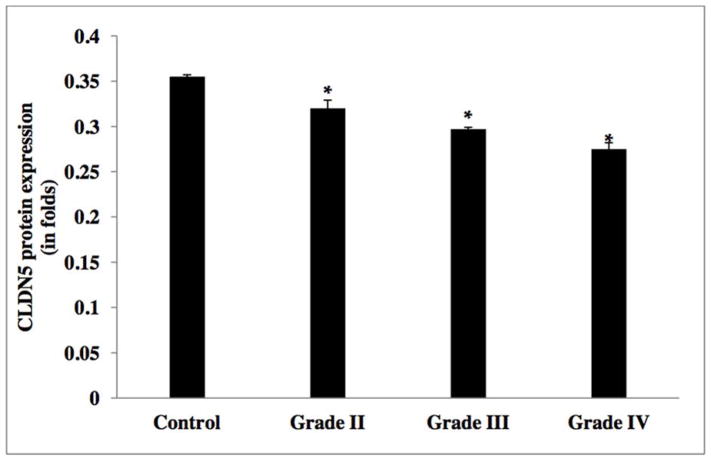
As illustrated in Figure 3, CLDN5 expression was significantly reduced by in excess of two-fold in grade IV GBM, two-fold in grade III anaplastic astrocytoma, one-fold in grade II diffuse astrocytoma, but not in grade I pilocytic astrocytoma, as compared to control non-neoplastic samples (Table 2d). Inter-tumor differences in CLDN5 expression revealed that m-RNA levels were down regulated by approximately 50% and 10% in grade IV, as compared to grade II and grade III gliomas, respectively. In support to this finding, experiments on glioma cell lines also indicated a down regulation of CLDN5 in higher grade glioma cell lines (i.e. U373, U118, T98 and U87MG), as compared to lower grade C6 glioma cell line and the control cell line ECV 304 [Figure 6 and Table 2e]. Results from Western blot analysis demonstrated a decline in CLDN5 protein expression patterns in high grade IV GBMs and grade III anaplastic astrocytomas versus lower grade II diffuse astrocytoma and epilepsy control tissue [Figure 8b &10, and Table 2f]. In control samples, an intense staining pattern of CLDN5 was observed at endothelial cell borders whereas in GBM microvessels it was undetectable. These results indicate that a reduction in CLDN5 expression is associated with progressively high-grade gliomas.
Figure 3.
Transcript expression of CLDN5 in human glioma tumors grades (I–IV)
Table 2d.
CLDN5 mRNA expression levels in glioma tumor grades.
| WHO Grade | Mean (SD) |
|---|---|
| Control | 1.61 ±0.077 |
| I | 1.44±0.04 |
| II | 1.24±0.01 |
| III | 0.85 ±0.09 |
| IV | 0.67±0.01 |
Figure 6.
Transcript expression of CLDN5 in human glioma cell lines
Table 2e.
CLDN5 protein expression levels in glioma tumor grades.
| WHO Grade | Mean (SD) |
|---|---|
| Control | 0.355±0.002 |
| II | 0.32±0.009 |
| III | 0.297±0.002 |
| IV | 0.275±0.007 |
Figure 10.
Transcript expression of CLDN5 in human glioma tumors grades (I–IV)
Table 2f.
CLDN5 mRNA expression levels in glioma cell lines.
| WHO Grade | Mean (SD) |
|---|---|
| ECV 304 | 2.7 |
| C6 | 1.64±0.007 |
| U373 | 1.47±0.01 |
| U87MG | 1.46±0.005 |
| U118 | 1.22±0.004 |
| T98 | 1.242±0.006 |
3.3 Increased β-catenin mRNA expression in glioma patient samples and glioma cell lines
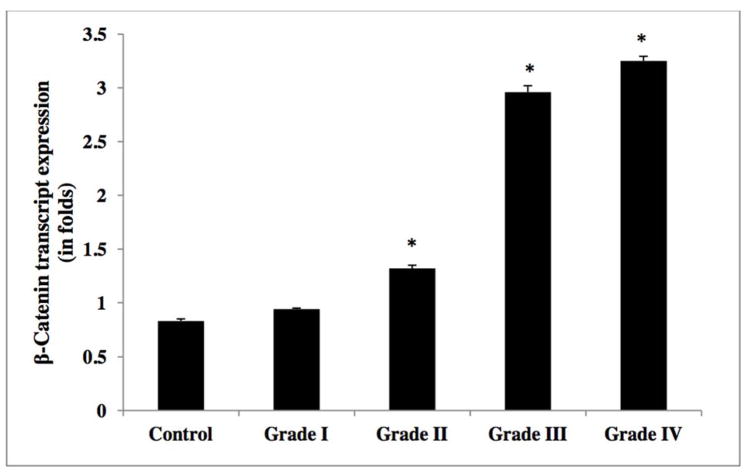
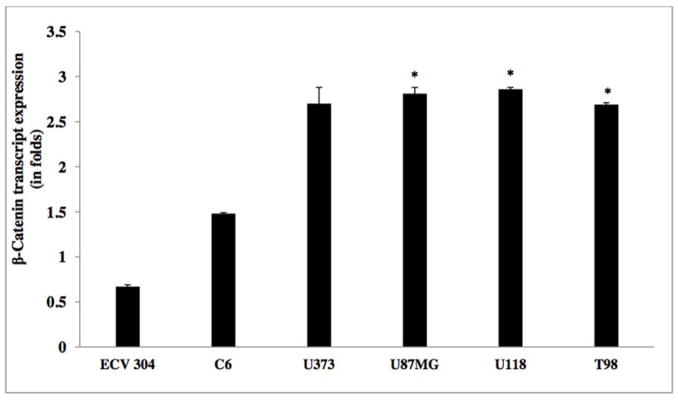
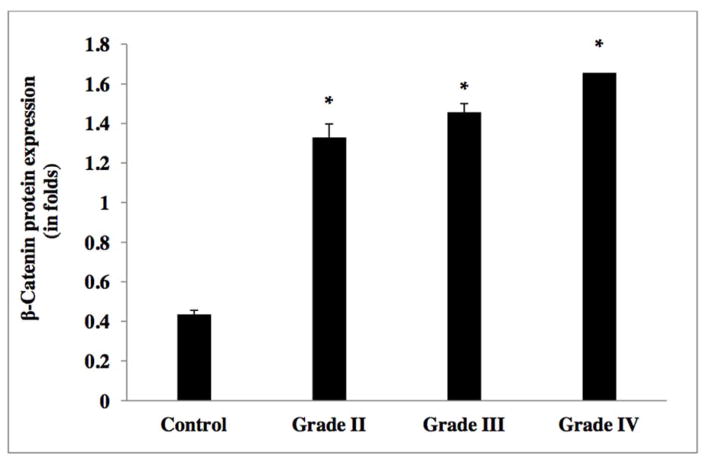
The relative transcript expression ratio of the β-catenin gene was significantly increased in relation to increased glioma grade [Figure 4]. High-grade (IV) GBM and anaplastic astrocytoma (grade III) showed an elevated β-catenin expression of more than three-fold, as compared to lower grade tumors (diffuse astrocytoma (grade II) and grade I pilocytic astrocytoma) and control tissue samples (Table 2g). β-catenin transcript analysis in glioma cell lines demonstrated a 4-fold elevated expression in high-grade tumor cell lines (U373, U118, T98 and U87MG), as compared to lower grade C6 glioma cell line and control the non-CNS ECV 304 cell line [Figure 7 and Table 2h]. Western blot analysis yielded similar results with increased β-catenin expression of in excess of three-fold in high-grade (GBM (IV) and anaplastic astrocytomas (III)), compared to grade II diffuse astrocytoma and non-neoplastic controls [Figure 8c & 11, and Table 2i].
Figure 4.
Transcript expression of Beta-catenin (or β-catenin) in human glioma tumors grades (I–IV)
Table 2g.
β-catenin mRNA expression levels in glioma tumor grades.
| WHO Grade | Mean (SD) |
|---|---|
| Control | 0.83±0.01 |
| I | 0.94±0.01 |
| II | 1.32±0.02 |
| III | 2.96 ±0.06 |
| IV | 3.25±0.043 |
Figure 7.
Transcript expression of Beta-catenin in human glioma cell lines (I–IV)
Table 2h.
β-catenin protein expression levels in glioma tumor grades.
| WHO Grade | Mean (SD) |
|---|---|
| Control | 0.355±0.002 |
| II | 0.32±0.009 |
| III | 0.297±0.002 |
| IV | 0.275±0.007 |
Figure 11.
Protein expression of Beta-catenin (or β-catenin) in human glioma tumors grades (I–IV)
Table 2i.
β catenin mRNA expression levels in glioma cell lines.
| WHO Grade | Mean (SD) |
|---|---|
| ECV 304 | 0.67±0.02 |
| C6 | 1.48±0.01 |
| U373 | 2.70±0.181 |
| U87MG | 2.81±0.07 |
| U118 | 2.86±0.02 |
| T98 | 2.69±0.02 |
In synopsis, results of Western blot, real-time PCR and Immunofluorescence analyses correlated well with one another, demonstrating alike changes in both amount and direction. CLDN1 was down regulated and demonstrated marked differences between high-grade tumors (III, IV) and high grade cell lines as compared to their counterpart low-grade tumors, cell lines and controls. CLDN5 was found down regulated, but with smaller differences evident between high-grade tumors and cell lines versus lower grade ones and controls. By contrast, the expression of β-catenin progressively increased from low- to high-grade gliomas, as compared to control samples.
4. Discussion
In the present study we examined the expression pattern of the TJ proteins CLDN1, CLDN5 and adheren junction protein β-catenin in different grades of human glioma samples and from low- and high-grade human glioma cell lines. This study was undertaken to evaluate the biological significance of altered TJ protein expression in glioma progression. Several studies have defined a role for CLDN in forming TJs [61], conferring ionic selectivity [62] and functioning as a barrier [63]. In this regard, Morita and colleagues [64] demonstrated that occludin along with CLDN1 and CLDN5 are the important components of blood-brain barrier well over a decade ago. Despite this, there are relatively few published reports characterizing the expression of CLDNs in gliomas, albeit they are differentiated and often imaged in brain consequent to their altered blood-brain barrier properties that additionally can impact their response to treatment regimens [65–67].
Our data demonstrated decreased CLDN1 expression in all 12 GBM (grade IV) samples and 4 anaplastic astrocytoma (grade III) tumor samples, while showing its increased expression in 2 pilocytic astrocytoma samples (grade I) and 7 diffuse astrocytoma (grade II) tumor samples. Interestingly, the CLDN5 expression pattern was similar to the status of CLDN1 expression, as evident in high- (IV and III) and low-grade (II and I) samples. Recent studies have shown CLDNs as candidate markers for detection, prognostic evaluation and therapy of various human cancers [68]. Our studies can be compared to those of Liebner and colleagues [31], who reported the frequent loss of CLDN1 in GBM, compared to normal brain, but no such down regulation was evident for CLDN5 expression [31]. Ishihara and colleagues [69] studied 24 cases of low- and high-grade gliomas, and a loss of CLDN1 expression was observed in high-grade ones. Our results are in accord with these studies [31, 69] in relation to high-grade (IV, III) glioma patient tumor samples, and extend them in glioma cell lines demonstrating reduced CLDN1 expression levels versus low-grade pilocytic astrocytoma (I) and diffuse astrocytomas (II) tumors and control tissue. A reduction in CLDN1 expression can be attributed to the altered cellular proliferation and differentiation evident within the high-grade gliomas, potentially correlating with disease progression in patients. It may additionally relate to local proinflammatory cytokine levels [70] as reductions in CLDN1 have also been reported in hepatitis C [71]. Interestingly, the ectopic expression of CLDN-1 in mice prevents blood-brain barrier loss of permeability in the EAE model of multiple sclerosis, compared to control littermates [72].
Several studies have shown that a reduced expression of certain CLDNs have a greater impact on tumor aggressiveness than others, even though differential expression of CLDN proteins are also observed in different tissues [58]. The loss of CLDN1 in higher grade breast cancer and the unchanged expression of CLDN3 and CLDN4 further support this observation [28]. Regardless of the cellular origin, it is now widely accepted that an alteration in CLDN expression can lead to tumorigenesis. Re-expression of CLDN1 in vitro leads to apoptosis in breast cancer spheroids by another mechanism [73]. Hence, although up- or down-regulation of certain CLDNs may have great impact in altering TJs and contributing to neoplastic processes, the specific molecular mechanism via which such processes occur are not yet clearly understood, but likely involve regulation at multiple levels including microRNAs [70, 74].
As previously discussed, in prostate, breast and thyroid cancers the prognostic value of a reduced expression of CLDN1 is already reported [29, 75, and 76]. A loss of CLDN1 expression has also reported in hepatocellular malignancy [77]. Surprisingly, the up regulation of CLDN1 leads to increased cell motility and invasiveness in squamous cell carcinomas and melanomas [78, 79]. The occurrence of epithelial-mesenchymal transition, an early step during cancer progression due to the alteration of TJ proteins, is already well supported [80, 81].
Liebner and colleagues [31] have reported a strong correlation between blood-brain barrier maturation and the differential expression of β-catenin and plakoglobin. In the case of tumor microvesssels, β-catenin expression is elevated whereas plakoglobin expression is reduced. In our study, real time PCR analysis yielded similar findings that β-catenin expression was markedly increased in high-grade tumors (III, IV) and had moderate expression in pilocytic astrocytoma (I) and diffuse astrocytoma (II) tumors. In accord with this, high-grade glioma cell lines exhibited significantly increased expression of β-catenin and moderate expression in their low-grade counterpart.
Gliomas are characterized by a resistance to chemotherapy and radiotherapy despite aggressive treatment, and a high morbidity and mortality. This is particularly true in the elderly population that has the greatest incidence rate of GBM, which additionally appears to be on the rise [82, 83]. Despite several available treatments in the form of surgery, chemotherapy and radiotherapy, patient survival rates for primary malignant brain tumors remain extremely low, only 12 to 15 months following a GBM diagnosis that can fall to 4 to 5 months in elderly patients [84– 86]. Our present study suggests that glioma progression associates with dysregulation of CLDN1 and CLDN5 genes. The discovery of CLDN alterations in GBM provides a pathophysiologic link between TJ proteins and glioma progression; whether or not one can take advantage of this to find novel therapeutics is an avenue worth pursuing.
5. Conclusion
The key finding in the current study is that down regulated levels of CLDN1 and CLDN5 associated with the progression of malignant gliomas, being more pronounced with increasing glioma grade. Furthermore, adheren junction protein β-catenin was significantly elevated; proportionally increasing from low- to high-grade tumors. In accord with this data from human tumors sample resections, results from immortal tumor cell lines provided similar changes that likewise associated with glioma aggressiveness. Further studies are required to assess the molecular mechanisms underpinning these changes in expression, and whether normalization of CLDN1, CLDN5 and β-catenin protein levels in gliomas might improve their responsiveness to radio- and chemotherapy.
Figure 12.
Immunofluorescence images of tight junction proteins CLDN1 and CLDN5 in microvessels of high grade glioma, GBM, and normal brain tissue.
Acknowledgments
We thank Dr. Ashutosh Kumar, University of Hyderabad, for guiding us in real time PCR analysis, Dr. T. Prasad, University of Hyderabad, for Immunofluorescence images and Dr. Arun Kumar, Center for Finger Printing and Diagnostics (CDFD), Hyderabad, for manuscript input and corrections. We sincerely thank to Mr. Mohammad Hameed Khan, Krishna Institute of Medical Sciences (KIMS), Hyderabad, for help in obtaining fresh tissue samples. These studies were supported in part by Gland Pharma Limited (HKK, NK) and KIMS (MP), Hyderabad, India; by the National Institute of Pathology (SARB) New Delhi, India; by the King Abdulaziz University (NAS), Jeddah, Kingdom of Saudi Arabia; and by the Intramural Research Program of the National Institute on Aging (NHG), Baltimore, MD, USA.
List of Abbreviations
- AEG-1
astrocyte elevated gene-1
- APC
Adenomatous polyposis coli
- BBB
Blood-brain barrier
- CLDN
Claudin
- EEAT2
Anti-Excitatory Amino Acid Transporter 2
- GBM
Glioblastoma multiforme
- GSK
Glycogen synthase kinase 3β
- LEF-1/TCF
Lymphoid enhancer factor-1/T-cell factor
- TJ
Tight Junction
Footnotes
Competing interests
The authors declare that they have no competing interests.
References
- 1.Bertossi M, Virgintino D, Maiorano E, Occhiogrosso M, Roncali L. Ultrastructural and morphometric investigation of human brain capillaries in normal and peritumoral tissues. Ultrastruct Pathol. 1997;21(1):41–49. doi: 10.3109/01913129709023246. [DOI] [PubMed] [Google Scholar]
- 2.Dinda AK, Sarkar C, Roy S, Kharbanda K, Mathur M, Khosla AK, Banerji AK. A transmission and scanning electron microscopic study of tumoral and peritumoral microblood vessels in human gliomas. J Neurooncol. 1993;16(2):149–158. doi: 10.1007/BF01324702. [DOI] [PubMed] [Google Scholar]
- 3.Hirano A, Matsui T. Vascular structures in brain tumors. Hum Pathol. 1975;6(5):611–621. doi: 10.1016/s0046-8177(75)80045-1. [DOI] [PubMed] [Google Scholar]
- 4.Rothstein JD. Paving new pathways. Nat Med. 2002;8:938–40. doi: 10.1038/nm0902-938. [DOI] [PubMed] [Google Scholar]
- 5.Sontheimer H. A role for glutamate in growth and invasion of primary brain tumors. J Neurochem. 2008;105(2):287–295. doi: 10.1111/j.1471-4159.2008.05301.x. [DOI] [PMC free article] [PubMed] [Google Scholar]
- 6.Lee SG, Kim K, Kegelman TP, Dash R, Das SK, Choi JK, Emdad L, Howlett EL, Jeon HY, Su ZZ, Yoo BK, Sarkar D, Kim SH, Kang DC, Fisher PB. AEG-1 promotes glioma-induced neurodegeneration by increasing glutamate excitotoxicity. Cancer Res. 2011;71(20):6514–6523. doi: 10.1158/0008-5472.CAN-11-0782. [DOI] [PMC free article] [PubMed] [Google Scholar]
- 7.Hadj-Rabia S, Baala L, Vabres P, Hamel-Teillac D, Jacquemin E, Fabre M, Lyonnet S, De Prost Y, Munnich A, Hadchouel M, Smahi A. Claudin-1 gene mutations in neonatal sclerosing cholangitis associated with ichthyosis: a tight junction disease. Gastroenterology. 2004;127(5):1386–90. doi: 10.1053/j.gastro.2004.07.022. [DOI] [PubMed] [Google Scholar]
- 8.Paganelli M, Stephenne X, Gilis A, Jacquemin E, Henrion Caude A, Girard M, Gonzales E, Revencu N, Reding R, Wanty C, Smets F, Sokal EM. Neonatal ichthyosis and sclerosing cholangitis syndrome: extremely variable liver disease severity from claudin-1 deficiency. J Pediatr Gastroenterol Nutr. 2011;53(3):350–4. doi: 10.1097/MPG.0b013e3182169433. [DOI] [PubMed] [Google Scholar]
- 9.Grosse B, Cassio D, Yousef N, Bernardo C, Jacquemin E, Gonzales E. Claudin-1 involved in neonatal ichthyosis sclerosing cholangitis syndrome regulates hepatic paracellular permeability. Hepatology. 2012;55(4):1249–59. doi: 10.1002/hep.24761. [DOI] [PubMed] [Google Scholar]
- 10.Uyguner O, Emiroglu M, Uzumcu A, Hafiz G, Ghanbari A, Baserer N, Yuksel-Apak M, Wollnik B. Frequencies of gap- and tight-junction mutations in Turkish families with autosomal-recessive non-syndromic hearing loss. Clin Genet. 2003;64(1):65–9. doi: 10.1034/j.1399-0004.2003.00101.x. [DOI] [PubMed] [Google Scholar]
- 11.Lee K, Ansar M, Andrade PB, Khan B, Santos-Cortez RL, Ahmad W, Leal SM. Novel CLDN14 mutations in Pakistani families with autosomal recessive non-syndromic hearing loss. Am J Med Genet A. 2012;158(2):315–21. doi: 10.1002/ajmg.a.34407. [DOI] [PMC free article] [PubMed] [Google Scholar]
- 12.Charif M, Bakhchane A, Abidi O, Boulouiz R, Eloualid A, Roky R, Rouba H, Kandil M, Lenaers G, Barakat A. Analysis of CLDN14 gene in deaf Moroccan patients with non-syndromic hearing loss. Gene. 2013;523(1):103–5. doi: 10.1016/j.gene.2013.03.123. Epub ahead of print. [DOI] [PubMed] [Google Scholar]
- 13.Konard M, Hou J, Weber S, Dötsch J, Kari JA, Seeman T, Kuwertz-Broking E, Peco-Antic A, Tasic V, Dittrich K, Alshaya HO, von Vigier RO, Gallati S, Goodenough DA, Schaller A. CLDN16 genotype predicts renal decline in familial hypomagnesemia with hypercalciuria and nephrocalcinosis. J Am Soc Nephrol. 2008;19(1):171–181. doi: 10.1681/ASN.2007060709. [DOI] [PMC free article] [PubMed] [Google Scholar]
- 14.Seeley HH, Loomba-Albrecht LA, Nagel M, Butani L, Bremer AA. Familial hypomagnesemia with hypercalciuria and nephrocalcinosis in three siblings having the same genetic lesion but different clinical presentations. World J Pediatr. 2012;8(2):177–180. doi: 10.1007/s12519-011-0295-3. [DOI] [PubMed] [Google Scholar]
- 15.Furuse M, Sasaki H, Fujimoto K, Tsukita SH. A single gene product, claudin-1 or -2, reconstitutes tight junction strands and recruits occludin in fibroblasts. J Cell Biol. 1998;143:391–401. doi: 10.1083/jcb.143.2.391. [DOI] [PMC free article] [PubMed] [Google Scholar]
- 16.Furuse M, Fujita K, Hiiragi T, Fujimoto K, Tsukita SH. Claudin-1 and -2: novel integral membrane proteines localizing at tight junctions with no sequence similarity to occludin. J Cell Biol. 1998;141(7):1539–50. doi: 10.1083/jcb.141.7.1539. [DOI] [PMC free article] [PubMed] [Google Scholar]
- 17.Morita K, Furuse M, Fujimoto K, Tsukita S. Claudin multigene family encoding four-transmembrane domain protein components of tight junction strands. Proc Natl Acad Sci USA. 1999;96(2):511–516. doi: 10.1073/pnas.96.2.511. [DOI] [PMC free article] [PubMed] [Google Scholar]
- 18.Ramirez SH, Fan S, Dykstra H, Rom S, Mercer A, Reichenbach NL, Gofman L, Persidsky Y. Inhibition of Glycogen Synthase Kinase 3b Promotes Tight Junction Stability in Brain Endothelial Cells by Half-Life Extension of Occludin and Claudin-5. PLoS ONE. 2013;8(2):e55972. doi: 10.1371/journal.pone.0055972. [DOI] [PMC free article] [PubMed] [Google Scholar]
- 19.Morita K, Sasaki H, Fujimoto K, Furuse M, Tsukita S. Claudin-11/OSP-based tight junctions of myelin sheaths in brain and Sertoli cells in testis. J Cell Biol. 1999;145(3):579–588. doi: 10.1083/jcb.145.3.579. [DOI] [PMC free article] [PubMed] [Google Scholar]
- 20.Shang X, Lin X, Alvarez E, Manorek G, Howell SB. Tight junction proteins claudin-3 and claudin-4 control tumor growth and metastases. Neoplasia. 2012 Oct;14(10):974–85. doi: 10.1593/neo.12942. [DOI] [PMC free article] [PubMed] [Google Scholar]
- 21.Lafemina MJ, Sutherland KM, Bentley T, Gonzales LW, Allen L, Chapin CJ, Rokkam D, Sweerus KA, Dobbs LG, Ballard PL, Frank JA. Claudin-18 deficiency results in alveolar barrier dysfunction and impaired alveologenesis in mice. Am J Respir Cell Mol Biol. 2014 May 1; doi: 10.1165/rcmb.2013-0456OC. Epub ahead of Am J Respir Cell Mol Biol.print. [DOI] [PMC free article] [PubMed] [Google Scholar]
- 22.Karanjawala ZE, Illei PB, Ashfaq R, Infante JR, Murphy K, Pandey A, Schulick R, Winter J, Sharma R, Maitra A, Goggins M, Hruban RH. New markers of pancreatic cancer identified through differential gene expression analyses: claudin 18 and annexin A8. The American journal of surgical pathology. 2008;32(2):188. doi: 10.1097/PAS.0b013e31815701f3. [DOI] [PMC free article] [PubMed] [Google Scholar]
- 23.Iacobuzio-Donahue CA, Maitra A, Shen-Ong GL, et al. Discovery of novel tumor markers of pancreatic cancer using global gene expression technology. Discovery of novel tumor markers of pancreatic canceusing global gene expression technology. Am J Pathol. 2002;160(4):1239–1249. doi: 10.1016/S0002-9440(10)62551-5. [DOI] [PMC free article] [PubMed] [Google Scholar]
- 24.Izraely S, Sagi-Assif O, Klein A, Meshel T, Ben-Menachem S, Zaritsky A, Ehrlich M, Prieto VG, Bar-Eli M, Pirker C, Berger W, Nahmias C, Couraud PO, Hoon DS, Witz IP. The Metastatic Microenvironment: Claudin-1 Suppresses the Malignant Phenotype of Melanoma Brain Metastasis. Int J Cancer. 2014 Jul 21; doi: 10.1002/ijc.29090. Epub ahead of print. [DOI] [PubMed] [Google Scholar]
- 25.Kramer F, White K, Kubbies M, Swisshelm K, Weber BH. Genomic organization of claudin-1 and its assessment in hereditary and sporadic breast cancer. Human Genet. 2000;107(3):249–256. doi: 10.1007/s004390000375. [DOI] [PubMed] [Google Scholar]
- 26.Szász AM1, Nyirády P, Majoros A, Szendrõi A, Szûcs M, Székely E, Tõkés AM, Romics I, Kulka J. beta-catenin expression and claudin expression pattern as prognostic factors of prostatic cancer progression. BJU Int. 2010;105(5):716–22. doi: 10.1111/j.1464-410X.2009.08808.x. [DOI] [PubMed] [Google Scholar]
- 27.Ding L, Lu Z, Lu Q, Chen YH. The claudin family of proteins in human malignancy: a clinical perspective. Cancer management and research. 2013;5:367–75. doi: 10.2147/CMAR.S38294. [DOI] [PMC free article] [PubMed] [Google Scholar]
- 28.Kominsky SL, Argani P, Korz D, Evron E, Raman V, Garrett E, Rein A, Sauter G, Kallioniemi OP, Sukumar S. Loss of the tight junction protein claudin-7 correlates with histological grade in both ductal carcinoma in situ and invasive ductal carcinoma of the breast. Oncogene. 2003;22(13):2021–33. doi: 10.1038/sj.onc.1206199. [DOI] [PubMed] [Google Scholar]
- 29.Sheehan GM, Kallakury BV, Sheehan CE, Fisher HA, Kaufman RP, Jr, Ross JS. Loss of claudins-1 and -7 and expression of claudins-3 and -4 correlate with prognostic variables in prostatic adenocarcinomas. Hum Pathol. 2007;38(4):564–9. doi: 10.1016/j.humpath.2006.11.007. [DOI] [PubMed] [Google Scholar]
- 30.Usami Y1, Chiba H, Nakayama F, Ueda J, Matsuda Y, Sawada N, Komori T, Ito A, Yokozaki H. Reduced expression of claudin-7 correlates with invasion and metastasis in squamous cell carcinoma of the esophagus. Human Pathology. 2006;37(5):569–77. doi: 10.1016/j.humpath.2005.12.018. [DOI] [PubMed] [Google Scholar]
- 31.Liebner S1, Fischmann A, Rascher G, Duffner F, Grote EH, Kalbacher H, Wolburg H. Claudin-1 and claudin-5 expression and tight junction morphology are altered in blood vessels of human glioblastoma multiforme. Acta Neuropathol. 2000;100(3):323–31. doi: 10.1007/s004010000180. [DOI] [PubMed] [Google Scholar]
- 32.Roe K, Kumar M, Lum S, Orillo B, Nerurkar VR, Verma S. West Nile virus-induced disruption of the blood-brain barrier in mice is characterized by the degradation of the junctional complex proteins and increase in multiple matrix metalloproteinases. J Gen Virol. 2012;93(Pt 6):1193–203. doi: 10.1099/vir.0.040899-0. [DOI] [PMC free article] [PubMed] [Google Scholar]
- 33.Feng S, Cen J, Huang Y, Shen H, Yao L, Wang Y, Chen Z. Matrix Metalloproteinase-2 and -9 Secreted by Leukemic Cells Increase the Permeability of Blood Brain Barrier by Disrupting Tight Junction Proteins. PLoS ONE. 2011;6(8):e20599. doi: 10.1371/journal.pone.0020599. [DOI] [PMC free article] [PubMed] [Google Scholar]
- 34.Gu YT, Xue YX, Wang YF, Wang JH, Chen X, ShangGuan QR, Lian Y, Zhong L, Meng YN. Minoxidil sulfate induced the increase in blood–brain tumor barrier permeability through ROS/RhoA/PI3K/PKB signaling pathway. Neuropharmacology. 2013;75:407–15. doi: 10.1016/j.neuropharm.2013.08.004. [DOI] [PubMed] [Google Scholar]
- 35.D’Souza T, Agarwal R, Morin PJ. Phosphorylation of claudin-3 at threonine 192 by pka regulates tight junction barrier function in ovarian cancer cells. J Biol Chem. 2005;280(28):26233–40. doi: 10.1074/jbc.M502003200. [DOI] [PubMed] [Google Scholar]
- 36.Kominsky SL, Vali M, Korz D, Gabig TG, Weitzman SA, Argani P, Sukumar S. Clostridium perfringens enterotoxin elicits rapid and specific cytolysis of breast carcinoma cells mediated through tight junction proteins claudin 3 and 4. AmJ Pathol. 2004;164(5):1627–33. doi: 10.1016/S0002-9440(10)63721-2. [DOI] [PMC free article] [PubMed] [Google Scholar]
- 37.Long H, Crean CD, Lee WH, Cummings OW, Gabig TG. Expression of Clostridium perfringens enterotoxin receptors claudin-3 and claudin-4in prostate cancer epithelium. Cancer Res. 2001;61(21):7878–81. [PubMed] [Google Scholar]
- 38.Gress TM, Müller-Pillasch F, Geng M, Zimmerhackl F, Zehetner G, Friess H, Büchler M, Adler G, Lehrach H. A pancreatic cancer- specific expression profile. Oncogene. 1996;13(8):1819–30. [PubMed] [Google Scholar]
- 39.Terris B, Blaveri E, Crnogorac-Jurcevic T, Jones M, Missiaglia E, Ruszniewski P, Sauvanet A, Lemoine NR. Characterization of gene expression profiles in intraductal papillary-mucinous tumors of the pancreas. AmJ Pathol. 2002;160(5):1745–54. doi: 10.1016/S0002-9440(10)61121-2. [DOI] [PMC free article] [PubMed] [Google Scholar]
- 40.Lee JW, Hsiao WT, Chen HY, Hsu LP, Chen PR, Lin MD, Chiu SJ, Shih WL, Hsu YC. Upregulated claudin-1 expression confers resistance to cell death of nasopharyngeal carcinoma cells. Int J Cancer. 2010;126(6):1353–66. doi: 10.1002/ijc.24857. [DOI] [PubMed] [Google Scholar]
- 41.Blanchard AA, Ma X, Dueck KJ, Penner C, Cooper SC, Mulhall D, Murphy LC, Leygue E, Myal Y. Claudin 1 expression in basal-like breast cancer is related to patient age. BMC Cancer. 2013;13:268. doi: 10.1186/1471-2407-13-268. [DOI] [PMC free article] [PubMed] [Google Scholar]
- 42.Huber JD, Witt KA, Hom S, Egleton RD, Mark KS, Davis TP. Inflammatory pain alters blood-brain barrier permeability and tight junctional protein expression. Am J Physiol Heart Circ Physiol. 2001;280(3):H1241–8. doi: 10.1152/ajpheart.2001.280.3.H1241. [DOI] [PubMed] [Google Scholar]
- 43.Sawada N, Murata M, Kikuchi K, Osanai M, Tobioka H, Kojima T, Chiba H. Tight junctions and human diseases. Medical Electron Microscopy. 2003;36(3):147–156. doi: 10.1007/s00795-003-0219-y. [DOI] [PubMed] [Google Scholar]
- 44.Wolburg H, Wolburg-Buchholz K, Liebner S, Engelhardt B. Claudin-1, claudin-2 and claudin-11 are present in tight junctions of choroid plexus epithelium of the mouse. Neurosci Lett. 2001;307(2):77–80. doi: 10.1016/s0304-3940(01)01927-9. [DOI] [PubMed] [Google Scholar]
- 45.Bronstein JM, Tiwari-Woodruff S, Buznikov AG, Stevens DB. Involvement of OSP/claudin-11 in oligodendrocyte membrane interactions: role in biology and disease. J Neurosci Res. 2000;59(6):706–11. doi: 10.1002/(SICI)1097-4547(20000315)59:6<706::AID-JNR2>3.0.CO;2-D. [DOI] [PubMed] [Google Scholar]
- 46.Gumbiner B, Simons K. A functional assay for proteins involved in establishing an epithelial occluding barrier: identification of a uvomorulin-like polypeptide. J Cell Biol. 1986;102(2):457–68. doi: 10.1083/jcb.102.2.457. [DOI] [PMC free article] [PubMed] [Google Scholar]
- 47.Rodriguez-Boulan E, Nelson WJ. Morphogenesis of the polarized epithelial cell phenotype. Science. 1989;245(4919):718–25. doi: 10.1126/science.2672330. [DOI] [PubMed] [Google Scholar]
- 48.Nelson WJ. Regulation of cell surface polarity from bacteria to mammals. Science. 1992;258(5084):948–55. doi: 10.1126/science.1439806. [DOI] [PubMed] [Google Scholar]
- 49.Schulze C, Firth JA. Immunohistochemical localization of adherens junction components in blood-brain barrier microvessels of the rat. J Cell Sci. 1993;104( Pt 3):773–82. doi: 10.1242/jcs.104.3.773. [DOI] [PubMed] [Google Scholar]
- 50.Lampugnani MG, Corada M, Caveda L, Breviario F, Ayalon O, Geiger B, Dejana E. The molecular organization of endothelial cell to cell junctions: differential association of plakoglobin, β-catenin and a-catenin with vascular endothelial cadherin (VE-cadherin) J Cell Biol. 1995;129(1):203–17. doi: 10.1083/jcb.129.1.203. [DOI] [PMC free article] [PubMed] [Google Scholar]
- 51.Liebner S, Gerhardt H, Wolburg H. Differential expression of endothelial β-catenin and plakoglobin during development and maturation of the blood-brain and blood-retina barrier in the chicken. Dev Dyn. 2000;217(1):86–98. doi: 10.1002/(SICI)1097-0177(200001)217:1<86::AID-DVDY8>3.0.CO;2-E. [DOI] [PubMed] [Google Scholar]
- 52.Munemitsu S, Albert I, Souza B, Rubinfeld B, Polakis P. Regulation of intracellular beta-catenin levels by the adenomatous polyposis coli (APC) tumor-suppressor protein. Proc Natl Acad Sci U S A. 1995;92(7):3046–50. doi: 10.1073/pnas.92.7.3046. [DOI] [PMC free article] [PubMed] [Google Scholar]
- 53.Yost C, Torres M, Miller JR, Huang E, Kimelman D, Moon RT. The axis-inducing activity, stability, and subcellular distribution of beta-catenin is regulated in Xenopus embryos by glycogen synthase kinase 3. Genes Dev. 1996;10(12):1443–54. doi: 10.1101/gad.10.12.1443. [DOI] [PubMed] [Google Scholar]
- 54.Behrens J, von Kries JP, Kühl M, Bruhn L, Wedlich D, Grosschedl R, Birchmeier W. Functional interaction of β-catenin with the transcription factor LEF-1. Nature. 1996;382(6592):638–42. doi: 10.1038/382638a0. [DOI] [PubMed] [Google Scholar]
- 55.Fagotto F, Glück U, Gumbiner BM. Nuclear localization signal-independent and importin/karyopherin-independent nuclear import of beta-catenin. Curr Biol. 1998;8(4):181–90. doi: 10.1016/s0960-9822(98)70082-x. [DOI] [PubMed] [Google Scholar]
- 56.Miller JR, Moon RT. Signal transduction through β-catenin and specification of cell fate during embryogenesis. Genes Dev. 1996;10(20):2527–39. doi: 10.1101/gad.10.20.2527. [DOI] [PubMed] [Google Scholar]
- 57.Rutten MJ, Hoover RL, Karnovsky MJ. Electrical resistance and macromolecular permeability of brain endothelial monolayer cultures. Brain Res. 1987;425(2):301–10. doi: 10.1016/0006-8993(87)90513-0. [DOI] [PubMed] [Google Scholar]
- 58.Rakhade SN, Yao B, Ahmed S, Asano E, Beaumont TL, Shah AK, Draghici S, Krauss R, Chugani HT, Sood S, Loeb JA. A common pattern of persistent gene activation in human neocortical epileptic foci. Ann Neurol. 2005;58(5):736–47. doi: 10.1002/ana.20633. [DOI] [PubMed] [Google Scholar]
- 59.Abe T, Sugano E, Saigo Y, Tamai M. Interleukin-1β and Barrier Function of Retinal Pigment Epithelial Cells (ARPE-19): Aberrant Expression of Junctional Complex Molecules Invest. Ophthalmol Vis Sci. 2003;44(9):4097–104. doi: 10.1167/iovs.02-0867. [DOI] [PubMed] [Google Scholar]
- 60.Shaik NA, Lone WG, Khan IA, Rao KP, Kodati VL, Hasan Q. Enhanced transcription of estrogen receptor α and mitochondrial cytochrome b genes in uterine leiomyomas. Gynecological Endocrinology. 2011;27(12):1094–8. doi: 10.3109/09513590.2011.569610. [DOI] [PubMed] [Google Scholar]
- 61.Kniesel U, Risau W, Wolburg H. Development of bloodbrain barrier tight junctions in the rat cortex. Dev Brain Res. 1996;96(1–2):229–40. doi: 10.1016/0165-3806(96)00117-4. [DOI] [PubMed] [Google Scholar]
- 62.Itoh M, Nagafuchi A, Yonemura S, Kitani-Yasuda T, Tsukita S, Tsukita S. The 220 KD protein colocalizing with cadherins in non-epithelial cells is identical to ZO-1, a tight junction associated protein in epithelial cells – cDNA cloning and immunoelectron microscpy. J Cell Biol. 1993;121(3):491–502. doi: 10.1083/jcb.121.3.491. [DOI] [PMC free article] [PubMed] [Google Scholar]
- 63.Knudsen KA, Frankowski C, Johnson KR, Wheelock MJ. A role for cadherins in cellular signaling and differentiation. J Cell Biochem Suppl. 1998;30–31:168–76. [PubMed] [Google Scholar]
- 64.Morita K, Sasaki H, Furuse M, Tsukita S. Endothelial claudin: claudin-5/TMVCF constitutes tight junction strands in endothelial cells. J Cell Biol. 1999;147(1):185–94. doi: 10.1083/jcb.147.1.185. [DOI] [PMC free article] [PubMed] [Google Scholar]
- 65.Greig NH. Brain tumors and the blood-tumor barrier. In: Neuwelt EA, editor. Implications of the Blood-Brain Barrier and Its Manipulation: Vol. 2. Clinical Aspects. Plenum Publishing Corp; New York: 1989. pp. 77–106. [Google Scholar]
- 66.Greig NH. Optimizing drug delivery to brain tumors. Cancer Treat Rev. 1987;14:1–28. doi: 10.1016/0305-7372(87)90048-x. [DOI] [PubMed] [Google Scholar]
- 67.Muldoon LL, Soussain C, Jahnke K, Johanson C, Siegal T, Smith QR, Hall WA, Hynynen K, Senter PD, Peereboom DM, Neurwelt EA. Chemotherapy delivery issues in central nervous system malignancy: reality check. J Clin Oncol. 2007;25:2295–305. doi: 10.1200/JCO.2006.09.9861. [DOI] [PubMed] [Google Scholar]
- 68.Hewitt KJ, Agarwal R, Morin PJ. The claudin gene family: expression in normal and neoplastic tissues. BMC Cancer. 2006;6:186. doi: 10.1186/1471-2407-6-186. [DOI] [PMC free article] [PubMed] [Google Scholar]
- 69.Ishihara H, Kubota H, Lindberg RL, Leppert D, Gloor SM, Errede M, Virgintino D, Fontana A, Yonekawa Y, Frei K. Endothelial Cell Barrier Impairment Induced by Glioblastomas and Transforming Growth Factor [beta]2 Involves Matrix Metalloproteinases and Tight Junction Proteins. Journal of Neuropathology & Experimental Neurology. 2008;67(5):435–48. doi: 10.1097/NEN.0b013e31816fd622. [DOI] [PubMed] [Google Scholar]
- 70.Lopez-Ramirez MA, Wu D, Pryce G, Simpson JE, Reijerkerk A, King-Robson J, Kay O, de Vries HE, Hirst MC, Sharrack B, Baker D, Male DK, Michael GJ, Romero IA. MicroRNA-155 negatively affects blood-brain barrier function during neuroinflammation. FASEB J. 2014;28(6):2551–65. doi: 10.1096/fj.13-248880. [DOI] [PubMed] [Google Scholar]
- 71.Fletcher NF, Wilson G, Murray J, Hu K, Lewis A, Reynolds G, Stamataki Z, Meredith L, Rowe I, Luo G, Lopez-Ramirez M, Baumert T, Weksler B, Couraud P, Kim K, Romero I, Jopling C, Morgello S, Balfe P, McKeating JA. Hepatitis C virus infects the endothelial cells of the blood-brain barrier. Gastroenterology. 2012;142:634–643. doi: 10.1053/j.gastro.2011.11.028. [DOI] [PMC free article] [PubMed] [Google Scholar]
- 72.Pfeiffer F, Schafer J, Lyck R, Makrides V, Brunner S, Schaeren-Wiemers N, Deutsch U, Engelhardt B. Claudin-1 induced sealing of blood-brain barrier tight junctions ameliorates chronic experimental autoimmune encephalomyelitis. Acta Neuropathol. 2011;122:601–614. doi: 10.1007/s00401-011-0883-2. [DOI] [PMC free article] [PubMed] [Google Scholar]
- 73.Hoevel T, Macek R, Swisshelm K, Kubbies M. Reexpression of the TJ protein claudin-1 induces apoptosis in breast tumor spheroids. Int J Cancer. 2004;108(3):374–83. doi: 10.1002/ijc.11571. [DOI] [PubMed] [Google Scholar]
- 74.Tsukita S, Furuse M, Itoh M. Multifunctional strands in tight junctions. Nat Rev Mol Cell Bio. 2001;2(4):285–93. doi: 10.1038/35067088. [DOI] [PubMed] [Google Scholar]
- 75.Morohashi S, Kusumi T, Sato F, Odagiri H, Chiba H, Yoshihara S, Hakamada K, Sasaki M, Kijima H. Decreased expression of claudin-1 correlates with recurrence status in breast cancer. Int JMolMed. 2007;20(2):139–43. [PubMed] [Google Scholar]
- 76.Tzelepi VN, Tsamandas AC, Vlotinou HD, Vagianos CE, Scopa CD. Tight junctions in thyroid carcinogenesis: diverse expression of claudin-1, claudin-4, claudin-7 and occludin in thyroid neoplasms. Mod Pathol. 2008;21(1):22–30. doi: 10.1038/modpathol.3800959. [DOI] [PubMed] [Google Scholar]
- 77.Higashi Y, Suzuki S, Sakaguchi T, Nakamura T, Baba S, Reinecker HC, Nakamura S, Konno H. Loss of claudin-1 expression correlates with malignancy of hepatocellular carcinoma. J Surg Res. 2007;139(1):68–76. doi: 10.1016/j.jss.2006.08.038. [DOI] [PubMed] [Google Scholar]
- 78.Oku N, Sasabe E, Ueta E, Yamamoto T, Osaki T. Tight junction protein claudin-1 enhances the invasive activity of oral squamous cell carcinoma cells by promoting cleavage of laminin-5 g2 chain via matrix metalloproteinase (MMP)-2 and membrane-type MMP-1. Cancer Res. 2006;66(10):5251–7. doi: 10.1158/0008-5472.CAN-05-4478. [DOI] [PubMed] [Google Scholar]
- 79.Leotlela PD, Wade MS, Duray PH, Rhode MJ, Brown HF, Rosenthal DT, Dissanayake SK, Earley R, Indig FE, Nickoloff BJ, Taub DD, Kallioniemi OP, Meltzer P, Morin PJ, Weeraratna AT. Claudin-1 over expression in melanoma is regulated by PKC and contributes to melanoma cell motility. Oncogene. 2007;26(26):3846–56. doi: 10.1038/sj.onc.1210155. [DOI] [PubMed] [Google Scholar]
- 80.Christofori G. New signals from the invasive front. Nature. 2006;441(7092):444–50. doi: 10.1038/nature04872. [DOI] [PubMed] [Google Scholar]
- 81.Blanco D, Vicent S, Elizegi E, Pino I, Fraga MF, Esteller M, Saffiotti U, Lecanda F, Montuenga LM. Altered expression of adhesion molecules and epithelial-mesenchymal transition in silica-induced rat lung carcinogenesis. Lab Invest. 2004;84(8):999–1012. doi: 10.1038/labinvest.3700129. [DOI] [PubMed] [Google Scholar]
- 82.Greig NH, Ries LG, Yancik R, Rapoport SI. Increasing annual incidence of primary malignant brain tumors in the elderly. J Natl Cancer Inst. 1990;82(20):1621–4. doi: 10.1093/jnci/82.20.1621. [DOI] [PubMed] [Google Scholar]
- 83.Chakrabarti I, Cockburn M, Cozen W, Wang YP, Preston-Martin S. A population-based description of glioblastoma multiforme in Los Angeles County, 1974–1999. Cancer. 2005;104(12):2798–806. doi: 10.1002/cncr.21539. [DOI] [PubMed] [Google Scholar]
- 84.Iwamoto FM, Reiner AS, Panageas KS, Elkin EB, Abrey LE. Patterns of care in elderly glioblastoma patients. Ann Neurol. 2008;64(6):628–34. doi: 10.1002/ana.21521. [DOI] [PubMed] [Google Scholar]
- 85.Lukas RV, Nicholas MK. Update in the treatment of high-grade Gliomas. Neurol Clin. 2013;31(3):847–67. doi: 10.1016/j.ncl.2013.03.005. [DOI] [PubMed] [Google Scholar]
- 86.Arvold ND, Reardon DA. Treatment options and outcomes for glioblastoma in the lderly patient. Clin Interv Aging. 2014;9:357–67. doi: 10.2147/CIA.S44259. [DOI] [PMC free article] [PubMed] [Google Scholar]


