ABSTRACT
Rotifer community is often used as a taxon-based bioindicator for water quality. However, studies of the planktonic community from the viewpoint of functional groups in freshwater ecosystems have been limited, particularly for rotifers. Because rotifers have various trophi types determining their feeding strategies, thereby representing an ecological niche, their functional feeding groups can act as biological and ecological indicators in lakes and reservoirs where planktonic communities are dominant. We analyzed the patterns of spatial distribution of the rotifer community in various reservoirs and then its relationship with water quality through redundancy and regression analyses. Compared with taxon-based composition, the response of trophi-based composition appears simplistic and showed clearer tendency in relation with water-quality variables. Each trophi responded differently by the degree of eutrophication indicating that each trophi group is possibly affected by environments such as the combinations of water-quality variables in different ways.
KEYWORDS: Trophi, zooplankton, community structure, RDA, spatial pattern
Introduction
Bioindicators are widely used for environmental assessment because they can comprehensively represent physical, chemical, and biological environments, and consequently human impact on ecosystem (Marbà et al. 2013). Recently, rotifers are used as the subject of studies related with water qualities (Minakshi & Madhuri 2013; Gutkowska et al. 2013). Rotifer community persists throughout a year and is distributed over a wide range of habitats. Their short life-cycles allow rapid responses to changes in environmental conditions. For such reasons, the rotifer community has been considered as a possible bioindicator, and the application as a water-quality indicator has been suggested (Gannon & Stemberger 1978; Sládeček 1983). However, it has also been suggested that the rotifer community could not satisfy the biota index representing changes of water environments. Because the results of analyses are usually changed in spatial and temporal aspect by the density based on species-based composition, and biomass, dominant species and diversity of rotifers significantly fluctuated with water condition such as temperature, eutrophication, or the degree of pollution (Minakshi & Madhuri 2013; Antonio et al. 2014). May and O’Hare (2005) and Gutkowska et al. (2013) also suggested that the species compositions of rotifers are often not correlated with the trophic state of the habitats.
To understand the response of aquatic ecosystems to environmental perturbations, taking functional diversity within trophic levels into account is critical (Hulot et al. 2000). Functional feeding groups of macro-invertebrates based on feeding behaviors are a good example and are well represented as biological indicators in stream ecology (Cummins 1973). Therefore, feeding behavior is a key aspect that can be divided into functional groups. Feeding behavior often represents not only food consumption but also consequent result of competition, and possibly acts as an indicator of impacts of human-induced environmental changes (Palkovacs et al. 2012).
Rotifers have a pharyngeal apparatus called trophi, which is a masticatory apparatus composed of hard, sclerotized, and articulated segments. Each rotifer species has different trophi, and the structure of trophi is an important taxonomic characteristic. The trophi of rotifers can be categorized into six groups by the shapes and overall structure, and the morphology of trophi provides principal information regarding feeding behavior (grasping, grinding, pumping, or suction), life history, and habitat preference. Therefore, this functional-based approach can be applied to understand environmental factors governing the community dynamics of rotifers (Sørensen 2002).
In the present study, we analyzed the responses of rotifer functional groups to water-quality variability in reservoirs following the hypotheses: if we consider spatial distribution of water quality of various habitats with different water quality, clear patterns of reacting to certain environmental factors can be found for functional groups within rotifers. To test our hypotheses, we classified the rotifer community according to two different categories (species composition and trophi structure), and compared their response patterns against the environmental variability in various reservoirs of different environments.
Materials and methods
Functional group categorization
To analyze correlations between the composition of the rotifer community and water quality, rotifer species were divided into two groups based on species, and trophi. The trophi can be classified into nine groups as follows: malleate, ramate, malleoramate, fulcrate, incudate, cardate, uncinate, virgate, and forcipate (Wallace et al. 2006). Among these types, the fulcrate, cardate, forcipate, and uncinate types were excluded from our study because they are found only within marine rotifers (fulcrate) and not within our study (Figure 1).
Figure 1.
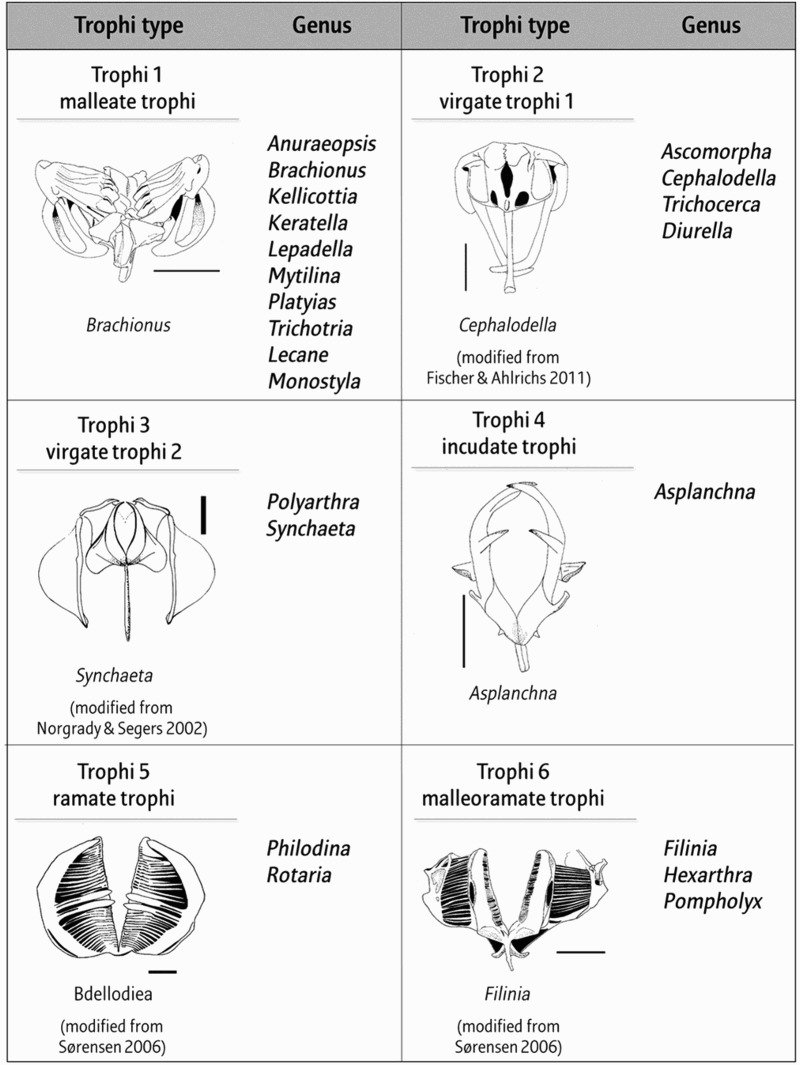
List of rotifer trophi types and genus (scale bars = 10 μm). Trophi 1, malleate trophi of Brachionus; trophi 2, virgate trophi of Cephalodella; trophi 3, virgate trophi of Synchaeta; trophi 4, incudate trophi of Asplanchna; trophi 5, ramate trophi of bdelloid rotifer; trophi 6, malleoramate trophi of Fillinia (trophi 1 and 4, by author; trophi 2, Fischer & Ahlrichs 2011; trophi 3, Norgrady & Segers 2002; trophi 5 and 6, Sørensen & Giribet 2006).
Study sites and sampling
To evaluate how the communities grouped by species and trophi correspond to that of water quality, we selected 16 agricultural reservoirs of different locations and various water environments across South Korea (Figure 2). Sampling for rotifer communities and water quality was conducted at each reservoir from May to early June 2014 (Table 1).
Figure 2.
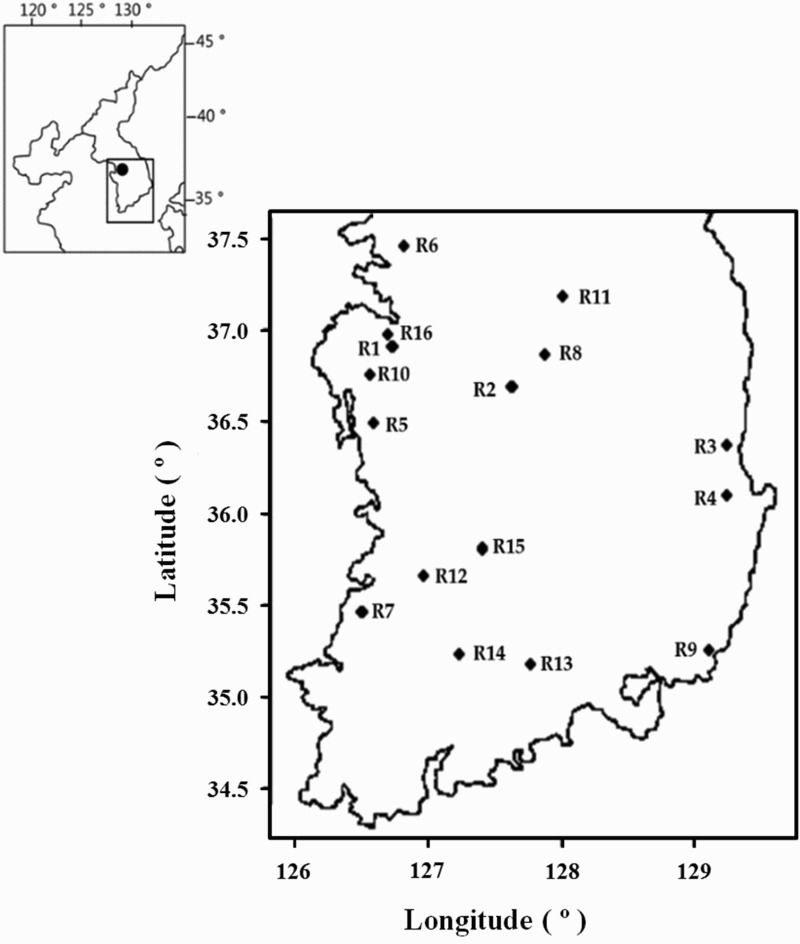
Map of study sites.
Table 1. The values of water-quality parameters in the 16 reservoirs.
| No. | Site | Temp. (°C) | EC (μS/cm) | pH | Chl. a (mg/m3) | TN (mg/L) | TP (mg/L) | COD (mg/L) | TSIKO | Dominant phytoplankton class |
|---|---|---|---|---|---|---|---|---|---|---|
| R1 | Jeondae | 22.6 | 282 | 9.7 | 98.2 | 1.700 | 0.100 | 13.6 | 84.0 | Chanophyceae(98%) |
| R2 | Yonggok | 9.4 | 145 | 8.5 | 23.4 | 1.425 | 0.034 | 6.0 | 57.0 | Bacillariophyceae(76%) |
| R3 | Bongsan | 22.4 | 320 | 8.5 | 6.0 | 0.671 | 0.047 | 10.4 | 60.5 | Cryptophyceae(60%) |
| R4 | Yongcheon | 14.8 | 119 | 6.8 | 9.2 | 2.332 | 0.047 | 7.8 | 58.3 | Bacillariophyceae(42%), |
| R5 | Jangchuck | 21.4 | 207 | 8.3 | 3.2 | 0.911 | 0.019 | 9.2 | 51.9 | Cryptophyceae(96%) |
| R6 | Gwarim | 18.2 | 473 | 8.3 | 74.2 | 3.547 | 0.149 | 16.9 | 83.2 | Cryptophyceae(38%) |
| R7 | Songgok | 20.9 | 354 | 8.0 | 9.4 | 4.112 | 0.475 | 7.6 | 68.9 | Bacillariophyceae(79%) |
| R8 | Yidam | 16.9 | 214 | 9.4 | 34.6 | 1.369 | 0.103 | 13.7 | 75.4 | Chlorophyceae(63%) |
| R9 | Genmjeong | 22.0 | 228 | 8.8 | 27.0 | 0.778 | 0.113 | 10.8 | 71.4 | Chlorophyceae(88%) |
| R10 | Sinchang | 21.1 | 350 | 7.8 | 51.0 | 1.565 | 0.147 | 13.7 | 78.7 | Cyanophyceae(68%) |
| R11 | Baengma | 14.1 | 121 | 8.9 | 6.0 | 1.030 | 0.042 | 7.6 | 55.6 | Cryptophyceae(99%) |
| R12 | Oseong | 14.5 | 160 | 8.7 | 27.7 | 0.908 | 0.046 | 9.2 | 65.1 | Cyanophyceae(61%) |
| R13 | Hadong | 22.8 | 109 | 6.8 | 10.0 | 0.849 | 0.041 | 7.0 | 56.4 | Cryptophyceae(90%) |
| R14 | Samgi | 11.0 | 140 | 8.2 | 11.6 | 1.279 | 0.028 | 4.8 | 50.0 | Cyanophyceae(64%) |
| R15 | Yeonjae | 25.5 | 290 | 9.4 | 15.7 | 0.594 | 0.050 | 9.6 | 63.7 | Cyanophyceae(54%) |
| R16 | Chodae | 19.9 | 457 | 7.5 | 39.7 | 5.320 | 0.460 | 20.3 | 84.5 | Cyanophyceae(95%) |
Note: Temp, temperature; EC, electrical conductivity; pH, Chl. a, chlorophyll a; TN, total nitrogen; TP, total phosphorus; COD, chemical oxygen demand; TSIKO, 30 < Mesotrophication< = 50, 50 < Eutrophication< = 70, and 70 < Hypereutrophication; dominant phytoplankton class, %, relative abundance.
For the analysis of the rotifer community, collected 10 L of surface water was filtered with a plankton net (60-μm mesh size) at the center of the reservoir and fixed with formalin (final concentration, 5%). The species compositions were analyzed by optical microscopy at 100× (Olympus BX51, Japan). Water temperature (°C), pH, and electrical conductivity (EC) (μS/cm) were measured using YSI Pro Plus (OH, USA) at study sites. Reservoirs water was collected from 1-m depth, after which chemical oxygen demand (COD) (mg/L), total nitrogen (TN) (mg/L), total phosphorus (TP) (mg/L), and chlorophyll a (Chl. a) (mg/m3) were measured according to the standard methods (Korea Ministry of Environment 2006).
Statistical analyses
The rotifer species composition (ind./L) and water qualities were used after transformation by ln(x + 1), and Bray–Curtis similarity was calculated for cluster analysis and non-metric multidimensional scaling (NMDS) to analyze their correspondences. NMDS estimates both a non-parametric monotonic relationship and the location of each item in the low-dimensional space. In the results of NMDS, higher similarity of two sites express the shorter distance between them. Cluster analyses and NMDS were performed using Primer-5 (Clarke & Warwick 1994). For the community analysis, species abundances were transformed using the Hellinger transformation (Legendre & Gallagher 2001) (R, vegan library). Detrended correspondence analysis, and redundancy analysis (RDA) were conducted using R version 3.0.3 (R Core Team 2011) to estimate the relationships among water quality and rotifer compositions. To check the responses of trophi groups to the degree of eutrophication, we performed regression analysis between the proportion of each trophi groups and the Korean Trophic State Index (TSIKO). Korean TSI Index can be calculated based on each parameter as well as their combination (Ahn et al. 2013).
| (1) |
| (2) |
| (3) |
| (4) |
Results and discussion
Selected reservoirs showed a wide range of water-quality parameters, except for pH (Table 1). Chlorophyll a concentrations varied with range between 3.2 and 98.2 mg/m3, and consequently, calculated trophic index (TSIKO) showed the range between 50.0 and 84.5, including three different trophic states. For rotifer community, we found 17 genus and 24 species from 16 agricultural reservoirs. According to their trophi types, a total of six rotifer functional groups (malleate, ramate, malleoramate, incudate, virgate, and forcipate) were identified in the present study.
NMDS analysis divided the 16 agricultural reservoirs mainly into two groups based on cluster analysis, comprising common water-quality variables (Figure 3). Stress levels of produced NMDS was 0.02, corresponding to an excellent representation of the data in the NMDS plot. This yielded two distinct clusters: 1) group A with highly eutrophicated environments characterized by higher COD, Chl. a, TN, and TP, and 2) group B with less eutrophicated environments. The clustering results of the rotifer community based on species and trophi were compared with that of water-quality variables (Figure 4). Trophi composition (Figure 4(c)) yielded two clusters, similar to that of water quality (Figure 4(a)). One cluster represented a less eutrophicated group, similar to group B. This group included seven of nine reservoirs clustered as group B for water-quality variables. On the other hand, the compositions of species (Figure 4(b)) showed a non-predictable distribution of reservoirs and clustered into small clusters. In particular, the composition of species showed lower similarities among each reservoir.
Figure 3.
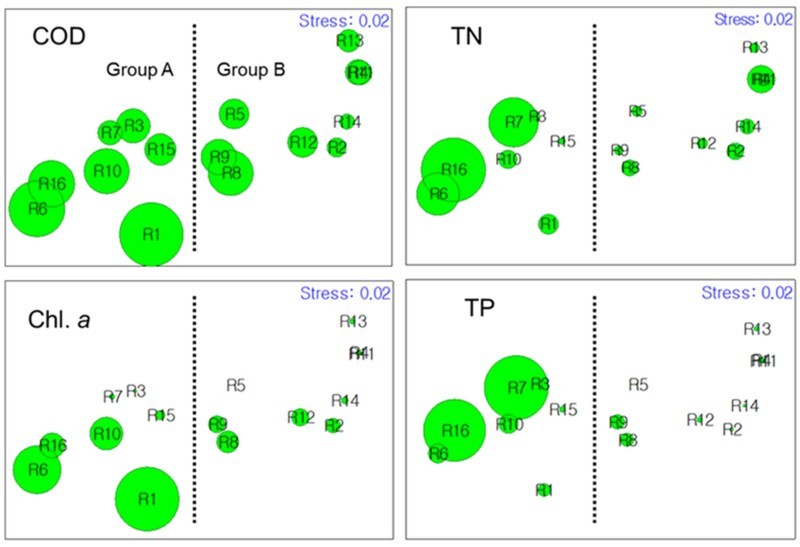
Non-metric multidimensional scaling (NMDS) of reservoirs according to water-quality variables. Dotted line indicates the division of the two main groups separated by the similarity of approximately 65%, and bubbles indicate the relative values of COD, TN, Chl. a, and TP for each reservoir.
Figure 4.
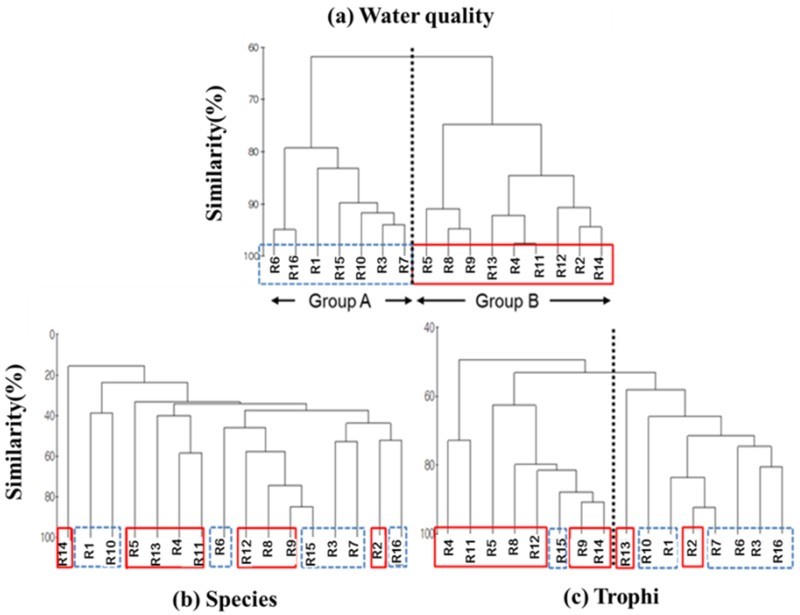
Clustering of 16 reservoirs based on water-quality variables (a) and compositions of rotifer species (b), and trophi groups (c).
The RDA analyses for the species composition did not show clear relationships with water-quality variables (Figure 5(a)). Water-quality variables explained 54.3% of the total variation in rotifer composition in order of Figure 5; however, a total of 24 species and genera aggregated near the center of the two axes. So, it was difficult to find correlations between rotifers species composition and water qualities.
Figure 5.
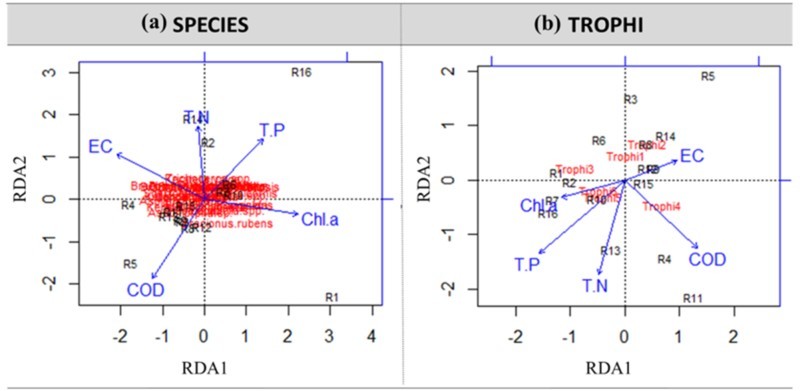
Redundancy analysis triplots on rotifer species (a), and trophi (b) groups and environmental variables.
On the other hand, RDA for the trophi composition indicated that the different responses of each trophi group and water-quality variables explained 76.3% of the total variation (Figure 5(b)). The explained proportion of contribution to the variances of trophi groups was higher than species groups. In the results of interpreting RDA in various reservoirs showed that primarily axis 1 of Chl. a, COD, and TP explained 49.4%, and axis 2 of COD, TP, and TN explained 27.0% of the total variation; these two cases had approximately 50% correspondence. The location of each trophi group was distinguished from each other, and, in particular, trophi 3 showed an apparent positive relationship with Chl. a and TP.
When the responses of each trophi (%, proportion) to TSIKO (COD), TSIKO (Chl. a), TSIKO (TP), and total TSIKO were examined using regression analysis, each trophi group showed different patterns along with an increase in TSI indices that increase as eutrophication proceeds (Figure 6). At the same time, the response pattern of trophi group was also different according to the water-quality parameter used for index calculation. Trophi 1 (maleate trophi), including genera Brachionus and Keratella, which commonly dominate in various water bodies (Gannon & Stemberger 1978), showed positive relationships with COD and Chl. a, but statistically significant relations were not obtained. On the other hand, trophi 3 (forcipate trophi) represented by the genus Polyarthra had positive relationships with all TSI indices: TSIKO(COD), TSIKO(Chl. a), TSIKO(TP), and total TSIKO, significantly with TSIKO(Chl. a) and total TSIKO. It has been reported that Polyarthra often drastically increases as eutrophication proceeds (Hillbricht-Ilkowska 1983). Thus, forcipate trophi group is considered as a true indicator for eutrophic procedure, especially in relation with an increase in phytoplankton biomass.
Figure 6.
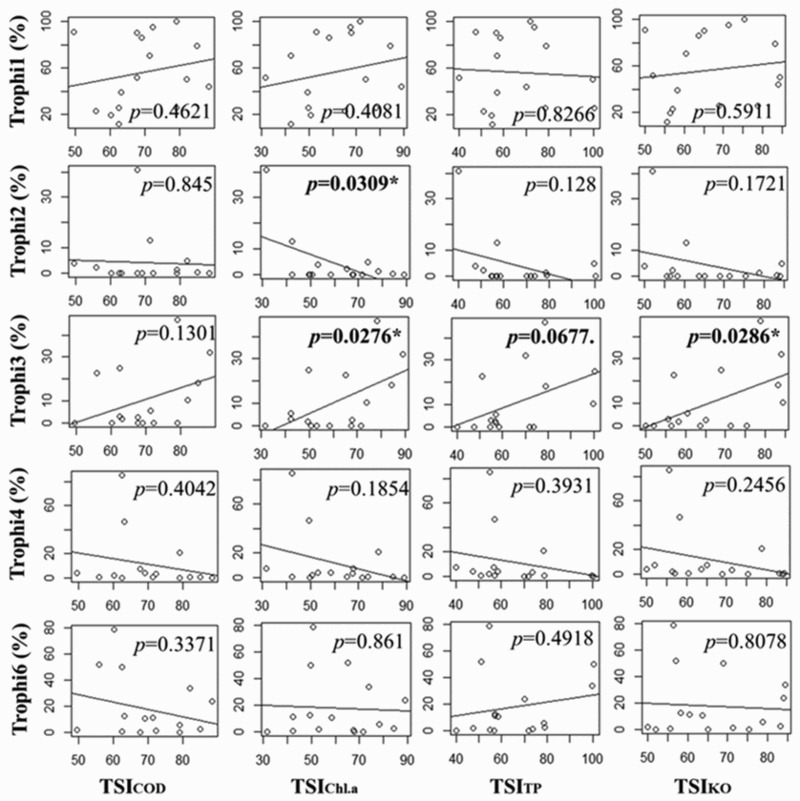
Regression results for the relationship between proportion of each trophi (%) and indices related to TSIKO (*, p < .05).
On the other hand, the trophi 6 (malleoramate trophi) group, which includes the genera Filinia and Pompholyx, comprising other major groups of rotifers, did not show apparent patterns with TSI indices. Trophi 2 (virgate trophi) group had somewhat negative relationships with indices. Trophi 2 includes the genera Lecane and Monostyla, mainly known as attached rotifers (Choi et al. 2013) depending their food supply on the biofilm and organic matters in the littoral area rather than direct food sources in the pelagic zone. It can be inferred that they are not directly affected by water qualities due to their characteristics of habitats and feeding habits. Meanwhile, trophi 4 (incudate trophi), representing the genera Asplanchna, predacious and omnivorous feeding behavior (Chang et al. 2010), showed somewhat negative relationships with TSI indices.
The morphology of trophi provides a clear key for taxonomic identification and classification of functional group, which can be categorized based on specific feeding behavior (Obertegger et al. 2011). The responses of rotifer community to water-quality variability have been tested by many researchers (Gannon & Stemberger 1978; Sládeček 1983; Hulot et al. 2000). In particular, Sládeček (1983) classified 620 species of rotifer according to water quality, and suggested their saprobic index indicating the relationships between each species and saprobity regarding BOD5 values. This classification can be useful to estimate water quality from the view point of degree of eutrophication by using the species indicating oligotrophic and eutrophic conditions. However, it needs high taxonomic resolution, and its results are limited to degree of eutrophication since most species indicate oligosaprobic or mesosaprobic conditions. On the other hand, in the present study, we estimated the community responses of rotifer to the combination of common water-quality variables using the functional approach focusing on the trophi structure. Compared with taxon composition, the response of trophi-based composition appears simplistic, when considering the relationship with water-quality variables.
Different positions of trophi groups on the ordination plot of RDA and their different responses to the TSI indices indicate that each trophi group possibly responds to environments such as the combinations of water-quality variables in different ways. In other words, analysis based on trophi can be a useful tool for a functional-based approach to extract major environmental driving forces affecting the rotifer community structure. For example, trophi 2 can be considered as the indicator of benthic–pelagic coupling, and trophi 4 as prey–predator interaction within the rotifer community, rather than water quality and overall eutrophication.
Not only good bioindicators that can reflect the state of an environment but also ‘good ecological indicators’ sensitive to identified environmental stressors are required (McGEOCH 1998). The use of a functional group may provide insight into the mechanisms behind the distribution of organisms along gradients of stressor intensities and ecological processes affecting the structure and function of the community (Lange et al. 2014). Along the responses of rotifer functional groups to water quality, we can speculate the possibility of the application of rotifer functional groups as bioindicators and ecological indicators based on their regularity and simplicity throughout the multivariate analyses.
However, our limited sample number and water-quality parameters suggest the necessity of further analyses considering habitat variability and parameters representing the detail food environments of the given habitats based on our new approach using rotifer functional group as indicators for water environments.
Acknowledgements
This study was performed under the project of ‘Nationwide Aquatic Ecological Monitoring Program’ and ‘Establishing an Aquatic Ecosystem Health Network’ in South Korea, and was supported by the Ministry of Environment and the National Institute of Environmental Research, South Korea.
Disclosure statement
No potential conflict of interest was reported by the authors.
References
- Ahn DH, Han SK, Jo SJ, Lim M. 2013. Water quality assessment for geumgang river area using the Korean trophic state index. KSWST. 21:13–20. [Google Scholar]
- Antonio JGN, Lidiane CS, Angelo AS, Odete R. 2014. Zooplankton communities as eutrophication bioindicators in tropical reservoirs. Biota Neotropi. 14:e20140018. [Google Scholar]
- Chang KH, Doi H, Nishibe Y, Nakano S. 2010. Feeding habits of omnivorous Asplanchan: comparison of diet composition among Asplanchna herricki, A. priodonta and A. girodi in pond ecosystems . J Limnol. 69:209–216. doi: 10.4081/jlimnol.2010.209 [DOI] [Google Scholar]
- Choi JW, La GH, Kim SK, Jeong KS, Joo GJ. 2013. Zooplankton community distribution in aquatic plants zone: influence of epiphytic rotifers and cladocerans in accordance with aquatic plants cover and types. Korean J Ecol Environ. 46:86–93. doi: 10.11614/KSL.2013.46.1.086 [DOI] [Google Scholar]
- Clarke KR, Warwick RM. 1994. An approach to statistical analysis and interpretation. Change in Marine communities. Plymouth: Primer-e Ltd, Plymouth Marine Laboratory. [Google Scholar]
- Cummins KW. 1973. Trophic relations of aquatic insects. Ann Rev Entomo. 18:183–206. doi: 10.1146/annurev.en.18.010173.001151 [DOI] [Google Scholar]
- Fischer C, Ahlrichs WH. 2011. Revisiting the Cephalodella trophi types. Hydrobiologia. 662:205–209. doi: 10.1007/s10750-010-0497-z [DOI] [Google Scholar]
- Gannon JE, Stemberger RS. 1978. Zooplankton (especially crustaceans and rotifers) as indicators of water quality. Trans Amer Micros Soc. 97:16–35. doi: 10.2307/3225681 [DOI] [Google Scholar]
- Gutkowska A, Paturej E, Kowalska E. 2013. Rotifer trophic state indices as ecosystem indicators in brackish coastal waters. Oceanologia. 55:887–899. doi: 10.5697/oc.55-4.887 [DOI] [Google Scholar]
- Hillbricht-Ilkowska A. 1983. Response of planktonic rotifers to the eutrophication process and to the autumnal shift of blooms in lake Biwa, Japan. I. changes in abundance and composition of rotifers. Jap J Limnol. 44:93–106. doi: 10.3739/rikusui.44.93 [DOI] [Google Scholar]
- Hulot FD, Lacroix G, Lescher-Moutoue F, Loreau M. 2000. Functional diversity governs ecosystem response to nutrient enrichment. Nature. 405:340–344. doi: 10.1038/35012591 [DOI] [PubMed] [Google Scholar]
- Korea Ministry of Environment 2006 Measurement data for water quality. Available from: http://Water.nier.go.kr.
- Lange K, Townsend CR, Matthaei CD. 2014. Can biological traits of stream invertebrates help disentable the effects of multiple stressors in an agricultural catchment? Freshwat Biol. 59:2431–2446. doi: 10.1111/fwb.12437 [DOI] [Google Scholar]
- Legendre P, Gallagher ED. 2001. Ecologically meaningful transformations for ordination of species data. Oecologia. 129:271–280. doi: 10.1007/s004420100716 [DOI] [PubMed] [Google Scholar]
- Marbà N, Krause-Jensen D, Alcoverro T, Birk S, Pedersen A, Neto JM, Orfanidis S, Garmendia JM, Muxika I, Borja A, et al. 2013. Diversity of European seagrass indicators: patterns within and across regions. Hydrobiologia. 704:265–278. doi: 10.1007/s10750-012-1403-7 [DOI] [Google Scholar]
- May L, O’Hare M. 2005. Changes in rotifer species composition and abundance along a trophic gradient in Loch Lomond, Scotland, UK. Hydrobiologia. 546:397–404. doi: 10.1007/s10750-005-4282-3 [DOI] [Google Scholar]
- McGeoch MA. 1998. The selection, testing and application of terrestrial insects as bioindicators. Biol Rev. 73:181–201. doi: 10.1017/S000632319700515X [DOI] [Google Scholar]
- Minakshi NG, Madhuri KP. 2013. Survey of rotifers to evaluate the water quality of the river Gadhi and its reservoir. Eco Env Cons. 19:417–423. [Google Scholar]
- Norgrady T, Segers H. 2002. Guides to the identification of the microinvertebrates of the continental waters of the world, volume 6: Rotifera. Leiden: Backhuys Publishters. [Google Scholar]
- Obertegger U, Smith HA, Flaim G, Wallace RL. 2011. Using the guild ratio to characterize pelagic rotifer communities. Hydrobiologia. 662:157–162. doi: 10.1007/s10750-010-0491-5 [DOI] [Google Scholar]
- Palkovacs EP, Kinnison MT, Correa C, Dalton CM, Hendry AP. 2012. Fates beyond traits: ecological consequences of human-induced trait change. Evol Appl. 5:183–191. doi: 10.1111/j.1752-4571.2011.00212.x [DOI] [PMC free article] [PubMed] [Google Scholar]
- R Core Team 2011 R: A language and environment for statistical computing. R foundation for Statistical Computing, Vienna, Austria. Available from: http://www.R-project.org.
- Sládeček V. 1983. Rotifers as indicators of water quality. Hydrobiologia. 100:169–201. doi: 10.1007/BF00027429 [DOI] [Google Scholar]
- Sørensen MV. 2002. On the evolution and morphology of the rotiferan trophi, with a cladistic analysis of Rotifera. J Zool Syst Evol Res. 40:129–154. doi: 10.1046/j.1439-0469.2002.00188.x [DOI] [Google Scholar]
- Sørensen MV, Giribet G. 2006. A modern approach to rotiferan phylogeny: combining morphological and molecular data. Mol Phylogenet Evol. 40:585–608. doi: 10.1016/j.ympev.2006.04.001 [DOI] [PubMed] [Google Scholar]
- Wallace RL, Snell TW, Ricci C, Nogrady T. 2006. Rotifera: biology, ecology and systematics, Vol. 1, 2nd ed. Leiden: Backhuys Publishers. [Google Scholar]


