

Abstract
Background
Low-income and middle-income countries with populations that are chronically undernourished in early life are undergoing a nutrition transition and are experiencing an epidemic of cardiometabolic disease. These dual burdens are thought to be causally related; therefore, the extent to which improvements in early-life nutrition can offset adult-onset disease is important. The aim of this study was to examine whether improvement of protein-energy nutrition from conception to age 2 years can attenuate the risk of cardiometabolic disease.
Methods
We followed up a cohort of 2392 individuals born between Jan 1, 1962, and Feb 28, 1977, in four villages in Guatemala who had participated in a cluster-randomised protein-energy nutritional supplementation (Atole) trial. Of 1661 participants available for follow-up from Feb 26, 2015, to April 29, 2017, we studied 684 women and 455 men. We assessed cardiometabolic disease risk at ages 37–54 years using anthropometry, fasting and post-challenge glucose, fasting lipid concentrations, and blood pressure. We used generalised linear and logistic regression modelling to estimate the effect of Atole from conception to age 2 years (the first 1000 days) on cardiometabolic disease risk.
Findings
Exposure to Atole from conception to age 2 years was associated with increased fatness (body-mass index [1·29 kg/m², 95% CI 0·08 to 2·50], body fat [1·73%, 0·20 to 3·26], and obesity [odds ratio 1·94, 1·11 to 3·40]), diastolic blood pressure (1·59 mm Hg, –0·74 to 3·92), and blood lipids (total cholesterol [10·10 mg/dL, 0·80 to 19·40] and non-HDL cholesterol [10·41 mg/dL, 1·51 to 19·31]), reduced post-challenge glucose (–5·84 mg/dL, –12·51 to 0·83), and reduced odds of diabetes (odds ratio 0·46, 0·21 to 0·97). We found stratum heterogeneity by sex in pooled models for non-HDL cholesterol (4·34 mg/dL, 95% CI –6·86 to 15·55 for women vs 19·84 mg/dL, 5·86 to 33·82 for men) and post-challenge glucose (–0·19 mg/dL, –8·63 to 8·24 for women vs –13·10 mg/dL, –23·64 to –2·56 for men). p values for interaction of sex and exposure to Atole from conception to age 2 years were 0·09 and 0·04, respectively.
Interpretation
Improved protein-energy nutrition from conception to the 2nd birthday reduced the odds of diabetes at ages 37–54 years; however, this protein-energy supplementation also increased the risk of obesity and several obesity-related conditions. Our findings suggest a mixed ability of protein-energy nutritional supplementation in early life to prevent adult cardiometabolic disease incidence in the context of high childhood stunting and high adult overweight and obesity.
Introduction
The period from conception to age 2 years (the first 1000 days) is a time of rapid development and is a crucial window in which later health can be affected.1 Inadequate nutrition and impaired development in utero and during early life are thought to increase the risk of cardiometabolic disease in adulthood via alterations in the structure or size of organs that can permanently impair tissue function.2 Birth size (a proxy for fetal growth) has been positively associated with adiposity, obesity, type 2 diabetes, lipid profile, and blood pressure in later life.3–6 These outcomes are common when early-life nutritional deprivation is paired with later-life nutritional abundance.7
Much of the evidence on the effect of inadequate nutrition on health in later life has drawn from studies of the long-term consequences of acute famine exposure.8–12 In some studies, exposure to famine during gestation has been associated with obesity, reduced glucose tolerance, and an atherogenic lipid profile.13 However, not all famine episodes have been found to produce adverse health effects in later life. A review14 concluded that health effects commonly attributed to the Great Chinese Famine can be explained by uncontrolled effects of age. The Leningrad Siege Study10 found no association between exposure to early-life starvation and later-life hypertension, dyslipidaemia, or glucose tolerance.1
More common than exposure to famine is chronic undernutrition in childhood,15 followed by adult-onset obesity in the context of an obesogenic environment and epidemic levels of cardiometabolic disease.16,17 However, the causal effect of this pattern of malnutrition on adult health has not been widely examined. To date, most studies have been observational and are thus only able to assess associations between undernutrition and adult disease. The extent to which improvements in early-life nutrition can offset the risk of adult-onset disease incidence in the context of the nutrition transition is of crucial importance.
We followed up a cohort of individuals who had participated as children in a protein-energy nutritional-supplementation trial in Guatemala. We assessed whether the exposure to a protein-energy nutritional supplement from conception to age 2 years was associated with cardiometabolic disease risk in midlife.
Methods
Study population
From Jan 1, 1969, to Feb 28, 1977, the Institute of Nutrition of Central America and Panama (INCAP) did an intervention trial in southeastern Guatemala to assess the effect of improved nutrition on child growth and development. Two sets of matched villages in El Progreso were randomly assigned to Atole, a nutritional supplement made from dry skimmed milk, sugar, and Incaparina (a vegetable protein mixture developed by INCAP [6·4 g protein per 100 mL, 0·4 g fat per 100 mL, 90 kcal per 100 mL]), or Fresco, a low-energy beverage made from sugar and water (all calories from sugar; 33 kcal per 100 mL). Fresco was fortified to match the micronutrient content of Atole in equal quantities by volume. The supplements were available to all individuals in a central location in each village twice daily. Children could have been exposed prenatally through maternal supplement intake as well as postnatally through breastmilk or the child’s own consumption. All children younger than 7 years at study launch were recruited, newborn children were added to the study at birth, and women were recruited as soon as pregnancy was identified during routine 2-weekly morbidity surveillance. Supplement intakes were recorded for pregnant and lactating women and children younger than 7 years; however, the supplement was available to all individuals in the village regardless of age and sex. 2392 children were followed up to study end, death before study end, or age 7 years, whichever came first. Full details of the original trial are published elsewhere.18
The 2015–17 follow-up study was designed to test the hypothesis that improvement of early-life protein-energy nutrition can attenuate the development of cardiometabolic disease risk. By Feb 26, 2015, of 2392 participants, 369 (15%) in the original trial had died (most in early childhood), 249 (10%) had migrated outside of Guatemala, and 113 (5%) were untraceable, resulting in 1661 (69%) who were presumed alive and living in Guatemala and were eligible for enrolment. Of these, 1161 (70%) provided informed consent (figure), 16 (1%) did not attend the clinical examination, and six (<1%) were pregnant or lactating. Of 1139 individuals, at least one outcome measure was obtained from 684 (60%) women and 455 (40%) men aged 37–54 years. Characteristics of individuals who were lost to follow-up and those who participated in the 2015–17 follow-up study are presented in appendix. With the exception of sex, characteristics were similar across groups.
Figure: Trial profile.
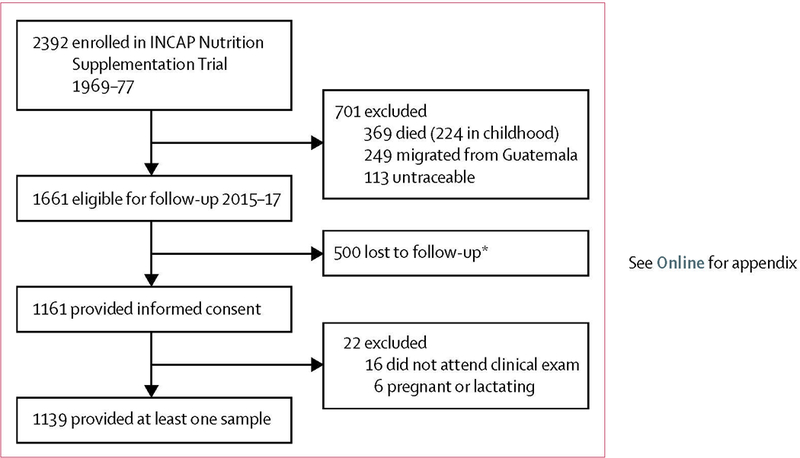
INCAP=Institute of Nutrition of Central America and Panama. *Declined to participate or could not be contacted.
Data collection
In the original trial, study staff collected data at INCAP facilities in the study villages or in participants’ homes. Information on maternal characteristics, including the number of completed grades of schooling and household characteristics, such as quality of housing and ownership of consumer durables, were ascertained by interview. Maternal height was measured to 0·1 cm.
In 2015–17, study staff collected data at INCAP facilities in the original study villages, at a facility in the nearby town of Sanarate, in participants’ homes, and at INCAP headquarters in Guatemala City. Data on participants’ lifestyles, socioeconomic status, completed grades of schooling, residence, and use of medications for dyslipidaemia, hypertension, or diabetes were collected by interview.
Trained field workers collected all anthropometric measurements using standard procedures. Height with out shoes and waist circumference were measured to the nearest 0·1 cm and weight in an examination gown was measured to the nearest 100 g. All measurements were taken twice; if the difference exceeded 500 g for weight, 0·5 cm for height, or 1 cm for waist circumference, a third measurement was taken. The average of the closest two measurements was used. To calculate percentage body fat, we estimated the total body water by using the deuterium oxide dilution technique. Using saliva samples collected before and after a measured deuterium oxide dose, we calculated fat-free mass from total body water assuming that fat-free mass has a hydration constant of 0·732; fat mass was the difference between body mass and fat-free mass.19
Trained phlebotomists drew fasting venous blood samples and venous blood samples 120 min after a prandial challenge. No participants reported a fasting time of less than 10 h. Triglycerides, total cholesterol, HDL cholesterol, LDL cholesterol, glycated haemoglobin, fasting blood glucose, and 2-h post-challenge glucose were measured by enzymatic colorimetric methods (Cobas C111 analyzer, ROCHE, Indianapolis, IN, USA).
Physicians measured seated blood pressure on the left arm three times at 3-min intervals using a digital blood pressure monitor (Omron, Schaumburg, IL, USA) with the left arm resting on a table at heart level after a 5-min rest. Physicians used one of three cuff sizes on the basis of each participant’s arm size. If systolic or diastolic blood pressure measurements differed by more than 10 mm Hg, then a fourth measure was taken and the average of the two closest measurements was used; otherwise, the average of the second and third measurements was used.
All data collection followed protocols that were approved by the Institutional Review Boards of Emory University (Atlanta, GA) and INCAP (Guatemala City, Guatemala). All participants gave written informed consent.
Variable specification
Supplement type (Atole or Fresco) was based on birth village. Age of exposure was determined on the basis of the child’s date of birth (assuming a gestation of 266 days) and the date of trial start (Jan 1, 1969, in two villages, and May 1, 1969, in the other two villages) and end (Feb 28, 1977, in all villages). Participants born in the first two villages between Sept 24, 1969, and Feb 28, 1975, and those born in the other two villages between Jan 22, 1970, and Feb 28, 1975, were considered exposed from conception to age 2 years. Children born in the first two villages before Sept 24, 1969, and those born before Jan 22, 1970, in the other two villages were considered to not have been exposed during the full gestation period, whereas those born after Feb 28, 1975, were not exposed up to age 24 months. These definitions mean that a child exposed for some of the first 1000 days was treated as not exposed, which might attenuate any estimated effects. We also computed a three-category definition of exposure—namely, exposed for the whole of the first 1000 days, exposed for part of the first 1000 days, and not exposed at all in the first 1000 days.
Body-mass index (BMI) was calculated as weight (kg) divided by height (m) squared. Obesity was defined as a BMI of 30·0 kg/m² or more.20 Waist-to-height ratio was calculated as waist circumference (cm) divided by height (cm). Non-HDL cholesterol, comprised of LDL cholesterol, intermediate-density lipoprotein, and VLDL, captures the full complement of major atherogenic lipoproteins.21 We calculated non-HDL cholesterol by subtracting HDL cholesterol from total cholesterol. We defined diabetes as a fasting plasma glucose of 126 mg/dL or more, post-challenge glucose of 200 mg/dL or more, or use of diabetes medication.22 Hypertension was defined according to the Seventh Report of the Joint National Committee on Prevention, Detection, Evaluation, and Treatment of High Blood Pressure as a systolic blood pressure of 140 mm Hg or higher, a diastolic blood pressure of 90 mm Hg or higher, or use of anti-hyper tensive medication.23 Metabolic syndrome was defined according to the National Cholesterol Education Program Adult Treatment Panel III diagnostic criteria as the presence of at least three of the following: central obesity (waist circumference of more than 88 cm for women and more than 102 cm for men); fasting glucose of at least 100 mg/dL or use of diabetes medication; triglycerides of at least 150 mg/dL or statin use; HDL cholesterol less than 40 mg/dL in men or less than 50 mg/dL in women; and blood pressure of 130 mm Hg systolic or higher, 85 mm Hg diastolic or higher, or use of hypertension medication.23
We developed scores for socioeconomic status separately in childhood (1967–77) and adulthood (2015–17) using principal components analyses of household characteristics and consumer durable goods measured in household surveys of participants’ households. We divided socioeconomic status into tertiles and categorised residence as Guatemala City versus other.
Statistical analysis
To examine whether improvement of protein-energy nutrition from conception to age 2 years can attenuate the development of cardiometabolic disease risk by affecting cardiometabolic profiles, we estimated the difference-in-difference intent-to-treat effect.24 The difference-in-difference method estimates the effect of Atole relative to Fresco during the crucial age window, net of the differences attributable to village-level differences or other period or cohort effects. We used generalised linear and logistic regression models for continuous outcomes (BMI, waist circumference, waist-to-height ratio, body fat, triglycerides, total chol esterol, HDL cholesterol, non-HDL cholesterol, glycated haemoglobin, fasting blood glucose, 2-h post-challenge glucose, and systolic and diastolic blood pressure) and dichotomous outcomes (obesity, diabetes, hypertension, and metabolic syndrome), respectively.
The base model (model 1) included three dummy variables to account for fixed effects of birth village and treatment assignment (Atole vs Fresco), a variable for age of exposure (exposure from conception to age 2 years vs other), and the interaction between treatment assignment and age of exposure, as well as birth year to control for the age range of the study sample. Analyses focused on the estimate and significance of the interaction term. In model 2, we added baseline characteristics including socioeconomic status in childhood, maternal age at the birth of the child, maternal height, and maternal grades of schooling. In model 3, we added adult factors including socioeconomic status in 2015–17, completed grades of schooling, and residence. To assess the potential mediating influence of adult anthropometry on blood glucose, blood lipids, and blood pressure, we added BMI and waist-to-height ratio to model 4. Because height is a major determinant of blood pressure, all models for blood pressure, hypertension, and metabolic syndrome also controlled for height. All models for continuous blood pressure and blood glucose controlled for hypertension and use of diabetes medication, respectively. To assess potential sex differences in the physiological and behavioural responses to early-life nutrition, we developed sex-specific and pooled models. Pooled models were adjusted for sex. We tested for stratum heterogeneity by sex through testing the interaction term between sex and the interaction term for supplement type and age of exposure (ie, exposure to Atole from conception to age 2 years). Because most participants had at least one sibling in the trial, we used generalised estimating equations to adjust standard errors for within-family correlations. We used Harrell’s C statistic to evaluate the model’s goodness of fit for the logistic regression analyses.
Each model included all participants with the outcome variable of interest. No participants were missing data on the exposure variables of interest, childhood or adult socioeconomic status, or residence. Of 1139 women, 239 (21%) were missing data for maternal height, 41 (4%) for maternal grades of schooling, 35 (3%) for study participant’s total completed grades of schooling, and 20 (2%) for maternal age. For missing covariates, we imputed sex-specific medians for continuous variables and sex-specific modes for discrete variables. We included dummy variables, coded as 1 if the variable was missing or 0 otherwise, to account for the measurement error in the imputed covariates.
Because some participants in the reference group were partly exposed to the intervention from conception to age 2 years, we did sensitivity analyses using a three-level exposure variable: exposure to Atole during the full period of conception to age 2 years; exposure to Atole during a partial period from conception to age 2 years; and no exposure to Atole from conception to age 2 years. As a counterfactual, we also compared those exposed to Atole during the full period of ages 36–72 months. To assess the potential effect of attrition on internal validity in our study, we created a dichotomous variable for attrition (attrited vs participated in the 2015–17 follow-up study), and ran models 1 and 2 with attrition status as the outcome of interest.
We did all analyses in SAS version 9.4 using the PROC GENMOD procedure. Statistical significance was set a priori at p<0·05. All p values were two-sided.
Role of the funding source
The funder of the study had no role in study design, data collection, data analysis, data interpretation, or writing of the report. The corresponding author had full access to all the data in the study and had final responsibility for the decision to submit for publication.
Results
Of 1139 participants in the study sample, 684 (60%) were women (table 1). 139 (20%) of 684 women and 86 (19%) of 455 men were exposed to Atole during the full first 1000 days. Additional tables of sociodemographic characteristics by supplement type and timing of exposure to the intervention are presented in the appendix. The results of models 1, 2, and 3 were statistically indistinguishable; therefore, we focused on the findings from model 3 and (where appropriate) model 4. Results from all models are presented in the appendix.
Table 1:
Selected characteristics of the study population by sex
| Women (n=684) |
Men (n=455) |
Pooled (n=1139) |
||||
|---|---|---|---|---|---|---|
| n | Characteristic | n | Characteristic | n | Characteristic | |
| Age at follow-up, years | 684 | 45·0 (41·0–49·0) | 455 | 45·0 (42·0–48·0) | 1139 | 45·0 (41·0–48·0) |
| Exposed to Atole from conception to age 2 years | 684 | 139 (20%) | 455 | 86 (19%) | 1139 | 225 (20%) |
| Childhood household socioeconomic status | 684 | −0·02 (–0·56 to 0·46) | 455 | 0·02 (–0·51 to 0·46) | 1139 | −0·02 (–0·52 to 0·46) |
| Maternal age, years | 671 | 26·0 (21·0–32·0) | 448 | 26·0 (21·0–33·0) | 1119 | 26·0 (21·0–32·0) |
| Maternal height, cm | 543 | 148·7 (145·3–152·2) | 357 | 148·7 (146·0–152·6) | 900 | 148·7 (145·4–152·3) |
| Maternal schooling, years | 665 | 0·0 (0·0–2·0) | 433 | 1·0 (0·0–2·0) | 1098 | 1·0 (0·0–2·0) |
| Residing in Guatemala City | 684 | 124 (18%) | 455 | 84 (18%) | 1139 | 208 (18%) |
| Socioeconomic status tertile | ||||||
| Poorest | 684 | 220 (32%) | 455 | 158 (34%) | 1139 | 378 (33%) |
| Middle | 684 | 241 (35%) | 455 | 135 (30%) | 1139 | 376 (33%) |
| Wealthiest | 684 | 223 (33%) | 455 | 162 (36%) | 1139 | 385 (34%) |
| Total grades completed | 667 | 4·0 (2·0–6·0) | 437 | 6·0 (2·0–6·0) | 1104 | 4·0 (2·0–6·0) |
| Height, cm | 683 | 151·5 (148·0–155·1) | 454 | 164·2 (159·8–167·9) | 1137 | 155·4 (145·4–152·3) |
| BMI, kg/m² | 683 | 28·7 (25·6–32·2) | 454 | 26·3 (23·6–29·0) | 1137 | 27·7 (24·8–31·0) |
| Obesity | 683 | 276 (40%) | 454 | 85 (19%) | 1137 | 361 (32%) |
| Waist circumference, cm | 683 | 100·2 (93·3–108·3) | 454 | 93·5 (87·3–100·6) | 1137 | 97·5 (90·5–105·5) |
| Waist-to-height ratio | 683 | 0·66 (0·62–0·72) | 454 | 0·57 (0·53–0·61) | 1137 | 0·62 (0·58–0·68) |
| Body fat, % | 662 | 42·4% (38·9–46·1) | 435 | 29·2% (24·7–33·3) | 1097 | 37·9% (30·7–43·7) |
| Triglycerides, mg/dL | 670 | 203·3 (153·9–275·5) | 435 | 204·3 (148·7–289·4) | 1105 | 203·3 (151·0–278·7) |
| Total cholesterol, mg/dL | 670 | 187·7 (164·2–213·2) | 435 | 178·1 (151·4–200·8) | 1105 | 184·3 (159·2–209·3) |
| HDL cholesterol, mg/dL | 670 | 35·5 (29·8–42·7) | 435 | 32·5 (26·3–40·6) | 1105 | 34·4 (28·4–42·0) |
| Non-HDL cholesterol, mg/dL | 670 | 151·0 (128·3–174·4) | 435 | 144·0 (118·3–168·1) | 1105 | 148·8 (124·2–171·8) |
| Glycated haemoglobin, % | 672 | 5·9% (5·6–6·2) | 435 | 5·7% (5·5–6·0) | 1107 | 5·8% (5·5–6·1) |
| Fasting blood glucose, mg/dL | 670 | 100·0 (93·2–109·6) | 435 | 97·9 (93·1–104·2) | 1105 | 99·0 (93·1–107·4) |
| 2-h post-challenge glucose, mg/dL* | 608 | 117·3 (103·9–132·2) | 415 | 101·8 (90·3–117·3) | 1023 | 111·4 (97·5–126·2) |
| Systolic blood pressure, mm Hg | 683 | 120·5 (112·5–132·0) | 455 | 122·0 (113·5–131·0) | 1138 | 121·0 (113·0–131·5) |
| Diastolic blood pressure, mm Hg | 683 | 73·0 (67·5–80·5) | 455 | 73·0 (66·5–79·0) | 1138 | 73·0 (67·0–80·0) |
| Pre-hypertension† | 683 | 263 (39%) | 455 | 230 (51%) | 1138 | 493 (43%) |
| Hypertension | 683 | 127 (19%) | 455 | 32 (7%) | 1138 | 159 (14%) |
| Pre-diabetes‡ | 670 | 245 (37%) | 435 | 139 (32%) | 1105 | 384 (34%) |
| Diabetes | 670 | 112 (17%) | 435 | 39 (9%) | 1105 | 151 (14%) |
| Metabolic syndrome | 669 | 523 (78%) | 435 | 167 (38%) | 1104 | 690 (63%) |
| Components of metabolic syndrome | ||||||
| Central obesity | 683 | 614 (90%) | 454 | 95 (21%) | 1137 | 709 (62%) |
| High fasting blood glucose or medication use | 670 | 340 (51%) | 435 | 175 (40%) | 1105 | 515 (47%) |
| High triglycerides or statin use | 670 | 520 (78%) | 435 | 324 (74%) | 1105 | 844 (76%) |
| Low HDL cholesterol | 670 | 589 (88%) | 435 | 320 (74%) | 1105 | 909 (82%) |
| High blood pressure or medication use | 683 | 240 (35%) | 455 | 133 (29%) | 1138 | 373 (33%) |
Data are median (IQR) or n (%). BMI=body-mass index.
Meal challenge was limited to participants without known diabetes and who had a fasting blood glucose less than 180 mg/dL.
The Seventh Report of the Joint National Committee on Prevention, Detection, Evaluation, and Treatment of High Blood Pressure defines pre-hypertension as a systolic blood pressure of 120–139 mm Hg or a diastolic blood pressure of 80–89 mm Hg among participants not reporting use of hypertension medication.
Pre-diabetes is defined according to the American Diabetes Association diagnostic criteria as a fasting plasma glucose of 100–125 mg/dL or 2-h post-challenge glucose of 140–199 mg/dL among participants not reporting use of diabetes medication.
We found some evidence of stratum heterogeneity by sex in pooled models for non-HDL cholesterol and post-challenge glucose (p values for the interaction of sex and exposure to Atole from conception to age 2 years were 0·09 and 0·04, respectively). Because the effect estimates of exposure to Atole from conception to age 2 years differed only in magnitude and not in direction for men and women, we focused on the results of the pooled, sex-adjusted model.
Exposure to Atole from conception to age 2 years was positively associated with measures of fatness: BMI (1·29 kg/m², 95% CI 0·08 to 2·50), body fat (1·73%, 0·20 to 3·26; table 2) and obesity (odds ratio [OR] 1·94, 95% CI 1·11 to 3·40; table 3). Exposure to Atole from conception to age 2 years was associated with a more atherogenic blood lipid profile, most of which was mediated through body composition. However, for total cholesterol and non-HDL cholesterol, the difference-in-difference estimate remained significant after con trolling for BMI and waist-to-height ratio (10·10 mg/dL, 95% CI 0·80 to 19·40 for total cholesterol and 10·41 mg/dL, 1·51 to 19·31 for non-HDL cholesterol) in model 4. Exposure to Atole from conception to age 2 years was marginally associated with increased diastolic blood pressure in pooled models controlling for baseline covariates and adult mediating factors (2·28 mm Hg, 95% CI –0·14 to 4·69), with a stronger effect among men than women (3·50 mm Hg, 0·20 to 6·79 vs 1·61 mm Hg, –1·72 to 4·94). However, the association was attenuated with adjustment for body composition (1·59 mm Hg, 95% CI –0·74 to 3·92) in model 4. Exposure to Atole from conception to age 2 years was inversely associated with prevalence of diabetes (OR 0·46, 95% CI 0·21 to 0·97): this estimate was not attenuated with adjustment for body composition. Exposure to Atole from conception to age 2 years was associated with increased prevalence of central obesity (OR 2·53, 95% CI 1·18 to 5·43) but not with metabolic syndrome or other metabolic syndrome components (appendix). We did not find evidence that attrition status was differential with respect to exposure to Atole from conception to age 2 years in the base models (OR 1·03, 95% CI 0·73 to 1·44 for sex-pooled analyses) or in models controlling for baseline covariates (OR 1·05, 0·75 to 1·48 for sex-pooled analyses, p>0·7 for all comparisons; model 2).
Table 2:
Difference-in-difference estimates for exposure to Atole from conception to age 2 years versus other, by cardiometabolic risk factor
| Women |
Men |
Pooled |
||||
|---|---|---|---|---|---|---|
| β (95% CI) | p value | β (95% CI) | p value | β (95% CI) | p value | |
| BMI, kg/m² | ||||||
| Model 3 | 1·35 (−0·33 to 3·03) | 0·1 | 1·19 (−0·41 to 2·80) | 0·1 | 1·29 (0·08 to 2·50) | 0·03 |
| Waist circumference, cm | ||||||
| Model 3 | 2·52 (−1·40 to 6·44) | 0·2 | 3·22 (−0·88 to 7·33) | 0·1 | 2·86 (−0·04 to 5·77) | 0·05 |
| Waist-to-height ratio | ||||||
| Model 3 | 0·02 (−0·007 to 0·04) | 0·1 | 0·01 (−0·01 to 0·04) | 0·3 | 0·02 (−0·003 to 0·03) | 0·09 |
| Body fat, % | ||||||
| Model 3 | 1·24% (−0·46 to 3·27) | 0·1 | 2·55% (−0·02 to 5·11) | 0·05 | 1·73% (0·20 to 3·26) | 0·02 |
| Triglycerides, mg/dL | ||||||
| Model 3 | −2·45 (−36·55 to 31·66) | 0·8 | 28·04 (−35·79 to 91·88) | 0·3 | 9·29 (−22·94 to 41·54) | 0·5 |
| Model 4 | −5·42 (−38·95 to 28·10) | 0·7 | 10·49 (−48·47 to 69·46) | 0·7 | 2·27 (−28·78 to 33·32) | 0·8 |
| Total cholesterol, mg/dL | ||||||
| Model 3 | 4·48 (−7·37 to 16·33) | 0·4 | 20·91 (6·25 to 35·58) | 0·005 | 10·54 (1·19 to 19·88) | 0·02 |
| Model 4 | 4·32 (−7·51 to 16·15) | 0·4 | 19·69 (5·20 to 34·17) | 0·007 | 10·10 (0·80 to 19·40) | 0·03 |
| HDL cholesterol, mg/dL | ||||||
| Model 3 | −0·56 (−4·05 to 2·92) | 0·7 | −1·53 (−5·55 to 2·49) | 0·4 | −1·14 (−3·82 to 1·54) | 0·4 |
| Model 4 | −0·02 (−3·38 to 3·33) | 0·9 | −0·15 (−3·91 to 3·61) | 0·9 | −0·31 (−2·86 to 2·24) | 0·8 |
| Non-HDL cholesterol, mg/dL | ||||||
| Model 3 | 5·04 (−5·23 to 16·31) | 0·3 | 22·45 (8·02 to 36·87) | 0·002 | 11·67 (2·64 to 20·70) | 0·01 |
| Model 4 | 4·34 (−6·86 to 15·55) | 0·4 | 19·84 (5·86 to 33·82) | 0·005 | 10·41 (1·51 to 19·31)* | 0·02 |
| Glycated haemoglobin, % | ||||||
| Model 3 | −0·23% (−0·70 to 0·25) | 0·3 | 0·06% (−0·43 to 0·56) | 0·7 | −0·09% (−0·45 to 0·26) | 0·6 |
| Model 4 | −0·24% (−0·71 to 0·23) | 0·3 | 0·0001% (−0·47 to 0·47) | 0·9 | −0·12% (−0·47 to 0·22) | 0·4 |
| Fasting glucose, mg/dL | ||||||
| Model 3 | −7·48 (−21·21 to 6·24) | 0·2 | 3·92 (−8·93 to 16·78) | 0·5 | −2·53 (−12·49 to 7·42) | 0·6 |
| Model 4 | −7·70 (−21·33 to 5·93) | 0·2 | 2·21 (−9·68 to 14·11) | 0·7 | −3·11 (−12·85 to 6·63) | 0·5 |
| 2-h post-challenge glucose, mg/dL | ||||||
| Model 3 | 0·82 (−7·69 to 8·04) | 0·8 | −12·06 (−23·07 to −1·04) | 0·03 | −4·80 (−11·60 to 2·00)* | 0·1 |
| Model 4 | −0·19 (−8·63 to 8·24) | 0·9 | −13·10 (−23·64 to −2·56) | 0·01 | −5·84 (−12·51 to 0·83)* | 0·08 |
| Systolic blood pressure, mm Hg | ||||||
| Model 3 | 3·54 (−1·95 to 9·03) | 0·2 | 2·40 (−2·67 to 7·46) | 0·3 | 2·89 (−0·99 to 6·78) | 0·1 |
| Model 4 | 2·86 (−2·52 to 8·25) | 0·2 | 0·90 (−3·90 to 5·69) | 0·7 | 1·98 (−1·80 to 5·77) | 0·3 |
| Diastolic blood pressure, mm Hg | ||||||
| Model 3 | 1·61 (−1·72 to 4·94) | 0·3 | 3·50 (0·20 to 6·79) | 0·03 | 2·28 (−0·14 to 4·69) | 0·06 |
| Model 4 | 1·06 (−2·18 to 4·30) | 0·5 | 2·49 (−0·66 to 5·64) | 0·1 | 1·59 (−0·74 to 3·92) | 0·1 |
For women and men respectively, sample sizes were 683 and 454 for body-mass index (BMI), waist circumference, and waist-height ratio, 662 and 435 for body fat, 670 and 435 for triglycerides, total cholesterol, HDL cholesterol, non-HDL cholesterol, and fasting blood glucose, 672 and 435 for glycated haemoglobin, 608 and 415 for 2-h post-challenge glucose, and 683 and 455 for systolic and diastolic blood pressure. CIs account for clustering at the mother level.
p<0·10 for the interaction of sex and exposure to Atole from conception to age 2 years.
Table 3:
Difference-in-difference estimates for Atole exposure from conception to age 2 years versus other predicting obesity, hypertension, diabetes, and metabolic syndrome
| Women |
Men |
Pooled |
|||||||
|---|---|---|---|---|---|---|---|---|---|
| Odds ratio (95% CI) | p value | C statistic | Odds ratio (95% CI) | p value | C statistic | Odds ratio (95% CI) | p value | C statistic | |
| Obesity | |||||||||
| Model 3 | 1·88 (0·97–3·66) | 0·06 | 0·61 | 1·86 (0·56–6·18) | 0·3 | 0·72 | 1·94 (1·11–3·40) | 0·01 | 0·68 |
| Diabetes | |||||||||
| Model 3 | ··* | ·· | ·· | 0·16 (0·02–0·99) | 0·04 | 0·78 | 0·45 (0·21–0·96) | 0·03 | 0·68 |
| Model 4 | ··* | ·· | ·· | 0·17 (0·03–1·09) | 0·06 | 0·79 | 0·46 (0·21–0·97) | 0·04 | 0·70 |
| Hypertension | |||||||||
| Model 3 | 1·17 (0·48–2·85) | 0·7 | 0·69 | 3·31 (0·61–17·75) | 0·1 | 0·74 | 1·35 (0·61–2·97) | 0·4 | 0·71 |
| Model 4 | 1·15 (0·47–2·80) | 0·7 | 0·73 | 3·06 (0·45–20·89) | 0·2 | 0·81 | 1·31 (0·59–2·91) | 0·5 | 0·76 |
| Metabolic syndrome | |||||||||
| Model 3 | 1·48 (0·60–3·26) | 0·3 | 0·65 | 1·15 (0·47–2·79) | 0·7 | 0·68 | 1·27 (0·71–2·27) | 0·4 | 0·75 |
| Model 4 | 1·22 (0·55–2·72) | 0·6 | 0·77 | 0·59 (0·19–1·82) | 0·3 | 0·86 | 0·88 (0·47–1·65) | 0·6 | 0·86 |
For women and men respectively, sample sizes were 670 and 435 for diabetes, 683 and 455 for hypertension, and 669 and 435 for metabolic syndrome. CIs account for clustering at the mother level. C statistic values higher than 0·70 indicate a good model.
Maximum likelihood estimation resulted in a non-positive definite solution.
In sensitivity analyses, we tested models in which we differentiated between those participants with no exposure to the nutritional supplements from conception to age 2 years and those with partial exposure. When participants with no exposure were considered as the reference, the models were similar (appendix), whereas results for individuals with partial exposure generally had estimates closer to the null than results for those with full exposure. In analyses comparing participants exposed to Atole at age 36–72 months with those exposed to either supplement at other ages, estimates for those exposed to Atole at 36–72 months generally had the opposite sign or were on the opposite side of the null relative to estimates for those exposed from conception to age 2 years (appendix).
Discussion
Using experimental data from a longitudinal cohort, we estimated the intent-to-treat effect of a protein-energy nutritional supplement from conception to age 2 years on cardiometabolic disease risk in Guatemalan adults. To our knowledge, our study is the first to examine the effect of a nutritional-supplementation intervention from conception to age 2 years on cardiometabolic disease risk in midlife. We found mixed effects, both detrimental and beneficial, on the cardiometabolic-disease risk profile. Exposure to Atole from conception to age 2 years increased adiposity and caused a more atherogenic blood–lipid profile (total cholesterol and non-HDL cholesterol). Conversely, exposure to Atole from conception to age 2 years had a strong inverse association with diabetes that was not mediated through measures of adiposity. Overall, evidence from this cohort suggests a mixed ability of protein-energy nutritional supplementation to prevent adult cardio metabolic disease incidence in contexts of chronic childhood undernutrition and an obesogenic adult environment.
Exposure to Atole from conception to age 2 years was associated with reduced post-challenge blood glucose in men and reduced odds of diabetes in both sexes. In previous studies in this cohort, Conlisk and colleagues25 reported reduced fasting plasma glucose concentrations among participants exposed to Atole in early life and Stein and colleagues26 did not show increases in prevalence of cardiovascular disease risk factors. However, both studies were limited by reliance on a single capillary blood sample, the absence of a glucose challenge, and the young age of the cohort used at follow-up.
Inadequate nutrition in early life, leading to abnor malities in the number or function of pancreatic β cells, could help to explain the link between childhood malnutrition and adult diabetes risk.27 In animal models, protein deficiency induced during fetal development has been associated with reduced β cell mass and impaired insulin secretion.28,29 Among children aged 15–36 months, Atole added an average of 10 g of protein per day to the regular intake of 19 g per day from other dietary sources.30 Furthermore, no evidence suggests that Atole appreciably displaced home diet.31 Although increased adiposity is positively correlated with blood glucose, nutritional supplementation from conception to age 2 years was strongly associated with reduced odds of diabetes despite its positive association with fatness. Our findings suggest that protein-energy nutritional supplementation at levels sufficient to improve linear growth could reduce diabetes.
These data also indicate that exposure to Atole from conception to age 2 years increased adult adiposity. Atole exposure was inversely associated with fat folds in childhood, suggesting that increased weight among children exposed to Atole was probably due to lean mass rather than fat mass.30 Adair and colleagues for the COHORTS group,32 a group of five low-income and middle-income country cohorts that includes the INCAP cohort, found rapid early-life linear growth increased fat mass and fat free mass in adulthood but contributed more to lean mass than fat mass.
On average, those exposed to Atole from conception to age 2 years had a BMI that was 1·29 kg/m² higher than participants who were exposed to Fresco or those who were exposed to Atole at other ages, and had a 2·68 times increase in the odds of central obesity. Even moderate increases in adiposity are associated with an increased risk of cardiovascular disease.33 A study from the USA reported that each 5-kg increase in bodyweight during early and middle adulthood was associated with a 30% increased risk of type 2 diabetes and a 14% increased risk of hypertension.34 Thus, the potential significance of the effect of Atole on fatness, especially abdominal fatness, should not be understated.
The differences between our findings and those from famine studies8–14 highlight the potential heterogeneity in the physiological response to severe acute versus moderate non-wasting undernutrition. The mothers in the original trial were short but not underweight. Similarly, of children measured at age 24 months, 90% exposed to Fresco were stunted (height-for-age Z scores <–2 SD), but only 3% were wasted (weight-for-height Z scores <–2 SD), which is a level of wasting expected in populations growing in accordance with international growth reference standards.
The long-term consequences for human capital of poor early-life nutrition and growth failure have been well documented in this cohort.15 Exposure to Atole in early life increased work capacity and intellectual functioning,35,36 reading comprehension and intelligence test scores in both sexes at ages 25–42 years,37 and the number of completed grades of schooling among women,36 and significantly increased wages among men aged 25–42 years.38 Although we did not elucidate the pathways, in addition to physiological causes, improved early growth and development increasing educational attainment and income might facilitate the adoption of obesogenic adult lifestyles. Future analyses could investigate whether these factors are in the causal chain.
Given the scope of potential improvements in child growth and development, adult human capital, and diabetes prevention, the potential benefits of protein-energy nutritional supplementation from conception to age 2 years in high-risk populations might outweigh potential increases in obesity and obesity-related cardio metabolic disease risk. The generalisability of our findings might be limited to contexts of high childhood undernutrition followed by exposure to an obesogenic environment in adulthood. Further research is needed on the approaches to reduce stunting without increasing the risk of overweight or obesity and dyslipidaemia later in life. Elucidating the pathways through which nutritional supplementation affects cardiometabolic disease outcomes could inform evidence-based child nutrition programming. New cohort studies are needed in Latin America because the environment and nutrition have changed since the 1970s when this cohort was recruited.
Although the INCAP longitudinal study cohort has more than 40 years of follow-up and has had attrition, we did not find evidence to suggest that attrition affected the internal validity of our findings. Attrition was not differential with respect to Atole exposure from conception to age 2 years, and with the exception of sex, characteristics of those lost to follow-up were similar to those who participated in the 2015–17 study. We used a comprehensive set of biomarkers of cardiometabolic disease risk, including fasting and post-challenge glucose, and anthropometric measures of obesity to discriminate between lean and fat mass. Owing to the rich data collection of sociodemographic characteristics in childhood and adulthood, we were able to control for a wide range of potential confounders and mediating factors in adulthood. However, variability in risk of cardiometabolic disease was low among women, potentially reducing our ability to detect associations in sex-specific models. We tested for stratum heterogeneity between men and women; however, tests for interaction have low power. Although logistic regression is eventlimited, the Harrell’s C statistic suggests our adjusted models have reasonable fit (>0·70).39
Our analyses compared children exposed to Atole from conception to age 2 years with children exposed to Fresco and children exposed to Atole at different ages. Thus, the non-exposed population includes some individuals with substantial exposure to Atole in the first 1000 days, which could have attenuated the estimated effect sizes. In sensitivity analyses with three levels of exposure, relative to those with no exposure from conception to age 2 years, those with partial exposure generally had estimates closer to the null than those with full exposure.
Improved nutrition from conception to age 2 years improved child survival, growth, and adult human capital and could potentially reduce diabetes incidence in contexts of the nutrition transition. However, we found that protein-energy supplementation during this developmental window also increased risk of obesity and several obesity-related conditions including diastolic blood pressure and dyslipidaemia. Nutritional supplementation programmes should consider the potential mixed consequences for adult cardiometabolic health.
Supplementary Material
Research in context.
Evidence before this study
We queried PubMed and searched by hand reference lists of identified papers for additional relevant literature. Based on this non-systematic review of the literature, much of the evidence on the effect of inadequate nutrition on health in later life comes from studies of the long-term consequences of acute prenatal exposure to famine and from observational studies of early life nutrient deprivation. The dual burdens of early-life chronic undernutrition—a more common experience than acute famine—and adult-onset cardiometabolic disease are thought to be causally related. However, the causal effect of this pattern of malnutrition on adult health has not been widely examined. Most studies have been observational and thus can only assess the associations between undernutrition and adult disease. To our knowledge, this study is the first study to examine the effect of a nutritional-supplementation intervention from conception to age 2 years (the first 1000 days) on cardiometabolic disease risk in midlife.
Added value of this study
Using experimental data from a longitudinal cohort with more than 40 years of follow-up, we found beneficial and detrimental effects of a protein-energy nutritional supplement (Atole) from conception to age 2 years on the cardiometabolic-disease risk profile in Guatemalan adults. Exposure to Atole from conception to age 2 years increased adiposity and caused a more atherogenic blood–lipid profile (total cholesterol and non-HDL cholesterol). Conversely, exposure to Atole from conception to age 2 years had a strong inverse association with diabetes that was not mediated through measures of adiposity. Overall, evidence from this cohort suggests that protein-energy nutritional supplementation has mixed ability to offset the incidence of adult cardiometabolic disease in contexts of chronic childhood undernutrition and obesogenic adult environments.
Implication of all the available evidenc
Given the scope of potential improvements in child growth and development and adult human capital, the potential benefits of protein-energy nutritional supplementation from conception to age 2 years in high-risk populations might outweigh potential increases in obesity and obesity-related cardiometabolic disease risk. Moreover, improved nutrition from conception to age 2 years could reduce diabetes incidence in contexts in which early-life undernutrition is followed by adult-onset overweight and obesity. However, more research is needed to understand how to mitigate the detrimental effects of protein-energy nutritional supplementation in obesogenic adult environments.
Acknowledgments
Funding for this study was provided by the National Institutes of Health (grant number HD-075784, AG-012835).
Funding National Institutes of Health.
Footnotes
Declaration of interests
ADS reports grants from US National Institutes of Health during the conduct of the study. All other authors declare no competing interests.
Contributor Information
Nicole D Ford, Hubert Department of Global Health, Rollins School of Public Health Emory University, Atlanta, GA, USA.
Jere R Behrman, Departments of Economics and Sociology, School of Arts and Sciences, University of Pennsylvania, Philadelphia, PA, USA.
John F Hoddinott, Division of Nutritional Sciences and Charles H Dyson School of Applied Economics and Management, Cornell University, Ithaca, NY, USA.
John A Maluccio, Department of Economics, Middlebury College, Middlebury, VT, USA.
Reynaldo MartorelL, Hubert Department of Global Health, Rollins School of Public Health Emory University, Atlanta, GA, USA.
Manuel Ramirez-Zea, Institute of Nutrition of Central America and Panama Research Center for the Prevention of Chronic Diseases, Institute of Nutrition of Central America and Panama, Guatemala City, Guatemala.
Aryeh D Stein, Hubert Department of Global Health, Rollins School of Public Health Emory University, Atlanta, GA, USA.
References
- 1.Victora CG, de Onis M, Hallal PC, Blössner M, Shrimpton R. Worldwide timing of growth faltering: revisiting implications for interventions. Pediatrics 2010; 125: e473–80. [DOI] [PubMed] [Google Scholar]
- 2.Barker DJP. Fetal programming of coronary heart disease. Trends Endocrinol Metab 2002; 13: 364–68. [DOI] [PubMed] [Google Scholar]
- 3.Corvalán C, Gregory CO, Ramirez-Zea M, Martorell R, Stein AD. Size at birth, infant, early and later childhood growth and adult body composition: a prospective study in a stunted population. Int J Epidemiol 2007; 36: 550–57. [DOI] [PubMed] [Google Scholar]
- 4.Bhargava SK, Sachdev HS, Fall CHD, et al. Relation of serial changes in childhood body-mass index to impaired glucose tolerance in young adulthood. N Engl J Med 2004; 350: 865–75. [DOI] [PMC free article] [PubMed] [Google Scholar]
- 5.Adair LS. Size at birth and growth trajectories to young adulthood. Am J Hum Biol Off J Hum Biol Counc 2007; 19: 327–37. [DOI] [PubMed] [Google Scholar]
- 6.Cooper R, Power C. Sex differences in the associations between birthweight and lipid levels in middle-age: findings from the 1958 British birth cohort. Atherosclerosis 2008; 200: 141–49. [DOI] [PubMed] [Google Scholar]
- 7.Hanson MA, Gluckman PD. Early developmental conditioning of later health and disease: physiology or pathophysiology? Physiol Rev 2014; 94: 1027–76. [DOI] [PMC free article] [PubMed] [Google Scholar]
- 8.Lumey LH, Stein AD, Susser E. Prenatal famine and adult health. Annu Rev Public Health 2011; 32: 237–62. [DOI] [PMC free article] [PubMed] [Google Scholar]
- 9.Bercovich E, Keinan-Boker L, Shasha SM. Long-term health effects in adults born during the Holocaust. Isr Med Assoc J 2014; 16: 203–07. [PubMed] [Google Scholar]
- 10.Stanner SA, Yudkin JS. Fetal programming and the Leningrad Siege study. Twin Res 2001; 4: 287–92. [DOI] [PubMed] [Google Scholar]
- 11.Stein AD, Kahn HS, Rundle A, et al. Anthropometric measures in middle age after exposure to famine during gestation: evidence from the Dutch famine. Am J Clin Nutr 2007; 85: 869–76. [DOI] [PubMed] [Google Scholar]
- 12.Hult M, Tornhammar P, Ueda P, et al. Hypertension, diabetes and overweight: looming legacies of the Biafran famine. PLoS One 2010; e13582. [DOI] [PMC free article] [PubMed]
- 13.Roseboom T, de Rooij S, Painter R. The Dutch famine and its long-term consequences for adult health. Early Hum Dev 2006;82: 485–91. [DOI] [PubMed] [Google Scholar]
- 14.Li C, Lumey LH. Exposure to the Chinese famine of 1959–61 in early life and long-term health conditions: a systematic review and meta-analysis. Int J Epidemiol 2017; 46: 1157–70. [DOI] [PubMed] [Google Scholar]
- 15.Black RE, Allen LH, Bhutta ZA, et al. Maternal and child undernutrition: global and regional exposures and health consequences. Lancet 2008. 19; 371: 243–60. [DOI] [PubMed] [Google Scholar]
- 16.Popkin BM. The nutrition transition and obesity in the developing world. J Nutr 2001; 131: 871S–73S. [DOI] [PubMed] [Google Scholar]
- 17.Forouzanfar MH, Alexander L, Anderson HR, et al. Global, regional, and national comparative risk assessment of 79 behavioural, environmental and occupational, and metabolic risks or clusters of risks in 188 countries, 1990–2013: a systematic analysis for the Global Burden of Disease Study 2013. Lancet 2015;386: 2278–323. [DOI] [PMC free article] [PubMed] [Google Scholar]
- 18.Martorell R, Habicht JP, Rivera JA. History and design of the INCAP longitudinal study (1969–77) and its follow-up (1988–89). J Nutr 1995; 125 (suppl 4): S1027–41. [DOI] [PubMed] [Google Scholar]
- 19.Pace N, Rathbun EN. Studies on body composition: III The body water and chemically combined nitrogen content in relation to fat content. J Biol Chem 1945; 158: 685–91. [Google Scholar]
- 20.Heart National, Lung, and Blood Institute Obesity Education Initiative. The practical guide to identification, evaluation, and treatment of overweight and obesity in adults Bethesda, MD: National Heart, Lung, and Blood Institute, 2000. [Google Scholar]
- 21.Grundy SM. Low-density lipoprotein, non-high-density lipoprotein, and apolipoprotein B as targets of lipid-lowering therapy. Circulation 2002; 106: 2526–29. [DOI] [PubMed] [Google Scholar]
- 22.American Diabetes Association. Classification and diagnosis of diabetes. Diabetes Care 2015; 38 (suppl 1): S8–16. [DOI] [PubMed] [Google Scholar]
- 23.National Cholesterol Education Program (NCEP) Expert Panel on Detection, Evaluation, and Treatment of High Blood Cholesterol in Adults (Adult Treatment Panel III). Third report of the National Cholesterol Education Program (NCEP) expert panel on detection, evaluation, and treatment of high blood cholesterol in adults (Adult Treatment Panel III) final report. Circulation 2002; 106: 3143–421. [PubMed] [Google Scholar]
- 24.Dimick JB, Ryan AM. Methods for evaluating changes in health care policy: the difference-in-differences approach. JAMA 2014; 312: 2401–02. [DOI] [PubMed] [Google Scholar]
- 25.Conlisk AJ, Barnhart HX, Martorell R, Grajeda R, Stein AD. Maternal and child nutritional supplementation are inversely associated with fasting plasma glucose concentration in young Guatemalan adults. J Nutr 2004; 134: 890–97. [DOI] [PubMed] [Google Scholar]
- 26.Stein AD, Wang M, Ramirez-Zea M, et al. Exposure to a nutrition supplementation intervention in early childhood and risk factors for cardiovascular disease in adulthood: evidence from Guatemala. Am J Epidemiol 2006; 164: 1160–70. [DOI] [PubMed] [Google Scholar]
- 27.Hales CN, Barker DJP. Type 2 (non-insulin-dependent) diabetes mellitus: the thrifty phenotype hypothesis. 1992. Int J Epidemiol 2013; 42: 1215–22. [DOI] [PubMed] [Google Scholar]
- 28.Snoeck A, Remacle C, Reusens B, Hoet JJ. Effect of a low protein diet during pregnancy on the fetal rat endocrine pancreas. Biol Neonate 1990; 57: 107–18. [DOI] [PubMed] [Google Scholar]
- 29.Arantes VC, Teixeira VPA, Reis MAB, et al. Expression of PDX-1 is reduced in pancreatic islets from pups of rat dams fed a low protein diet during gestation and lactation. J Nutr 2002; 132: 3030–35. [DOI] [PubMed] [Google Scholar]
- 30.Martorell R, Habicht J-P, Klein RE. Anthropometric indicators of change in nutritional status in malnourished populations. In: Underwood BA. Methodologies for human population studies in nutrition related to health Bethesda, MD: US Department of Health and Human Services, 1982: 96–110. [Google Scholar]
- 31.Islam M, Hoddinott J. Evidence of intrahousehold flypaper effects from a nutrition intervention in rural Guatemala. Econ Dev Cult Change 2009; 57: 215–38. [Google Scholar]
- 32.Adair LS, Fall CHD, Osmond C, et al. Associations of linear growth and relative weight gain during early life with adult health and human capital in countries of low and middle income: findings from five birth cohort studies. Lancet 2013; 382: 525. [DOI] [PMC free article] [PubMed] [Google Scholar]
- 33.Willett WC, Dietz WH, Colditz GA. Guidelines for healthy weight. N Engl J Med 1999; 341: 427–34. [DOI] [PubMed] [Google Scholar]
- 34.Zheng Y, Manson JE, Yuan C, et al. Associations of weight gain from early to middle adulthood with major health outcomes later in life. JAMA 2017; 318: 255–69. [DOI] [PMC free article] [PubMed] [Google Scholar]
- 35.Haas JD, Martinez EJ, Murdoch S, Conlisk E, Rivera JA, Martorell R. Nutritional supplementation during the preschool years and physical work capacity in adolescent and young adult Guatemalans. J Nutr 1995; 125 (suppl 4): S1078–89. [DOI] [PubMed] [Google Scholar]
- 36.Pollitt E, Gorman KS, Engle PL, Rivera JA, Martorell R. Nutrition in early life and the fulfillment of intellectual potential. J Nutr 1995; 125 (suppl 4): S1111–18. [DOI] [PubMed] [Google Scholar]
- 37.Maluccio JA, Hoddinott J, Behrman JR, Martorell R, Quisumbing AR, Stein AD. The impact of improving nutrition during early childhood on education among Guatemalan adults. Econ J 2009; 119: 734–63. [Google Scholar]
- 38.Hoddinott J, Maluccio JA, Behrman JR, Flores R, Martorell R. Effect of a nutrition intervention during early childhood on economic productivity in Guatemalan adults. Lancet 2008; 371: 411–16. [DOI] [PubMed] [Google Scholar]
- 39.Peduzzi P, Concato J, Kemper E, Holford TR, Feinstein AR. A simulation study of the number of events per variable in logistic regression analysis. J Clin Epidemiol 1996; 49: 1373–79. [DOI] [PubMed] [Google Scholar]
Associated Data
This section collects any data citations, data availability statements, or supplementary materials included in this article.