

Abstract
The First International Conference on Controversies in Vitamin D was held in Pisa, Italy, 14–16 June 2017. The meeting's purpose was to address controversies in vitamin D research, review the data available, to help resolve them, and suggest a research agenda to clarify areas of uncertainty. The serum 25‐hydroxyvitamin D [25(OH)D] concentration [i.e. the sum of 25(OH)D3 and 25(OH)D2] remains the critical measurement for defining vitamin D status. Assay variation for 25(OH)D has contributed to the current chaos surrounding efforts to define hypovitaminosis D. An essential requirement to develop a consensus on vitamin D status is that measurement of 25(OH)D and, in the future, other potential vitamin D biomarkers [e.g. 1α,25(OH)2D3, 3‐epi‐25(OH)D, 24,25(OH)2D3, vitamin D‐binding protein, free/bioavailable 25(OH)D and parathyroid hormone] be standardized/harmonized, to allow pooling of research data. Vitamin D Standardization Program tools are described and recommended for standardizing 25(OH)D measurement in research. In the future, similar methodology, based on National Institute for Standards and Technology standard reference materials, must be developed for other candidate markers of vitamin D status. Failure to standardize/harmonize vitamin D metabolite measurements is destined to promulgate continued chaos. At this time, 25(OH)D values below 12 ng ml–1 (30 nmol l–1) should be considered to be associated with an increased risk of rickets/osteomalacia, whereas 25(OH)D concentrations between 20 ng ml–1 and 50 ng ml–1 (50–125 nmol l–1) appear to be safe and sufficient in the general population for skeletal health. In an effort to bridge knowledge gaps in defining hypovitaminosis D, an international study on rickets as a multifactorial disease is proposed.
Keywords: 25‐hydroxyvitamin D, Fibroblast Growth Factor (FGF23), Parathyroid Hormone (PTH), Vitamin D, Vitamin D‐binding protein (DBP), Vitamin D Standardization Program (VDSP)
Introduction
A central controversy in vitamin D research is how to define hypovitaminosis D 1. Many questions must be addressed to resolve this controversy. Specifically, is there a biological/biochemical marker, or set of markers, that can be used to identify patients who are at high risk for hypovitaminosis D‐related diseases or conditions and, therefore, in need of intervention? If so, what is this marker, can it be measured accurately and what cut‐off point(s) can be used to define low vitamin D status? Importantly, an essential laboratory requirement in the effort to develop consensus guidelines on vitamin D status is that the measurement of potential biological/biochemical markers in vitamin D research be standardized, or at least harmonized, to allow the pooling of research data.
Currently, serum total http://www.guidetopharmacology.org/GRAC/LigandDisplayForward?ligandId=6921 concentration – the sum of the 25(OH)D3 and 25(OH)D2 concentrations – is considered to be the best biomarker to define vitamin D status 2, 3, 4. This is because 25(OH)D has a relatively long half‐life of about 2–3 weeks, the hepatic conversion of the parent molecules http://www.guidetopharmacology.org/GRAC/LigandDisplayForward?ligandId=2747 and ergocalciferol to 25(OH)D is unregulated, and its concentration in patients with rickets or osteomalacia – the two diseases accepted as being due, in part, to hypovitaminosis D – increases rapidly following treatment with orally administered vitamin D, with associated resolution of these diseases.
However, despite multiple meta‐analyses including large randomized clinical trials, the definition of hypovitaminosis D and ‘optimal’ vitamin D status remains elusive 1. In large part, this reflects the use of unstandardized 25(OH)D assays in vitamin D research, which precludes the ability to pool research data from different studies and, therefore, to allow evidence‐based definitions of vitamin D status 5, 6. Additionally, difficulties in differentiating cases of rickets and osteomalacia primarily due to hypovitaminosis D from those due to other causes (e.g. calcium deficiency) promulgate confusion 7, 8.
At the same time, given the multitude of vitamin D metabolites, it is reasonable to ask if singular measurement of circulating 25(OH)D is the best marker to define hypovitaminosis D, or if measurement of other vitamin D metabolites that possess physiological activity should be included in a so‐called ‘vitamin D panel’ that could be used to define ‘low’ vitamin D status 9. The list of such potential vitamin D metabolites at the centre of intense research includes the vitamin D2 and D3 forms of http://www.guidetopharmacology.org/GRAC/LigandDisplayForward?ligandId=2779, and 3‐epi‐25(OH)D and 24,25‐dihydroxyvitamin D [24,25(OH)2D3]. Vitamin D‐binding protein (DBP) and free/bioavailable 25(OH)D, although not vitamin D metabolites, must also be added to the list for consideration 10. However, as has been the case for total 25(OH)D, the lack of assay standardization/harmonization confounds research on these additional metabolites. Ultimately, vitamin D status (e.g. ‘low’, ‘adequate’ or ‘ optimal’) should be defined based on the measurement of a vitamin D‐related analyte or analytes that best predict surrogate or clear skeletal or extra‐skeletal outcomes for a specific target group.
The First International Conference on Controversies in Vitamin D was held in Pisa, Italy, 14–16 June 2017. The meeting's purpose was to address controversies in vitamin D research, review the data available to help to resolve them, and suggest a research agenda to clarify areas of uncertainty.
25(OH)D and the definition of vitamin D status
Consensus statement
Serum total 25(OH)D concentration remains the critical measurement for defining vitamin D status 1, 2, 3, 4. Serum total 25(OH)D is defined as the sum of the concentrations of 25(OH)D3 and 25(OH)D2. Measurement of vitamin D status, based on currently available data, should not include the concentration of 3‐epi‐25(OH)D3 or any other vitamin D metabolite. As such, both research and clinical assays based on liquid chromatography–tandem mass spectrometry (LC–MS/MS) measurement systems, should preferably separate 3‐epi‐25(OH)D3 from 25(OH)D3. Not excluding this epimer from the measurement of 25(OH)D3 may lead to overestimation of serum total 25(OH)D and misclassification, bias and/or errors in clinical decision making when a fixed cut‐off point is used to define ‘low’ vitamin D status, especially in young children 11, 12, in whom the 3‐epimer is present at higher concentration.
There needs to be evidence‐based consensus regarding the 25(OH)D concentration to define hypovitaminosis D. In the absence of such data, at this time, 25(OH)D values below 12 ng ml–1 (30 nmol l–1) should be considered to be associated with an increased risk of rickets/osteomalacia, whereas 25(OH)D concentrations between 20 ng ml–1 and 50 ng ml–1 (50–125 nmol l–1) appear to be safe and sufficient in the general population for skeletal health.
Laboratory standardization in vitamin D research is a necessary element in developing consensus regarding the 25(OH)D level to define hypovitaminosis D 1, 5, 10. This standardization needs to take place in three principal areas: (i) laboratory standardization of the measurement of 25(OH)D; (ii) laboratory harmonization/standardization of the measurement of vitamin D metabolites thought to be possible measures of status [e.g. 1α,25(OH)2D3, 3‐epi‐25(OH)D3, 24,25(OH)2D3, DBP and free/bioavailable 25(OH)D3] and other measures used to evaluate vitamin D status [e.g. http://www.guidetopharmacology.org/GRAC/LigandDisplayForward?ligandId=1785 (PTH)]; and (iii) standardization of the definitions of what constitutes vitamin D rickets and osteomalacia.
Clinical thresholds are needed for defining the 25(OH)D concentration at which intervention is essential in vitamin D deficiency (rickets/osteomalacia). These should be based on well‐designed studies of the relationship of standardized 25(OH)D data with health outcomes. This includes the recommendation that follows for the development of an international rickets registry to define the relationship of 25(OH)D and other key vitamin D metabolites with clinical outcomes. Additionally, but importantly, consensus is needed to define causality both for skeletal and nonskeletal health outcomes; should they be PTH, immune function, falls etcetera? It seems likely that for the foreseeable future, vitamin D status will be related to PTH measurement. As such, it is recommended that a PTH reference measurement procedure be developed and that PTH measurements be standardized or at least harmonized.
Standardization of serum total 25(OH)D in vitamin D research
Consensus statement
Standardization is the process whereby, within defined statistical limits, all laboratories and assays are brought into alignment with the ‘true concentration’ based on gold standard reference measurement procedures and certified reference materials 13, 14. That is, standardized laboratories report the ‘true’ concentration – in this case, of serum total 25(OH)D – regardless of time, place and assay or measurement system.
Failure to utilize standardized 25(OH)D data is a major contributor to the confusion surrounding vitamin D status 15. A substantial literature exists documenting 25(OH)D assay variation. Despite the existence of external quality assessment schemes [e.g. the Vitamin D External Quality Assessment Scheme (DEQAS)], it is only since the development of the US National Institute for Standards and Technology (NIST) reference measurement procedure 16 in 2010 and the introduction of the Vitamin D Standardization Program (VDSP) that it has been possible to evaluate assay variation in an unbiased way 17. In 2013, NIST began assigning target values for DEQAS materials. Studies of DEQAS data since 2013 clearly demonstrate that there remains a great deal of sample‐to‐sample variation within laboratories using the same assay, and also between different assay platforms 18, 19. Assay standardization of national nutrition survey data and epidemiological studies clearly show the dramatic differences in the prevalence of ‘low’vitamin D status between unstandardized measurements and those standardized using VDSP methods. For example, it was originally thought that there had been a dramatic decline in mean 25(OH)D levels in the US population from 1990 to the period 2001–2004 20. However, after standardization mean 25(OH)D levels from 1990 dropped dramatically to the mean levels found during 2001–2004, documenting that during the entire period 1990–2004 US mean 25(OH)D levels were stable 21. Additionally, in a study among Nordic countries, standardization of the Finnish Health 2011 survey led to mean 25(OH)D levels decreasing from 76 nmol l–1 to 68 nmol l–1, and in the Danish Health 2006 survey mean 25(OH)D levels increased from 44 nmol l–1 to 65 nmol l–1 22. Results such as these document that standardization may lead to increasing or decreasing observed 25(OH)D levels; it is impossible to know if, or which way, an individual study's 25(OH)D data are biased if standardized data are not used. Standardization of Finnish national data and data from throughout the EU have had a profound effect on evaluating the impact of food fortification policy which would not have been possible without standardization 23. Moreover, in cases where 25(OH)D is used to evaluate the effectiveness of drug therapies 24, the interpretation of the results is uncertain without standardized measurements. These results and others call into question the validity of meta‐analyses utilizing unstandardized 25(OH)D data. As such, meta‐analyses of nonstandardized 25(OH)D data are of little use; standardized 25(OH)D measurements are essential in current and future vitamin D research studies. Moreover, retrospective standardization of studies completed in the past, using validated methods developed by the VDSP, should be promoted, as the vast majority of previously published research data have reported unstandardized 25(OH)D results 25, 26. Recently completed key research identified in the preparation of vitamin D guidelines should be recommended for retrospective standardization. Journals should require standardized 25(OH)D data as a condition for publication. Moreover, authors should document that the assay used meets the minimal performance criteria set by the VDSP – that is, precision [total coefficient of variation (CV)] ≤10% and accuracy (mean bias) ≤5%.
We recognize that LC–MS/MS is potentially the most accurate and precise method for measuring 25(OH)D in research studies, especially where multiple vitamin D metabolites are measured in addition to 25(OH)D, and across a variety of physiological states/health conditions 27, 28. Moreover, we recognize that automated immunoassays will continue to be used in many clinical laboratories where the focus remains on serum total 25(OH)D. We encourage all assay manufacturers to standardize their assays through participation in the US Centers for Disease Control and Prevention (CDC) programme 29, 30. At the same time, we recognize that substantial assay variation around mean bias (%) continues to exist 31, 32. Correcting this problem requires the VDSP to re‐evaluate and tighten its performance criteria to include a measure of variability around mean bias (%) and for commercial assay manufacturers to improve their assays in the development phase. A much more difficult problem for some immunoassay manufacturers to correct – and for standardization efforts – are matrix‐specific interferences, especially those found in some physiological states (e.g. pregnancy), and in intensive care unit (ICU), osteoporotic and haemodialysis patients 33, 34.
Issues leading to assay variation in 25(OH)D measurements
Serum total 25(OH)D is a very difficult analyte to measure 35. Several issues which contribute to assay variation in its measurement include antibody affinities for 25(OH)D2 and 25(OH)3, cross‐reactivity with other vitamin D metabolites [e.g. 24,25(OH)2D], DBP concentration and unknown matrix interferences.
In some immunoassays, the antibodies used to measure 25(OH)D may have low affinity for 25(OH)D2. This can lead to low estimates of total 25(OH)D 36, 37. This is primarily of importance in populations where ergocalciferol is widely used as a supplement or in the treatment of hypovitaminosis D (e.g. in the USA). Additionally, supplementation with ergocalciferol will increase 25(OH)D2 while concomitantly reducing 25(OH)D3 38. When in doubt, it is best to confirm the 25(OH)D concentration for patients prescribed ergocalciferol using a standardized LC–MS/MS assay.
Additionally, several 25(OH)D immunoassays show high cross‐reactivity with 24,25(OH)2D 39. As 24,25(OH)2D, can be present in serum at concentrations of up to 20% of total 25(OH)D, such cross‐reactivity can potentially substantially affect the ‘25(OH)D’ concentration 40. By contrast, 3‐epi‐25‐OHD3 does not appear to show cross‐reactivity in immunoassays, yet does cross‐react in a competitive protein‐binding assay and is not always separated in high‐performance liquid chromatography and LC–MS/MS methods 39, 41, 42. This is especially of importance in young children 11, 12 but the epimer is found in individuals of all ages 43, 44, 45.
DBP concentration can also be associated with sample‐specific inaccuracy of total 25(OH)D measurement. In some automated immunoassays, 25(OH)D is not well released from the binding protein, leading to discrepant results in individuals with high or low DBP concentrations, such as pregnant women or patients with liver failure 6, 34.
Finally, as stated above, matrix‐specific interference with 25(OH)D assays may occur, for not always apparent reasons. For instance, in some immunoassays, sera from pregnant women, and among ICU, osteoporotic and haemodialysis patients behave differently than those from healthy controls 6, 33, 34, 37, 46, 47.
Serum total 25(OH)D laboratory standardization methods
The VDSP was founded in 2010 to promote the standardized measurement of serum total 25(OH)D around the world 15. Since that time, the VDSP, its partners and collaborators have developed cost‐effective tools and methods to standardize 25(OH)D measurement prospectively in current and future vitamin D research 48 within defined statistical performance guidelines. Moreover, the VDSP has developed tools and methods to standardize 25‐OHD measurements retrospectively from studies completed in the past, when properly banked serum samples exist 26, 49.
It is useful to think of the VDSP standardization process as being composed of four distinct phases 48 (Figure 1). The first phase – development of the reference measurement system – is essential to the remaining three phases as it includes the tools and methods to accomplish standardization (Table 1). Some elements of the reference measurement system were developed by programmes collaborating with the VDSP. Phases 2, 3 and 4 consist of a series of calibration steps, with each step connected to the previous ones to develop a chain of traceability from the routine clinical or research laboratory back up the scale to the gold standard reference measurement procedures and/or the NIST standard reference materials (SRMs) (Tables 2 and 3) 50, 51, 52, 53, 54. The VDSP has developed performance criteria that reference measurement procedures and routine laboratories can both use in phases 2–4 and which must meet to be considered standardized (Table 4) 48, 55.
Figure 1.
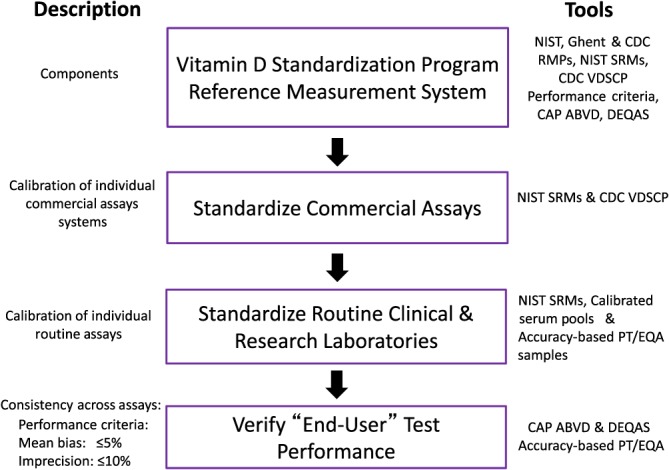
Vitamin D Standardization Program (VDSP): standardization phases. ABVD, accuracy‐based vitamin D survey; CAP, College of American Pathologists; CDC, Centers for Disease Control and Prevention; DEQAS, Vitamin D External Quality Assessment Scheme; NIST, National Institute for Standards and Technology; PT/EQA, performance testing/external quality assessment; RMP, reference method procedure; SRM, standard reference material; VDSCP, Vitamin D Standardization‐Certification Program
Table 1.
Vitamin D Standardization Program (VDSP) reference measurement system components
| National Institute for Standards and Technology (NIST), Ghent University and Centers for Disease Control and Prevention (CDC) reference measurement procedures |
| NIST standard reference materials |
| Performance standards for accuracy (mean bias %) and precision (total CV%) |
| CDC Vitamin D Standardization‐Certification Program |
| Accuracy‐based performance testing/external quality assessment schemes |
| College of American Pathologists' accuracy‐based vitamin D survey |
| Vitamin D External Quality Assessment Scheme. |
Table 2.
| SRM 2972a consists of four separate ethanolic solutions | |
|---|---|
| Vitamin D metabolite | Concentration (nmol l–1) |
| 25(OH)D3 in ethanol level 1 | 806.2 ± 32.4 |
| 25(OH)D3 in ethanol level 2 | 1596.5 ± 64.1 |
| 25(OH)D2 in ethanol | 560.4 ± 19.9 |
| 3‐epi‐25(OH)D3 in ethanol | 577.0 ± 28.5 |
3‐epi‐25(OH)D3, 3‐epi‐25‐hydroxyvitamin D3; 25(OH)D2, 25‐hydroxyvitamin D2; 25(OH)D3, 25‐hydroxyvitamin D3
The concentration “±” the expanded uncertainty
SRM 2972a is a replacement for SRM 2972, which has been redesigned
Ethanolic solutions can be diluted to prepare calibration curves
Please see: National Institute of Standards and Technology. Certificate of Analysis Standard Reference Material® 2972a. 25‐hydroxyvitamin D calibration solutions
Table 3.
Assigned values of standard reference materials (SRMs) 972a and 2973 (nmol l–1)a
| SRM | Total 25(OH)D | 25(OH)D2 | 25(OH)D3 | 3‐epi‐25(OH)D3 | 24,25(OH)2D3 |
|---|---|---|---|---|---|
| 972a | |||||
| Level 1 | 73.1 ± 2.7 | 1.3 ± 0.2 | 71.8 ± 2.7 | 4.5 ± 0.2 | 6.38 ± 0.23 |
| Level 2 | 47.2 ± 1.0 | 2.0 ± 0.2 | 45.1 ± 1.0 | 3.2 ± 0.2 | 3.39 ± 0.12 |
| Level 3 | 82.9 ± 1.2 | 32.3 ± 0.8 | 49.5 ± 1.1 | 2.9 ± 0.4 | 3.88 ± 0.13 |
| Level 4 | 74.9 ± 2.2 | 1.3 ± 0.2 | 73.4 ± 2.3 | 64.8 ± 5.4 | 6.32 ± 0.22 |
| 2973 | 100.1 ± 2.0 | 1.59 ± 0.05 | 98.4 ± 2.1 |
|
7.51 ± 0.26 |
3‐epi‐25(OH)D3, 3‐epi‐25‐hydroxyvitamin D3; 25(OH)D, 25‐hydroxyvitamin D; 25(OH)D2, 25‐hydroxyvitamin D2; 25(OH)D3, 25‐hydroxyvitamin D3; 1α,25(OH)2D3, 1α,25‐dihydroxyvitamin D3; 24,25(OH)2D3, 24,25‐dihydroxyvitamin D3
The concentration or assign value for each analyte “±” the expanded uncertainty
For additional details, please see: National Institute of Standards and Technology. Certificate of Analysis Standard Reference Material® 972a. Vitamin D metabolites in frozen human serum; and Certificate of Analysis Standard Reference Material® 2973. Vitamin D metabolites in frozen human serum (high level)
Table 4.
Vitamin D Standardization Program assay performance limits based on biological variationa
| Measurements | CV (%) | Bias (%) |
|---|---|---|
| Reference laboratories | ≤5% | ≤1.7% |
| Routine laboratories | ≤10% | ≤5% |
| CV, coefficient of variation |
Stöckl et al. 55
Reference measurement procedures are certified by the international Joint Committee for Traceability in Laboratory Medicine (JCTLM). Currently, there are only three laboratories in the world with certified 25(OH)D reference measurement procedures – NIST 16, Ghent University, in Belgium 56, and the CDC 57.
Accuracy‐based performance testing/external quality assessment (PT/EQA) schemes play a role in all phases. In these schemes, the serum materials used in the programme have been value assigned by one of the three JCTLM‐certified reference measurement procedures. The target value is the true concentration of serum total 25(OH)D. To our knowledge, there are only two accuracy‐based PT/EQA schemes in the world – the College of American Pathologists (CAP) accuracy‐based vitamin D (ABVD) survey and DEQAS 58, 59. PT/EQA schemes are traditionally thought to have a role primarily in phase 4, ‘verify end‐user test performance’, as their names imply 60. However, as the true 25(OH)D concentration in CAP ABVD and DEQAS serum test materials is known, they can be used as low‐cost substitutes for NIST SRMs 972a and 2973 in phases 2 and 3, as noted below.
Phase 2, ‘calibrate commercial assay systems to reference materials’, highlights their central role in 25(OH)D measurement by both routine clinical and research laboratories (Figure 1). Given the dominant role of commercially developed assay systems in serum total 25(OH)D measurement, a principal objective of the VDSP from its beginning has been to standardize those measurement systems (Figure 2). NIST SRMs can be used in the development phase to calibrate their systems, whereas NIST SRMs 972a and 2973, along with CAP ABVD and DEQAS materials, can be used in the development phase and routinely to evaluate their accuracy and precision. Moreover, the CDC's Vitamin D Standardization‐Certification Program (VDSCP) was developed by the VDSP in collaboration with the CDC to provide a rigorous programme to standardize commercial assay systems as well as large commercial or research laboratories 29, 30. The CDC's programme is conducted over a 1‐year period. CDC certification lasts for only 1 year, so that maintenance of certification requires continuous participation in the programme. The current list of the CDC‐certified laboratories is given on the CDC website 29.
Figure 2.
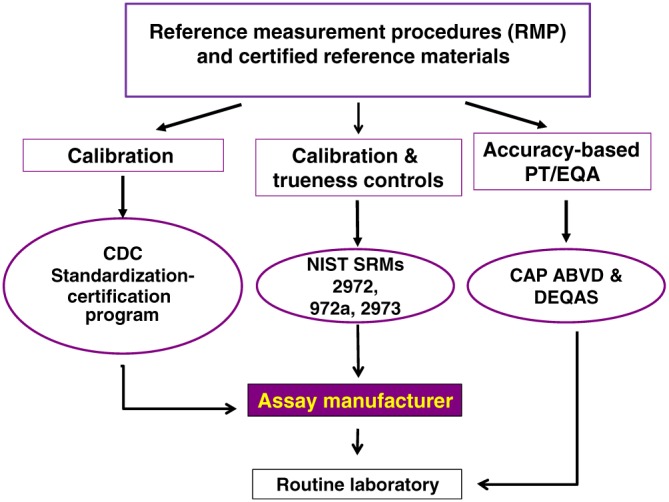
Vitamin D Standardization Program (VDSP): calibration traceability scheme. The VDSP calibration traceability scheme illustrates how the reference measurement system's tools are used to affect assay standardization (adapted from Myers 13). The goal of the complex set of calibration steps is to assure an unbroken chain between the reference method procedures, or National Institute for Standards and Technology standard reference material 2972 ethanolic calibration solutions and the routine laboratory. It emphasizes the central role that commercial assay manufacturers play in the standardization process and illustrates how accuracy‐based performance testing/external quality assessment (PT/EQA) are the only way to verify end‐user performance in routine laboratories
Phase 3 is the standardization of routine laboratories to the gold standard reference methods and/or NIST SRMs (Figure 1), and it can be described in five steps (Figure 3) 48. The general VDSP guidelines provide scientifically rigorous procedures in each of these five steps. In addition, they provide less rigorous, but much lower cost, procedures that can be used especially by small clinical laboratories and research laboratories which measure serum 25(OH)D only infrequently. For example, it is recommended that in the ‘initial assessment of accuracy’ (step 2), samples should be measured in duplicate on each of 2 days. NIST SRMs 972a and 2973 are the preferred option, although CAP ABVD/DEQAS materials could be used as a lower‐cost substitute. However, the preferred method to assess the total CV% and mean bias is to obtain 40 single donor serum samples from the CDC and measure them in duplicate on each of 2 days. CDC will provide the researcher with reference measurement procedure assigned target values for each sample in order to calculate mean bias from the true concentration. There are several lower‐cost procedures, however, involving the measurement of, for example, five CAP ABVD/DEQAS samples in duplicate on each of 2 days.
Figure 3.
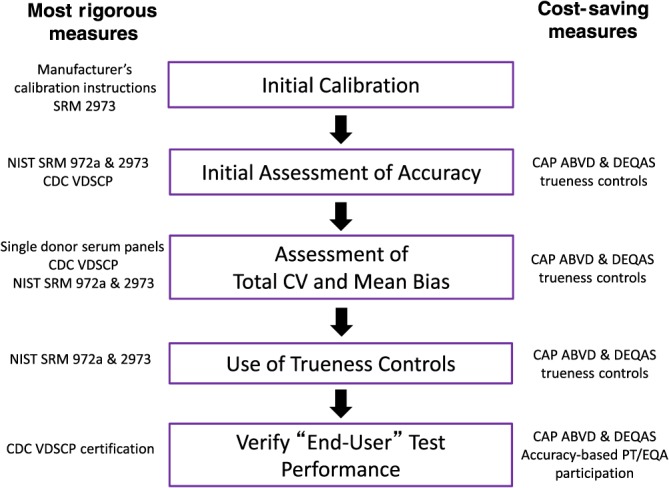
Vitamin D Standardization Program (VDSP): steps to the standardization of an individual laboratories assay to measure serum total 25‐hydroxyvitamin D. There are five steps to standardize an individual laboratory's serum total 25‐hydroxyvitamin D [25(OH)D] measurement (described in greater detail in the text and in Sempos et al. 48). Step 1, initial calibration, entails setting up the assay and calibrating it using the manufacturer's instructions. Step 2, an initial assessment of accuracy, is used to judge if the assay is performing correctly. This can be performed using NIST SRMs 972a and 2973, participating in the CDC's Vitamin D Standardization Certification Program – approaches potentially too costly for routine laboratories. A lower‐cost option in steps 2–4 is to use CAP ABVD and/or DEQAS serum samples, which have RMP‐assigned target values. Step 3 determines if the assay CV and mean bias meet the VDSP performance criteria – i.e. total CV ≤10% and mean bias ≤5%. In addition, a low‐cost method to estimate total CV and mean bias is to measure, for example, five CAP ABVD or DEQAS serum samples in duplicate on 2 days. If the assay does not meet those criteria, laboratory chemists should contact their commercial assay representative. If it is a laboratory‐developed assay, it may be necessary to start the process over. When patient/study participant samples are measured for 25(OH)D, it is recommended, in step 4, that trueness controls are used to assess the ongoing accuracy and precision. For commercial assay users, it is recommended that trueness controls be mixed in with patient/study samples. At the end of the laboratory analysis, these results should be used to develop a regression equation [i.e. RMP target values of the trueness controls (y) and routine laboratory assay results (x)]. If the laboratory does not meet VDSP performance criteria in step 3, then the regression equation may be needed to calibrate the results to RMP results [i.e. the best estimate of the true 25(OH)D concentration). All clinical and research laboratories should participate in an accuracy‐based performance testing programme (e.g. CAP ABVD and/or DEQAS) 61. ABVD, accuracy‐based vitamin D survey; CAP, College of American Pathologists; CDC, Centers for Disease Control and Prevention; CV, coefficient of variation; DEQAS, Vitamin D External Quality Assessment Scheme; NIST, National Institute for Standards and Technology; PT/EQA, performance testing/external quality assessment; RMP, reference method procedure; SRM, standard reference material; VDSCP, Vitamin D Standardization‐Certification Program
The overall objective of the VDSP ‘steps to standardization’ for phase 3 is to determine if, after calibration, the assay meets VDSP performance criteria for precision (Total CV) ≤10% and accuracy (mean bias) ≤5%. Again, although rigorous methods, requiring the use of NIST SRMs and sets of single donor serum samples, are given, much lower‐cost methods, based on using serum materials from accuracy‐based PT‐EQA surveys, e.g. CAP ADVD and DEQAS, are also provided. For researchers, especially those using commercial assays, if calibration is not successful and the VDSP performance criteria are not met, a strategy is described for using trueness controls – for example, NIST SRMs 972a and 2973, and CAP ABVD/DEQAS serum materials – to determine a master regression equation. That master equation can then be used to calibrate the routine assay measurements, with values assigned by a reference measurement procedure, such as NIST.
Rickets as a multifactorial disease and the rickets registry
Lipid measurement and its adverse health outcome [i.e. coronary heart disease (CHD)] can serve as a model for vitamin D status assessment and treatment. Specifically, CHD is a multifactorial disease, for which risk increases with higher serum total cholesterol concentrations 62, 63, 64. Reducing CHD risk has required a unified approach to both treatment and public health prevention guidelines 65, 66. Although there is no level of serum total cholesterol for which the CHD risk is zero, and an elevated level of serum cholesterol does not guarantee that an individual will develop CHD, unified clinical and public health nutrition strategies towards lowering serum total cholesterol levels and ‘risk factor load’ have led to reductions in CHD incidence and mortality around the world.
Similarly, rickets appears to be a multifactorial disease. In the case of vitamin D and rickets, the causal association is negative – that is, those with low vitamin D status are at a higher risk of developing rickets 7, 8. Lack of sun exposure, absence of maternal vitamin D supplementation while breast feeding, low calcium intake and iron status, to name a few, are risk factors associated with an increased risk of rickets. As with serum total cholesterol, low vitamin D status (i.e. low 25(OH)D concentration) does not guarantee that rickets will develop, and nor does a high 25(OH)D level reduce the risk of rickets to zero.
Here, we propose the development of an international ‘rickets registry’ by which we can try to understand and model the vitamin D contribution to rickets, recognizing the multifactorial nature of this disease. This effort would include: (i) developing a rigorous case definition for nutritional rickets; (ii) standardized/harmonized measurement of serum 25(OH)D and other possible measures of vitamin D status [e.g. 3‐epi‐25(OH)D3, 24,25(OH)2D3, DBP and bioavailable/free 25(OH)D3]; and (iii) ‘standardized’ measurement of other known and possible rickets risk factors (e.g. sources of vitamin D exposure, calcium intake, serum alkaline phosphatase level, genetic markers and iron status). The hope is that such an effort will lead to consensus agreement on the definition of hypovitaminosis D based on standardized measurement of 25(OH)D and the use of a standardized set of criteria for defining cases of rickets.
Additional vitamin D metabolites, PTH and the definition of vitamin D status and hypovitaminosis D
Consensus statement
The following vitamin D metabolites and components of vitamin D metabolism are currently the subject of intense research to determine their role in the assessment of vitamin D status: (i) 3‐epi‐25(OH)D; (ii) 1α,25(OH)2D; (iii) 24,25(OH)2D3; (iv) DBP; (v) free 25(OH)D; and (vi) PTH 10. Currently, their importance, if any, in defining states of vitamin D status remains to be determined 1, 2, 3, 4. It is recommended that their measurement in vitamin D research be standardized/harmonized to prevent a recurrence of the problems due to assay variation historically, and currently experienced with serum total 25(OH)D, that have confounded the field. Moreover, in the future, it seems likely that multiple vitamin D metabolites [e.g. cholecalciferol, 1α,25(OH)D3 and 24,25(OH)2D3] will be measured in a single LC–MS/MS analysis (i.e. a ‘vitamin D panel’) 9, 67. In such a system, care must be taken to standardize/harmonize the measurement of each analyte in the panel.
Finally, if and when new vitamin D metabolites are found to be important, standardization/harmonization will be essential, especially in vitamin D research. Such standardization/harmonization is critical as research data will be used to develop clinical and public health guidelines.
3‐epi‐25(OH)D
The importance of the 3 epimer of 25(OH)D, if any, remains to be determined. It was originally discovered in neonates and children, where its concentration is fairly high 11. In adults, its concentration is generally 5–10% of the total serum 25(OH)D3 concentration 43, 44, but on occasion it can be reasonably high 68. At this time, the 3 epimer concentration should not be included in the measurement of total 25(OH)D.
Although all three reference measurement procedures for serum total 25(OH)D measure and subtract the epimer peak from 25(OH)D3, there is no JCTLM‐approved reference measurement procedure for the measurement of 3‐epi‐25(OH)D. NIST, however, does provide certified values for 3‐epi‐25(OH)D3 in SRMs 972a and 2973, where a certified value is one for which NIST has the highest confidence in its accuracy 51, 52, 53, 54.
24,25(OH)2D3
Traditionally 24,25(OH)2D3 was recognized only as the first step in the degradation of 25(OH)D 69. http://www.guidetopharmacology.org/GRAC/FamilyDisplayForward?familyId=267#1365 is the primary enzyme responsible for this metabolic step from 25(OH)D to 24,25(OH)2D3, and serum 1α,25(OH)2D3 to 1,24,25(OH)3D3. The concentration of 24,25(OH)2D3 is highly correlated with that of 25(OH)D3, and is reported to be, on average, between 7% and 15% of the total serum 25(OH)D3 concentration 70, 71, 72. However, 24,25(OH)2D3 appears to have some utility in the diagnosis and management of certain diseases. The measurement of 24,25(OH)2D3 and total 25(OH)D is important in patients with hypercalcaemia 72. Moreover, the ratio of 25(OH)D3 to 24,25(OH)2D3 is increased dramatically in patients with mutations in CYP24A1 73, 74, 75 but reduced in osteogenesis imperfecta 76.
The ratio of 24,25(OH)2D3 to 25(OH)D3 appears to be predictive of vitamin D3 supplementation 77, 78. Thus, irrespective of whether the ratio of the two metabolites is expressed as 24,25(OH)2D3 to 25(OH)D3 70 or its inverse, 25(OH)D3 to 24,25(OH)2D3 72, the outcome seems to be a better overall understanding of vitamin D status vs. serum total 25(OH)D alone. It is claimed by some researchers that the ratio of 25(OH)D3 to 24,25(OH)2D3 is also increased in patients with florid vitamin D deficiency rickets, indicating that the renal vitamin D axis has switched to a 1‐hydroxylation mode 40, 72, 74, although this remains somewhat controversial 79.
NIST has developed a JCTLM‐approved reference measurement procedure for serum 24,25(OH)2D3 80. 24,25(OH)2D3 target values are available for SRMs 972a, and 2973 (Table 3) 50, 51, 52, 53, 54. Standardization of 24,25(OH)2D3 measurement in vitamin D research is needed.
DBP
DBP is the transport protein for all vitamin D metabolites 81, 82. It has three common isoforms. It also binds fatty acids and actin monomers. Additionally, it may play a role in inflammation and serve an independent role in immune function 83, 84, 85, 86. It plays a key role in serum total 25(OH)D measurement, as noted previously, and in the calculation and measurement of free 25(OH)D3.
DBP is a highly polymorphic serum protein with three common alleles and >120 rare variants 85, 87. These different forms have a racial and ethnic distribution. Whether different forms have different affinities for vitamin D is uncertain 88, 89.
DBP can be measured using immunoassays and LC–MS/MS 87, 90. Some commercially available DBP immunoassays use monoclonal antibodies, which have a different affinity for the different DBP isoforms. This means that some of the DBP isoforms are better detected by these monoclonal immunoassays than others, which can lead to falsely low DBP concentrations in the serum of subjects with certain isoforms 87. An immunoassay using polyclonal antibodies did not show these differences between the DBP isoforms, yet showed a difference with a recently developed LC–MS/MS method 87, 91. This difference, of course, influences the calculated bioavailable or free vitamin D concentrations.
Overall, when interpreting measured vitamin D concentrations, one should be aware that: (i) the total concentration of several vitamin D metabolites may be influenced by serum DBP; (ii) the measurement of total vitamin D can be influenced by the concentration of DBP, especially in automated immunoassays, and (iii) the measurement of calculated bioavailable or free vitamin D concentration is influenced not only by the issues confounding total vitamin D measurement, but also by DBP methodology.
The recently published NIST assay for DBP measurement may eventually lead to the development of a reference measurement procedure and SRMs which can be used to promote the standardized measurement of DBP, and in turn to improvements in the calculation of Free 25(OH)D 92.
Free 25(OH)D
The free hormone hypothesis postulates that it is only the unbound fraction (the free fraction) of hormones that can enter cells and exert their biological effects 61. 25(OH)D is bound primarily to DBP (≈85%) and to a lesser extent to serum albumin (≈15%). The unbound fraction of 25(OH)D is <1% of the total amount. Bioavailable 25(OH)D is the sum of free 25(OH)D and the 25(OH)D bound to serum albumin 93. It is hypothesized that it is the unbound, ‘free’ 25(OH)D that drives many of the nonclassical actions of vitamin D 94.
Support for the importance of the free levels of vitamin D metabolites came initially from observations that the increase in 1α,25(OH)2D levels with administration of oral contraceptives or during the third trimester of pregnancy was not associated with changes in calcium metabolism, at least until the latter stages of pregnancy, but was accompanied by a parallel increase in DBP 95. This role of DBP as carrier of the vitamin D metabolites was well demonstrated in DBP knockout mice. Although these mice lost substantial amounts of the vitamin D metabolites in the urine, and their circulating levels of 25(OH)D were very low, they did not develop evidence of rickets until put on a low vitamin D diet 96. Interest in free 25(OH)D and free 1α,25(OH)2D levels was stimulated further by disease states in which the binding proteins are markedly altered, such as liver disease and nephrotic syndrome, as well as in normal physiological states such as pregnancy, and some reports that allelic variations in DBP may affect its affinity for the vitamin D metabolites 88.
Free 25(OH)D concentration can be calculated or measured directly 93, 97. However, free 25(OH)D is an extremely difficult measurement to make. Currently, there is only one immunoassay for the direct measurement of free 25(OH)D. This enzyme‐linked immunosorbent assay is less sensitive for 25(OH)D2. Assay calibration was against a symmetrical dialysis method 98. The limit of detection for blank serum is 0.7 pg ml–1; at 5.02 pg ml–1, the between‐run CV was 6.2% and the between‐day CV was 4.5%, with a total imprecision CV of 15.7% 99. LC–MS has been used to detect 25(OH)D in saliva, which is expected to be free of DBP and albumin and so represents free 25(OH)D 100. In this method, 1 ml of saliva was deproteinized with acetonitrile, purified using a Strata‐X cartridge, derivatized with 4‐phenyl‐1,2,4‐triazoline‐3,5‐dione, ionized by electrospray ionization and subjected to LC–MS. The limit of detection were reported as 2 pg ml–1. The range of values obtained in normal controls was between 3 pg ml–1 and 15 pg ml–1, correlating well with total serum 25(OH)D (10–30 ng ml–1). The intercept was positive but the free fraction in the mid‐range of the assay was approximately 0.04%, in line with the results from centrifugal ultrafiltration and the Future Diagnostics immunoassay 101. However, the development of a JCTLM‐certified reference method for the direct measurement of free 25(OH)D will be difficult as the concentration is at the limit of current LC–MS/MS technology, given the accuracy and precision required for JCTLM reference measurement procedures.
The calculated free 25(OH)D concentration, as currently measured, is influenced by DBP and albumin concentration, varies in different clinical conditions and is of unknown accuracy 93. However, initial studies suggest that directly measured free 25(OH)D may be useful in overcoming that bias 97, 102. The development of DBP and serum albumin reference measurement procedures will be of help in evaluating the different equations for calculating free 25(OH)D. Further research to define the utility, if any, of directly measured or calculated free 25(OH)D measurement in the assessment of vitamin D status is needed 103.
Fibroblast growth factor 23 (FGF23) as a biomarker
http://www.guidetopharmacology.org/GRAC/LigandDisplayForward?ligandId=9291 is a relatively recently discovered hormone and, with the interplay among PTH, 1,25(OH)2D and FGF23, it has been speculated that it may also be a biomarker of vitamin D status. However, current research on the effect of vitamin D treatment on FGF23 concentrations has not shown a clear effect 104.
The measurement of FGF23 is difficult, and assays are neither standardized nor necessarily measuring the same fragments. Some FGF23 assays measure solely the intact FGF23 (the biological active form), whereas others measure both the intact form and the C‐terminal fragments of FGF23 105. As can be expected, the results from these assays do not correlate well with each other, especially in the physiological range 106, 107, 108.
Moreover, the quality of FGF23 assays has not always been established, and intact FGF23 assays do not always agree with each other 105, 106. Apart from standardization differences, and apart from the fact that intact FGF23 and C‐terminal FGF23 assays do not agree and give different information, there is also a problem with the analytical performance of some assays. All of this raises the question of whether these assays are measuring the same thing.
In addition to these analytical issues, pre‐analysis of FGF23 must be taken into account, as the intact FGF23, in particular, is highly unstable, and protease inhibitor cocktails are needed for a reliable measurement 109. After centrifugation, FGF23 in the plasma or serum is relatively stable 107.
1α,25(OH)2 D
Serum 1α,25(OH)2D is the hormone form of vitamin D. Serum 25(OH)D is hydroxylated at the one position by 1α‐hydroxylase (http://www.guidetopharmacology.org/GRAC/FamilyDisplayForward?familyId=267#1370) in the kidney and other tissues, to form 1α,25(OH)2D 110, 111. The vitamin D hormone system is essential in regulating serum calcium concentration 110, 111. Serum 1α,25(OH)2D stimulates: (i) calcium and phosphate absorption in the intestine (primarily the duodenum and jejunum); (ii) renal tubule reabsorption of calcium and phosphate in the kidney (along with PTH); and (iii) with PTH, mobilization of calcium and phosphate from bone.
As 1α,25(OH)2D has a relatively short half‐life and its levels are tightly controlled by PTH, FGF23, phosphate and calcium, calcitriol is not considered a useful measure of vitamin D status. 1α,25(OH)2D stimulates the 24‐hydroxylase enzyme (CYP24A1), which leads to its degradation 110, 111. Mutations in CYP24A1 are one cause of idiopathic infantile hypercalcaemia 77, 112, and increasing levels of serum phosphate/FGF23 may be correlated with the increased expression of CYP24A1 mRNA 69, although serum 24,25(OH)2D3 levels fall in patients with chronic kidney disease undergoing dialysis 78. Serum concentrations of 1α,25(OH)2D3 can provide an insight into the aetiology of hypo‐ and hypercalcaemia and into the complex origin of rare cases of rickets or other metabolic bone diseases.
In prospective research studies, 1α,25(OH)2D3 should only be reported in association with other vitamin D metabolites [i.e. 25(OH)D], calcium, phosphate and PTH. DEQAS runs a PT/EQA programme for 1α, 25(OH)2D3, and all clinical laboratories that measure it should participate in it. Currently, there is no reference measurement procedure for 1α,25(OH)2D3, although NIST had begun work on one.
Recently, 1β,25(OH)2D3 was identified as a new vitamin D metabolite in human serum; however, its role in vitamin D metabolism remains to be elucidated 113.
PTH as a biomarker of hypovitaminosis D
Due to the tight physiological control of plasma calcium concentration by the calciotropic hormones regulating calcium absorption and excretion, and the interplay of PTH, 1α,25(OH)2D and FGF23, it is logical to focus on one of these factors as a potential biomarker for another – here, PTH for 25(OH)D levels. As an example, intact PTH suppression by serum 25(OH)D concentration has been used to estimate the 25(OH)D level, to define hypovitaminosis D. This is an attractive idea because lower serum 25(OH)D levels are associated with higher PTH levels. However, the threshold (inflection or breaking point) at which intact PTH clearly rises when 25(OH)levels are physiologically low remains inconsistent and thereby unsolved 114. Establishment of a threshold is hampered by differences in the standardization of PTH assays and other, preanalytical, issues, including specimen type and stability 115. The possibility of multiple thresholds has also been suggested 116.
As with other peptide hormones, PTH is relatively unstable, and metabolized into inactive fragments both in the circulation and after venepuncture. Thus, well‐defined pre‐analytical conditions are important for its measurement 117, 118, 119. In clinical practice, the second‐generation PTH assay, introduced in the 1980s, is widely used. The assay was developed as an ‘intact PTH assay’, with one antibody directed towards the C‐terminal and one towards the N‐terminal part of the 84‐amino acid peptide. However, such assays also capture PTH fragments, mostly inactive, with some (PTH 7–84) even being inhibitory. The assays, in general, perform reasonably well in most clinical situations, with the exception of declining renal function. In renal failure, inactive PTH fragments are not readily cleared from the circulation, build up and are detected in the second‐generation assay. Typically, in renal failure the elevated PTH level, as detected by the second‐generation assay, will reflect both a level of true secondary hyperparathyroidism (active PTH) and the accumulation of uncleared fragments (inactive PTH). The third‐generation PTH assays are theoretically more selective for measurement of the entire peptide, PTH (1–84), and not circulating fragments because the second antibody is directed towards the first four amino acids in the peptide. The so‐called ‘whole’ PTH assays are preferred in patients with impaired renal function. However, whether the clinical specificity for third‐ compared with second‐generation assays is improved remains to be established. While much remains to be clarified with regard to the relationship between circulating 25(OH)D and PTH, standardized 25(OH)D data will continue to be used in conjunction with ‘PTH’ measurements. It is apparent that reference methods and materials for PTH are needed to enhance the definition of vitamin D status.
Summary and conclusions
A central controversy in vitamin D research is how to define hypovitaminosis D. Among the possible markers, serum total 25(OH)D is currently considered to be the best marker of vitamin D status. In the absence of consensus, at this time, 25(OH)D values below 12 ng ml–1 (30 nmol l–1) should be considered to be associated with an increased risk of rickets/osteomalacia, while 25(OH)D concentrations between 20 ng ml–1 and 50 ng ml–1 (50–125 nmol l–1) appear to be safe and sufficient. To resolve this controversy, related to the definition of hypovitaminosis D, it will be necessary to: (i) standardize the measurement of serum total 25(OH)D in vitamin D research, as well as standardize/harmonize the measurement of other possible markers of vitamin D status; and (ii) develop/conduct a rickets registry which includes a precise case definition of nutritional rickets, including other risk factors for nutritional rickets and standardized measurements of 25(OH)D and vitamin D metabolites.
Nomenclature of targets and ligands
Key protein targets and ligands in this article are hyperlinked to corresponding entries in http://www.guidetopharmacology.org, the common portal for data from the IUPHAR/BPS Guide to PHARMACOLOGY 120, and are permanently archived in the Concise Guide to PHARMACOLOGY 2017/18.
Competing Interests
This article is a product of the First International Conference on Controversies on Vitamin D. It was held on 14–16 June 2017, in Pisa, Italy. The meeting was funded through an unrestricted grant provided by Abiogen Pharma, Pisa, Italy. Abiogen Pharma had no role in the selection of discussion topics, speakers/authors or the preparation of this article.
Sempos, C. T. , Heijboer, A. C. , Bikle, D. D. , Bollerslev, J. , Bouillon, R. , Brannon, P. M. , DeLuca, H. F. , Jones, G. , Munns, C. F. , Bilezikian, J. P. , Giustina, A. , and Binkley, N. (2018) Vitamin D assays and the definition of hypovitaminosis D: results from the First International Conference on Controversies in Vitamin D. Br J Clin Pharmacol, 84: 2194–2207. 10.1111/bcp.13652.
References
- 1. Bouillon R. Comparative analysis of nutritional guidelines for vitamin D. Nat Rev Endocrinol 2017; 13: 466–479. [DOI] [PubMed] [Google Scholar]
- 2. Institute of Medicine (US) Committee to Review Dietary Reference Intakes for Vitamin D and Calcium. Dietary Reference Intakes for Calcium and Vitamin D. Ross AC, Taylor CL, Yaktine AL, Del Valle HB, editors. Washington, DC: National Academies Press. 2011. pp. 1115. [PubMed]
- 3. Holick MF, Binkley N, Bischoff‐Ferrari HA, Gordon CM, Hanley DA, Heaney RP, et al Evaluation, treatment, and prevention of vitamin D deficiency: an Endocrine Society Clinical Practice Guideline. J Clin Endocrinol Metab 2011; 96: 1911–1930. [DOI] [PubMed] [Google Scholar]
- 4. Scientific Advisory Committee on Nutrition (SACN) . SACN vitamin D and health report. Public Health England, 2016.
- 5. Binkley N, Dawson‐Hughes B, Durazo‐Arvizu R, Thamm M, Tian L, Merkel JM, et al Vitamin D measurement standardization: the way out of the chaos. J Steroid Biochem Mol Biol 2017; 173: 117–121. [DOI] [PubMed] [Google Scholar]
- 6. Heijboer AC, Blankenstein MA, Kema IP, Buijs MM. Accuracy of 6 routine 25‐hydroxyvitamin D assays: influence of vitamin D binding protein concentration. Clin Chem 2012; 58: 543–548. [DOI] [PubMed] [Google Scholar]
- 7. Munns CF, Shaw N, Kiely M, Specker BL, Thacher TD, Ozono K, et al Global Consensus Recommendations on Prevention and Management of Nutritional Rickets. J Clin Endocrinol Metab 2016; 101: 394–415. [DOI] [PMC free article] [PubMed] [Google Scholar]
- 8. Uday S, Hogler W. Nutritional rickets and osteomalacia in the twenty‐first century: revised concepts, public health, and prevention strategies. Curr Osteoporos Rep 2017; 15: 293–302. [DOI] [PMC free article] [PubMed] [Google Scholar]
- 9. Jones G, Kaufmann M. Vitamin D metabolite profiling using liquid chromatography–tandem mass spectrometry (LC–MS/MS). J Steroid Biochem Mol Biol 2016; 164: 110–114. [DOI] [PubMed] [Google Scholar]
- 10. Herrmann M, Farrell CL, Pusceddu I, Fabregat‐Cabello N, Cavalier E. Assessment of vitamin D status – a changing landscape. Clin Chem Lab Med 2017; 55: 3–26. [DOI] [PubMed] [Google Scholar]
- 11. Singh RJ, Taylor RL, Reddy GS, Grebe SK. C‐3 epimers can account for a significant portion of total circulating 25‐hydroxyvitamin D in infants, complicating accurate measurement and interpretation of vitamin D status. J Clin Endocrinol Metab 2006; 91: 3055–3061. [DOI] [PubMed] [Google Scholar]
- 12. Gallo S, Comeau K, Agellon S, Vanstone C, Sharma A, Jones G, et al Methodological issues in assessing plasma 25‐hydroxyvitamin D concentration in newborn infants. Bone 2014; 61: 186–190. [DOI] [PubMed] [Google Scholar]
- 13. Myers GL. Introduction to standardization of laboratory results. Steroids 2008; 73: 1293–1296. [DOI] [PubMed] [Google Scholar]
- 14. Greg Miller W, Myers GL, Lou Gantzer M, Kahn SE, Schonbrunner ER, Thienpont LM, et al Roadmap for harmonization of clinical laboratory measurement procedures. Clin Chem 2011; 57: 1108–1117. [DOI] [PubMed] [Google Scholar]
- 15. Binkley N, Sempos CT. Standardizing vitamin D assays: the way forward. J Bone Miner Res 2014; 29: 1709–1714. [DOI] [PMC free article] [PubMed] [Google Scholar]
- 16. Tai SSC, Bedner M, Phinney KW. Development of a candidate reference measurement procedure for the determination of 25‐hydroxyvitamin D3 and 25‐hydroxyvitamin D2 in human serum using isotope‐dilution liquid chromatography–tandem mass spectrometry. Anal Chem 2010; 82: 1942–1948. [DOI] [PMC free article] [PubMed] [Google Scholar]
- 17. Sempos CT, Vesper HW, Phinney KW, Thienpont LM, Coates PM; Vitamin D Standardization Program (VDSP) . Vitamin D status as an international issue: national surveys and the problem of standardization. Scand J Clin Lab Invest Suppl 2012; 243: 32–40. [DOI] [PubMed] [Google Scholar]
- 18. Carter GD, Berry J, Durazo‐Arvizu R, Gunter E, Jones G, Jones J, et al Hydroxyvitamin D assays: an historical perspective from DEQAS. J Steroid Biochem Mol Biol 2018; 177: 30–35. [DOI] [PubMed] [Google Scholar]
- 19. Binkley N, Carter GD. Toward clarity in clinical vitamin D status assessment. Endocrinol Metab Clin North Am 46: 885–899. [DOI] [PubMed] [Google Scholar]
- 20. Ginde AA, Liu MC, Camargo CA. Demographic differences and trends of vitamin D insufficiency in the US population, 1988–2004. Arch Intern Med 2009; 169: 626–632. [DOI] [PMC free article] [PubMed] [Google Scholar]
- 21. Schleicher RL, Sternberg MR, Lacher DA, Sempos CT, Looker AC, Durazo‐Arvizu RA, et al A method‐bridging study for serum 25‐hydroxyvitamin D to standardize historical radioimmunoassay data to liquid chromatography–tandem mass spectrometry. Natl Health Stat Rep 2016; 100: 1–16. [PubMed] [Google Scholar]
- 22. Cashman KD, Dowling KG, Skrabakova Z, Kiely M, Lamberg‐Allardt C, Durazo‐Arvizu RA, et al Standardizing serum 25‐hydroxyvitamin D data from four Nordic population samples using the vitamin D standardization program protocols: shedding new light on vitamin D status in Nordic individuals. Scand J Clin Lab Invest 2015; 75: 549–561. [DOI] [PubMed] [Google Scholar]
- 23. Cashman KD, Dowling KG, Skrabakova Z, Gonzalez‐Gross M, Valtuena J, De Henauw S, et al Vitamin D deficiency in Europe: pandemic? Am J Clin Nutr 2016; 103: 1033–1044. [DOI] [PMC free article] [PubMed] [Google Scholar]
- 24. Deane A, Constancio L, Fogelman I, Hampson G. The impact of vitamin D status on changes in bone mineral density during treatment with bisphosphonates and after discontinuation following long‐term use in post‐menopausal osteoporosis. BMC Musculoskelet Disord 2007; 8: 3. [DOI] [PMC free article] [PubMed] [Google Scholar]
- 25. Sempos CT, Durazo‐Arvizu RA, Binkley N, Jones J, Merkel JM, Carter GD. Developing vitamin D dietary guidelines and the lack of 25‐hydroxyvitamin D assay standardization: the ever‐present past. J Steroid Biochem Mol Biol 2016; 164: 115–119. [DOI] [PubMed] [Google Scholar]
- 26. Durazo‐Arvizu RA, Tian L, Brooks SPJ, Sarafin K, Cashman KD, Kiely M, et al The Vitamin D Standardization Program (VDSP) Manual for Retrospective Laboratory Standardization of Serum 25‐Hydroxyvitamin D Data. J AOAC Int 2017; 100: 1234–1243. [DOI] [PubMed] [Google Scholar]
- 27. Le Goff C, Cavalier E, Souberbielle J‐C, Gonzalez‐Antuna A, Delvin E. Measurement of circulating 25‐hydroxyvitamin D: a historical review. Pract Lab Med 2015; 2: 1–14. [DOI] [PMC free article] [PubMed] [Google Scholar]
- 28. de la Hunty A, Wallace AM, Gibson S, Viljakainen H, Lamberg‐Allardt C, Ashwell M. UK foods standards agency workshop consensus report: the choice of method for measuring 25‐hydroxyvitamin D to estimate vitamin D status for the UK National Diet and Nutrition Survey. Br J Nutr 2010; 104: 612–619. [DOI] [PubMed] [Google Scholar]
- 29. Center for Disease Control . CDC Laboratory quality assurance and standardization programs. VDSCP: Vitamin D Standardization‐Certification Program website. Available at https://www.cdc.gov/labstandards/vdscp.html (last accessed 2 July 2018).
- 30. Thienpont LM, Stepman HC, Vesper HW. Standardization of measurements of 25‐hydroxyvitamin D3 and D2. Scand J Clin Lab Invest Suppl 2012; 243: 41–49. [DOI] [PMC free article] [PubMed] [Google Scholar]
- 31. Carter GD, Berry J, Durazo‐Arvizu R, Gunter E, Jones G, Jones J, et al Quality assessment of vitamin D metabolite assays used by clinical and research laboratories. J Steroid Biochem Mol Biol 2017; 173: 100–104. [DOI] [PubMed] [Google Scholar]
- 32. Burdette CQ, Camara JE, Nalin F, Pritchett J, Sander LC, Carter GD, et al Establishing an accuracy basis for the Vitamin D External Quality Assessment Scheme (DEQAS). J AOAC Int 2017; 100: 1277–1287. [DOI] [PubMed] [Google Scholar]
- 33. Depreter B, Heijboer AC, Langlois MR. Accuracy of three automated 25‐hydroxyvitamin D assays in hemodialysis patients. Clin Chim Acta 2013; 415: 255–260. [DOI] [PubMed] [Google Scholar]
- 34. Cavalier E, Lukas P, Crine Y, Peeters S, Carlisi A, Le Goff C, et al Evaluation of automated immunoassays for 25 (OH)‐vitamin D determination in different critical populations before and after standardization of the assays. Clin Chim Acta 2014; 431: 60–65. [DOI] [PubMed] [Google Scholar]
- 35. Carter GD. 25‐hydroxyvitamin D: a difficult analyte. Clin Chem 2012; 58: 486–488. [DOI] [PubMed] [Google Scholar]
- 36. Shu I, Pina‐Oviedo S, Quiroga‐Garza G, Meng QH, Wang P. Influence of vitamin D2 percentage on accuracy of 4 commercial total 25‐hydroxyvitamin D assays. Clin Chem 2013; 59: 1273–1275. [DOI] [PubMed] [Google Scholar]
- 37. Moreau E, Bacher S, Mery S, Le Goff C, Piga N, Vogeser M, et al Performance characteristics of the VIDAS (R) 25‐OH vitamin D total assay – comparison with four immunoassays and two liquid chromatography–tandem mass spectrometry methods in a multicentric study. Clin Chem Lab Med 2016; 54: 45–53. [DOI] [PubMed] [Google Scholar]
- 38. Binkley N, Gemar D, Engelke J, Gangnon R, Ramamurthy R, Krueger D, et al Evaluation of ergocalciferol or cholecalciferol dosing, 1600 IU daily or 5 0000 IU monthly in older adults. J Clin Endocrinol Metab 2011; 96: 981–988. [DOI] [PMC free article] [PubMed] [Google Scholar]
- 39. Carter GD, Jones JC, Shannon J, Williams EL, Jones G, Kaufmann M, et al 25‐hydroxyvitamin D assays: potential interference from other circulating vitamin D metabolites. J Steroid Biochem Mol Biol 2016; 164: 134–138. [DOI] [PubMed] [Google Scholar]
- 40. Cashman KD, Hayes A, Galvin K, Merkel J, Jones G, Kaufmann M, et al Significance of serum 24,25‐dihydroxyvitamin D in the assessment of vitamin D status: a double‐edged sword? Clin Chem 2015; 61: 636–645. [DOI] [PubMed] [Google Scholar]
- 41. Phinney KW, Sempos CT, Tai SS, Camara JE, Wise SA, Eckfeldt JH, et al Baseline assessment of 25‐hydroxyvitamin D reference material and proficiency testing/external quality assurance material commutability: a Vitamin D Standardization Program study. J AOAC Int 2017; 100: 1288–1293. [DOI] [PubMed] [Google Scholar]
- 42. Wise SA, Phinney KW, Tai SS, Camara JE, Myers GL, Durazo‐Arvizu R, et al Baseline assessment of 25‐hydroxyvitamin D assay performance: a Vitamin D Standardization Program (VDSP) interlaboratory comparison study. J AOAC Int 2017; 100: 1244–1252. [DOI] [PubMed] [Google Scholar]
- 43. Stepman HC, Vanderroost A, Stockl D, Thienpont LM. Full‐scan mass spectral evidence for 3‐epi‐25‐hydroxyvitamin D(3) in serum of infants and adults. Clin Chem Lab Med 2011; 49: 253–256. [DOI] [PubMed] [Google Scholar]
- 44. Lensmeyer GL, Poquette M, Wiebe DA, Binkley N. The C‐3 epimer of 25‐hydroxyvitamin D3 is present in adult serum. J Clin Endocrinol Metab 2012; 97: 163–168. [DOI] [PubMed] [Google Scholar]
- 45. Schleicher RL, Sternberg MR, Lacher DA, Sempos CT, Looker AC, Durazo‐Arvizu RA, et al The vitamin D status of the US population from 1988 to 2010 using standardized serum concentrations of 25‐hydroxyvitamin D shows recent modest increases. Am J Clin Nutr 2016; 104: 454–461. [DOI] [PMC free article] [PubMed] [Google Scholar]
- 46. Rousseau AF, Damas P, Janssens M, Kalin S, Ledoux D, Le Goff C, et al Critical care and vitamin D status assessment: what about immunoassays and calculated free 25OH‐D? Clin Chim Acta 2014; 437: 43–47. [DOI] [PubMed] [Google Scholar]
- 47. Cavalier E, Lukas P, Bekaert AC, Carlisi A, Le Goff C, Delanaye P, et al Analytical and clinical validation of the new Abbot Architect 25(OH)D assay: fit for purpose? Clin Chem Lab Med 2017; 55: 378–384. [DOI] [PubMed] [Google Scholar]
- 48. Sempos CT, Betz JM, Camara JE, Carter GD, Cavalier E, Clarke MW, et al General steps to standardize the laboratory measurement of serum total 25‐hydroxyvitamin D. J AOAC Int 2017; 100: 1230–1233. [DOI] [PubMed] [Google Scholar]
- 49. Cashman KD, Kiely M, Kinsella M, Durazo‐Arvizu RA, Tian L, Zhang Y, et al Evaluation of vitamin D standardization program protocols for standardizing serum 25‐hydroxyvitamin D data: a case study of the program's potential for national nutrition and health surveys. Am J Clin Nutr 2013; 97: 1235–1242. [DOI] [PMC free article] [PubMed] [Google Scholar]
- 50. Certificate of analysis . Standard reference material 2972a – 25‐hydroxyvitamin D calibrating solutions. Available at https://www-s.nist.gov/m-srmors/certificates/2972a.pdf (last accessed 2 July 2018).
- 51. Certificate of analysis . Standard reference material 972a – vitamin D metabolites in frozen human serum. Available at https://www-s.nist.gov/srmors/view_cert.cfm?srm=972A (last accessed 2 July 2018).
- 52. Certificatie of Analysis . Standard reference material 2973 ‐ vitamin D metabolites in frozen human serum (High Value). Available at https://nemo.nist.gov/srmors/view_detail.cfm?srm=2973 (last accessed 2 July 2018).
- 53. Phinney KW, Tai SS, Bedner M, Camara JE, Chia RRC, Sander LC, et al Development of an improved standard reference material for vitamin D metabolites in human serum. Anal Chem 2017; 89: 4907–4913. [DOI] [PMC free article] [PubMed] [Google Scholar]
- 54. Tai S, Nelson M, Bedner M, Lang B, Phinney K, Sander L, et al Development of standard reference material (SRM) 2973 vitamin D metabolites in frozen human serum (high level). J AOAC Int 2017; 100: 1294–1303. [DOI] [PubMed] [Google Scholar]
- 55. Stockl D, Sluss PM, Thienpont LM. Specifications for trueness and precision of a reference measurement system for serum/plasma 25‐hydroxyvitamin D analysis. Clin Chim Acta 2009; 408: 8–13. [DOI] [PubMed] [Google Scholar]
- 56. Stepman HC, Vanderroost A, Van Uytfanghe K, Thienpont LM. Candidate reference measurement procedures for serum 25‐hydroxyvitamin D3 and 25‐hydroxyvitamin D2 by using isotope‐dilution liquid chromatography–tandem mass spectrometry. Clin Chem 2011; 57: 441–448. [DOI] [PubMed] [Google Scholar]
- 57. Mineva EM, Schleicher RL, Chaudhary‐Webb M, Maw KL, Botelho JC, Vesper HW, et al A candidate reference measurement procedure for quantifying serum concentrations of 25‐hydroxyvitamin D(3) and 25‐hydroxyvitamin D(2) using isotope‐dilution liquid chromatography–tandem mass spectrometry. Anal Bioanal Chem 2015; 407: 5615–5624. [DOI] [PMC free article] [PubMed] [Google Scholar]
- 58. College of American Pathologists . Accuracy‐based vitamin D (ABVD). Proficiency testing/EQA. Available at https://estore.cap.org/OA_HTML/ibeCCtpSctDspRte.jsp?section=10373&sitex=10020:22372:US (last accessed 2 July 2018).
- 59. Endocrine Laboratory, Charing Cross Hospital . DEQAS (Vitamin D External Quality Assessment Scheme). Available at http://www.deqas.org/ (last accessed 2 July 2018).
- 60. James D, Ames D, Lopez B, Still R, Simpson W, Twomey P. External quality assessment: best practice. J Clin Pathol 2014; 67: 651–655. [DOI] [PubMed] [Google Scholar]
- 61. Mendel CM. The free hormone hypothesis. Distinction from the free hormone transport hypothesis. J Androl 1992; 13: 107–116. [PubMed] [Google Scholar]
- 62. Chait A, Brunzell JD, Denke MA, Eisenberg D, Ernst ND, Franklin FA Jr, et al Rationale of the diet‐heart statement of the American Heart Association. Report of the Nutrition Committee. Circulation 1993; 88: 3008–3029. [DOI] [PubMed] [Google Scholar]
- 63. Jackson R. Updated New Zealand cardiovascular disease risk–benefit prediction guide. BMJ 2000; 320: 709–710. [DOI] [PMC free article] [PubMed] [Google Scholar]
- 64. Consensus Conference . Lowering blood cholesterol to prevent heart disease. JAMA 1985; 253: 2080–2086. [PubMed] [Google Scholar]
- 65. The Expert Panel . Report of the National Cholesterol Education Program Expert Panel on Detection, Evaluation, and Treatment of High Blood Cholesterol in Adults. Arch Intern Med 1988; 148: 36–69. [PubMed] [Google Scholar]
- 66. Carleton RA, Dwyer J, Finberg L, Flora J, Goodman DS, Grundy SM, et al Report of the Expert Panel on Population Strategies for Blood Cholesterol Reduction. A statement from the National Cholesterol Education Program, National Heart, Lung, and Blood Institute, National Institutes of Health. Circulation 1991; 83: 2154–2232. [DOI] [PubMed] [Google Scholar]
- 67. Fabregat‐Cabello N, Farre‐Segura J, Huyghebaert L, Peeters S, Le Goff C, Souberbielle JC, et al A fast and simple method for simultaneous measurements of 25(OH) D, 24,25 (OH)2D and the vitamin D metabolite ratio (VMR) in serum samples by LC–MS/MS. Clin Chim Acta 2017; 473: 116–123. [DOI] [PubMed] [Google Scholar]
- 68. Wiebe D, Binkley N. Case report: Three patients with substantial serum levels of 3‐epi‐25(OH)D including one with 3‐epi‐25(OH)D2 while on high‐dose ergocalciferol. J Clin Endocrinol Metab 2014;99:1117–1121. [DOI] [PMC free article] [PubMed] [Google Scholar]
- 69. Jones G, Prosser DE, Kaufmann M. 25‐Hydroxyvitamin D‐24‐hydroxylase (CYP24A1): its important role in the degradation of vitamin D. Arch Biochem Biophys 2012; 523: 9–18. [DOI] [PubMed] [Google Scholar]
- 70. Wagner D, Hanwell HE, Schnabl K, Yazdanpanah M, Kimball S, Fu L, et al The ratio of serum 24, 25‐dihydroxyvitamin D3 to serum 25‐hydroxyvitamin D3 is predictive of 25‐hydroxyvitamin D3 response to vitamin D3 supplementation. J Steroid Biochem Mol Biol 2011; 126: 72–77. [DOI] [PubMed] [Google Scholar]
- 71. Wise SA, Tai SS, Nelson MA, Burdette CQ, Camara JE, Hoofnagle AN, et al Interlaboratory comparison for the determination of 24,25‐dihydroxyvitamin D(3) in human serum using liquid chromatography with tandem mass spectrometry. J AOAC Int 2017; 100: 1308–1317. [DOI] [PubMed] [Google Scholar]
- 72. Kaufmann M, Gallagher C, Peacock M, Schlingmann KP, Konrad M, Deluca HF, et al Clinical utility of simultaneous quantitation of 25‐hydroxyvitamin D & 24,25‐dihydroxyvitamin D by LC–MS/MS involving derivatization with DMEQ‐TAD. J Clin Endocrinol Metab 2014; 99: 2567–2574. [DOI] [PMC free article] [PubMed] [Google Scholar]
- 73. Tebben PJ, Singh RJ, Kumar R. Vitamin D‐mediated hypercalcemia: mechanisms, diagnosis, and treatment. Endocr Rev 2016; 37: 521–547. [DOI] [PMC free article] [PubMed] [Google Scholar]
- 74. Molin A, Baudoin R, Kaufmann M, Souberbielle JC, Ryckewaert A, Vantyghem MC, et al CYP24A1 mutations in a cohort of hypercalcemic patients: evidence for a recessive trait. J Clin Endocrinol Metab 2015; 100: E1343–E1352. [DOI] [PubMed] [Google Scholar]
- 75. Kaufmann M, Morse N, Molloy BJ, Cooper DP, Schlingmann KP, Molin A, et al Improved screening test for idiopathic infantile hypercalcemia confirms residual levels of serum 24,25‐(OH)2 D3 in affected patients. J Bone Miner Res 2017; 32: 1589–1596. [DOI] [PubMed] [Google Scholar]
- 76. Edouard T, Husseini A, Glorieux FH, Rauch F. Serum 24,25‐dihydroxyvitamin D concentrations in osteogenesis imperfecta: relationship to bone parameters. J Clin Endocrinol Metab 2012; 97: 1243–1249. [DOI] [PubMed] [Google Scholar]
- 77. Jones G, Schlingmann K‐P. Hypercalcemic states associated with abnormalities in vitamin D metabolism In: Vitamin D in Clinical Medicine, eds Giustina A, Bilezikian JP. Basal, Switzerland: Karger, 2018; 89–113. [Google Scholar]
- 78. Graeff‐Armas LA, Kaufmann M, Lyden E, Jones G. Serum 24,25‐dihydroxyvitamin D3 response to native vitamin D2 and D3 supplementation in patients with chronic kidney disease on hemodialysis. Clin Nutr 2018; 37: 1041–1045. [DOI] [PubMed] [Google Scholar]
- 79. Aloia J, Fazzari M, Shieh A, Dhaliwal R, Mikhail M, Hoofnagle AN, et al The vitamin D metabolite ratio (VMR) as a predictor of functional biomarkers of bone health. Clin Endocrinol 2017; 86: 674–679. [DOI] [PMC free article] [PubMed] [Google Scholar]
- 80. Tai SS, Nelson MA. Candidate reference measurement procedure for the determination of (24R),25‐dihydroxyvitamin D3 in human serum using isotope‐dilution liquid chromatography–tandem mass spectrometry. Anal Chem 2015; 87: 7964–7970. [DOI] [PubMed] [Google Scholar]
- 81. Chun RF. New perspectives on the vitamin D binding protein. Cell Biochem Funct 2012; 30: 445–456. [DOI] [PubMed] [Google Scholar]
- 82. Bouillon R. The Vitamin D Binding Protein DBP. Waltham, MA: Academic Press, 2011. [Google Scholar]
- 83. Bogani F, McConnell E, Joshi L, Chang Y, Ghirlanda G. A designed glycoprotein analogue of Gc‐MAF exhibits native‐like phagocytic activity. J Am Chem Soc 2006; 128: 7142–7143. [DOI] [PubMed] [Google Scholar]
- 84. Kongsbak M, von Essen MR, Levring TB, Schjerling P, Woetmann A, Odum N, et al Vitamin D‐binding protein controls T cell responses to vitamin D. BMC Immunol 2014; 15: 35. [DOI] [PMC free article] [PubMed] [Google Scholar]
- 85. Delanghe JR, Speeckaert R, Speeckaert MM. Behind the scenes of vitamin D binding protein: more than vitamin D binding. Best Pract Res Clin Endocrinol Metab 2015; 29: 773–786. [DOI] [PubMed] [Google Scholar]
- 86. Bouillon R, Pauwels S. Vitamin D‐binding protein In: Vitamin D, 4th edn, eds Feldman D, Pike JW, Bouillon R, Giovannucci E, Goldsman D, Hewison M. Waltham, MA: Academic Press, 2017; 97–115. [Google Scholar]
- 87. Denburg MR, Hoofnagle AN, Sayed S, Gupta J, de Boer IH, Appel LJ, et al Comparison of two ELISA methods and mass spectrometry for measurement of vitamin D‐binding protein: implications for the assessment of bioavailable vitamin D concentrations across genotypes. J Bone Miner Res 2016; 31: 1128–1136. [DOI] [PMC free article] [PubMed] [Google Scholar]
- 88. Arnaud J, Constans J. Affinity differences for vitamin D metabolites associated with the genetic isoforms of the human serum carrier protein (DBP). Hum Genet 1993; 92: 183–188. [DOI] [PubMed] [Google Scholar]
- 89. Bikle D, Bouillon R, Thadhani R, Schoenmakers I. Vitamin D metabolites in captivity? Should we measure free or total 25 (OH) D to assess vitamin D status? J Steroid Biochem Mol Biol 2017; 173: 105–116. [DOI] [PMC free article] [PubMed] [Google Scholar]
- 90. Hoofnagle AN, Eckfeldt JH, Lutsey PL. Vitamin D‐binding protein concentrations quantified by mass spectrometry. N Engl J Med 2015; 373: 1480–1482. [DOI] [PMC free article] [PubMed] [Google Scholar]
- 91. Nielson CM, Jones KS, Chun RF, Jacobs JM, Wang Y, Hewison M, et al Free 25‐hydroxyvitamin D: impact of vitamin D binding protein assays on racial‐genotypic associations. J Clin Endocrinol Metab 2016; 101: 2226–2234. [DOI] [PMC free article] [PubMed] [Google Scholar]
- 92. Kilpatrick LE, Phinney KW. Quantification of total vitamin‐D‐binding protein and the glycosylated isoforms by liquid chromatography‐isotope dilution mass spectrometry. J Proteome Res 2017; 16: 4185–4195. [DOI] [PubMed] [Google Scholar]
- 93. Malmstroem S, Rejnmark L, Imboden JB, Shoback DM, Bikle DD. Current assays to determine free 25‐hydroxyvitamin D in serum. J AOAC Int 2017; 100: 1323–1327. [DOI] [PubMed] [Google Scholar]
- 94. Chun RF, Peercy BE, Orwoll ES, Nielson CM, Adams JS, Hewison M. Vitamin D and DBP: the free hormone hypothesis revisited. J Steroid Biochem Mol Biol 2014; 144 (Pt A): 132–137. [DOI] [PMC free article] [PubMed] [Google Scholar]
- 95. Bouillon R, Van Assche FA, Van Baelen H, Heyns W, De Moor P. Influence of the vitamin D‐binding protein on the serum concentration of 1,25‐dihydroxyvitamin D3. Significance of the free 1,25‐dihydroxyvitamin D3 concentration. J Clin Invest 1981; 67: 589–596. [DOI] [PMC free article] [PubMed] [Google Scholar]
- 96. Safadi FF, Thornton P, Magiera H, Hollis BW, Gentile M, Haddad JG, et al Osteopathy and resistance to vitamin D toxicity in mice null for vitamin D binding protein. J Clin Invest 1999; 103: 239–251. [DOI] [PMC free article] [PubMed] [Google Scholar]
- 97. Heureux N, Lindhout E, Swinkels L. A direct assay for measuring free 25‐hydroxyvitamin D. J AOAC Int 2017; 100: 1318–1322. [DOI] [PubMed] [Google Scholar]
- 98. Diasource . Free 25OH vitamin D, ELISA, 96 tests CE‐marked. Available at http://www.diasource-diagnostics.com (last accessed 2 July 2018).
- 99. Schwartz JB, Lai J, Lizaola B, Kane L, Markova S, Weyland P, et al A comparison of measured and calculated free 25 (OH) vitamin D levels in clinical populations. J Clin Endocrinol Metab 2014; 99: 1631–1637. [DOI] [PMC free article] [PubMed] [Google Scholar]
- 100. Higashi T, Shibayama Y, Fuji M, Shimada K. Liquid chromatography‐tandem mass spectrometric method for the determination of salivary 25‐hydroxyvitamin D3: a noninvasive tool for the assessment of vitamin D status. Anal Bioanal Chem 2008; 391: 229–238. [DOI] [PubMed] [Google Scholar]
- 101. Bikle D. Vitamin D assays In: Vitamin D in Clinical Medicine, eds Giustina A, Bilezikian JP. Karger: Basal, Switzerland, 2018; 31–41. [Google Scholar]
- 102. Chun RF, Hernandez I, Pereira R, Swinkles L, Huijs T, Zhou R, et al Differential responses to vitamin D2 and vitamin D3 are associated with variations in free 25‐hydroxyvitamin D. Endocrinology 2016; 157: 3420–3430. [DOI] [PMC free article] [PubMed] [Google Scholar]
- 103. Bikle DD, Malmstroem S, Schwartz J. Current controversies: Are free vitamin metabolite levels a more accurate assessment of vitamin D status than total levels? Endocrinol Metab Clin North Am 2017; 46: 901–918. [DOI] [PMC free article] [PubMed] [Google Scholar]
- 104. Trummer C, Schwetz V, Pandis M, Grübler MR, Verheyen N, Gaksch M, et al Effects of vitamin D supplementation on FGF23: a randomized‐controlled trial. Eur J Nutr 2018. 10.1007/s00394-018-1760-8 [DOI] [PMC free article] [PubMed] [Google Scholar]
- 105. Heijboer AC, Levitus M, Vervloet MG, Lips P, ter Wee PM, Dijstelbloem HM, et al Determination of fibroblast growth factor 23. Ann Clin Biochem 2009; 46 (Pt 4): 338–340. [DOI] [PubMed] [Google Scholar]
- 106. Smith ER, McMahon LP, Holt SG. Method‐specific differences in plasma fibroblast growth factor 23 measurement using four commercial ELISAs. Clin Chem Lab Med 2013; 51: 1971–1981. [DOI] [PubMed] [Google Scholar]
- 107. El‐Maouche D, Dumitrescu CE, Andreopoulou P, Gafni RI, Brillante BA, Bhattacharyya N, et al Stability and degradation of fibroblast growth factor 23 (FGF23): the effect of time and temperature and assay type. Osteoporos Int 2016; 27: 2345–2353. [DOI] [PubMed] [Google Scholar]
- 108. Ito N, Fukumoto S, Takeuchi Y, Yasuda T, Hasegawa Y, Takemoto F, et al Comparison of two assays for fibroblast growth factor (FGF)‐23. J Bone Miner Metab 2005; 23: 435–440. [DOI] [PubMed] [Google Scholar]
- 109. Smith ER, Ford ML, Tomlinson LA, Weaving G, Rocks BF, Rajkumar C, et al Instability of fibroblast growth factor‐23 (FGF‐23): implications for clinical studies. Clin Chim Acta 2011; 412: 1008–1011. [DOI] [PubMed] [Google Scholar]
- 110. DeLuca HF. The vitamin D system in the regulation of calcium and phosphorus metabolism. Nutr Rev 1979; 37: 161–193. [DOI] [PubMed] [Google Scholar]
- 111. Jones G. Metabolism and biomarkers of vitamin D. Scand J Clin Lab Invest Suppl 2012; 243: 7–13. [DOI] [PubMed] [Google Scholar]
- 112. Schlingmann KP, Kaufmann M, Weber S, Irwin A, Goos C, John U, et al Mutations in CYP24A1 and idiopathic infantile hypercalcemia. N Engl J Med 2011; 365: 410–421. [DOI] [PubMed] [Google Scholar]
- 113. Pauwels S, Jans I, Billen J, Heijboer A, Verstuyf A, Carmeliet G, et al 1beta,25‐Dihydroxyvitamin D3: a new vitamin D metabolite in human serum. J Steroid Biochem Mol Biol 2017; 173: 341–348. [DOI] [PubMed] [Google Scholar]
- 114. Manson JE, Brannon PM, Rosen CJ, Taylor CL. Vitamin D deficiency – is there really a pandemic? N Engl J Med 2016; 375: 1817–1820. [DOI] [PubMed] [Google Scholar]
- 115. Bouillon R, Van Schoor NM, Gielen E, Boonen S, Mathieu C, Vanderschueren D, et al Optimal vitamin D status: a critical analysis on the basis of evidence‐based medicine. J Clin Endocrinol Metab 2013; 98: E1283–E1304. [DOI] [PubMed] [Google Scholar]
- 116. Durazo‐Arvizu RA, Dawson‐Hughes B, Sempos CT, Yetley EA, Looker AC, Cao G, et al Three‐phase model harmonizes estimates of the maximal suppression of parathyroid hormone by 25‐hydroxyvitamin D in persons 65 years of age and older. J Nutr 2010; 140: 595–599. [DOI] [PMC free article] [PubMed] [Google Scholar]
- 117. Cole DE, Webb S, Chan PC. Update on parathyroid hormone: new tests and new challenges for external quality assessment. Clin Biochem 2007; 40: 585–590. [DOI] [PubMed] [Google Scholar]
- 118. Sturgeon CM, Sprague SM, Metcalfe W. Variation in parathyroid hormone immunoassay results – a critical governance issue in the management of chronic kidney disease. Nephrol Dial Transplant 2011; 26: 3440–3445. [DOI] [PMC free article] [PubMed] [Google Scholar]
- 119. Sturgeon CM, Sprague S, Almond A, Cavalier E, Fraser WD, Algeciras‐Schimnich A, et al Perspective and priorities for improvement of parathyroid hormone (PTH) measurement – a view from the IFCC Working Group for PTH. Clin Chim Acta 2017; 467: 42–47. [DOI] [PMC free article] [PubMed] [Google Scholar]
- 120. Harding SD, Sharman JL, Faccenda E, Southan C, Pawson AJ, Ireland S, et al The IUPHAR/BPS Guide to PHARMACOLOGY in 2018: updates and expansion to encompass the new guide to IMMUNOPHARMACOLOGY. Nucl Acids Res 2018; 46: D1091–D1106. [DOI] [PMC free article] [PubMed] [Google Scholar]