

Abstract
Aims
Bedaquiline is an important novel drug for treatment of multidrug‐resistant tuberculosis, but no paediatric formulation is yet available. This work aimed to explore the possibility of using the existing tablet formulation in children by evaluating the relative bioavailability, short‐term safety, acceptability and palatability of suspended bedaquiline tablets compared to whole tablets.
Methods
A randomized, open‐label, two‐period cross‐over study was conducted in 24 healthy adult volunteers. Rich pharmacokinetic sampling over 48 h was conducted at two occasions 14 days apart in each participant after administration of 400 mg bedaquiline (whole or suspended in water). The pharmacokinetic data were analysed with nonlinear mixed‐effects modelling. A questionnaire was used to assess palatability and acceptability.
Results
There was no statistically significant difference in the bioavailability of the suspended bedaquiline tables compared to whole. The nonparametric 95% confidence interval of the relative bioavailability of suspended bedaquiline tablets was 94–108% of that of whole bedaquiline tablets; hence, the predefined bioequivalence criteria were fulfilled. There were no Grade 3 or 4 or serious treatment emergent adverse events recorded in the study and no apparent differences between whole tablets and suspension regarding taste, texture or smell.
Conclusions
The bioavailability of bedaquiline tablets suspended in water was the same as for tablets swallowed whole and the suspension was well tolerated. This suggests that the currently available bedaquiline formulation could be used to treat multidrug‐resistant tuberculosis in children, to bridge the gap between when paediatric dosing regimens have been established and when a paediatric dispersible formulation is routinely available.
Keywords: bedaquiline, bioavailability, paediatric dosing, population PK, suspended tablets
What is Already Known about this Subject
There is currently no paediatric formulation available of the novel antituberculosis drug bedaquiline
Important absorption properties such as the bioavailability can be altered if a drug formulation is manipulated to enable administration to children, for example through crushing or suspending the tablets
What this Study Adds
A precise estimate of the relative bioavailability of bedaquiline tablets suspended in water compared to when administered whole
Support for the use of suspended bedaquiline tablets as an option for treatment of multidrug‐resistant tuberculosis in children
Introduction
Bedaquiline, the first novel antituberculosis drug developed in decades, is increasingly used for treatment of multidrug‐resistant (MDR) tuberculosis (TB). Based on phase II trial data it received accelerated approval from the US Food and Drug Administration in 2012 and is included on the World Health Organization list of essential medicines. Bedaquiline is being rolled out for programmatic use globally 1. Janssen Pharmaceuticals has developed a paediatric dispersible formulation of bedaquiline and paediatric bedaquiline trials are now underway (Janssen C211, NCT02354014 and IMPAACT P1108, NCT02906007). However, considerably more time is needed for this formulation to become available for widespread routine care, limiting bedaquiline's immediate potential for use in young children.
Bedaquiline is a diarylquinoline that inhibits mycobacterial ATP‐synthase, resulting in potent antimycobacterial activity 2. The recommended adult dose is 400 mg daily for 2 weeks, then 200 mg thrice weekly for 22 weeks. In adults, the time to maximum bedaquiline serum concentrations is 4–6 h, with 2.0–2.4‐fold increased absorption when administered together with food 3. Absolute bioavailability, i.e. the fraction of the total dose administered which is absorbed to the systemic blood circulation, for bedaquiline is not known 4. Bedaquiline is primarily metabolized by CYP3A4 to M2 3. This leads to drug–drug interactions with several antiretroviral and anti‐TB compounds which induces or inhibits CYP3A4 5, 6, 7. Both bedaquiline and its M2 metabolite have cationic amphiphilic properties. They bind to phospholipids and accumulate in cells and tissues, resulting in long terminal elimination half‐lives (bedaquiline 164 days; M2 159 days) due to the slow release from tissues 3.
Bedaquiline 100 mg tablets are increasingly available for the treatment of adults with MDR TB, with global access improving rapidly 8, 9. These tablets could potentially be used for treatment of children. However, administration of these tablets to young children who cannot swallow tablets may require suspending or crushing the adult formulation. Such formulation manipulation for paediatric administration, which is commonly done for most second‐line TB drugs given in children, may affect the bioavailability 10. Characterizing the effect of suspending bedaquiline tablets on the bioavailability would inform the safe and effective use of this formulation in young children, potentially accelerating access to this much needed medication, given limited treatment options and availability of child‐friendly formulations in children.
The primary objective of this study was to evaluate the bioequivalence of bedaquiline tablets swallowed whole vs. suspended in water, based on the primary pharmacokinetic (PK) parameter affecting the extent of absorption, i.e. the bioavailability. Secondary objectives were to determine the impact of suspending the tablets on the time‐course of absorption, and to describe the palatability, acceptability and safety of whole vs. suspended bedaquiline.
Methods
Study design and participants
This was a randomized, open‐label, two‐period cross‐over study. Healthy male and female adults were eligible if they were aged 18–55 years and weighed 40–90 kg. Exclusion criteria included a history or clinical evidence of any of the following: QT prolongation, dysrhythmia or other significant cardiac conditions; other serious comorbid illness including but not limited to liver disease, kidney disease, human immunodeficiency virus infection, hepatitis B or C infection, hypothyroidism; use of QT prolonging medications or CYP3A4 inducers or inhibitors; suspected or documented current active TB or recent household TB exposure. The study was conducted in Cape Town, South Africa, from November to December 2016.
The sample size, the length of the washout‐period and the number and timing of PK samples were selected with help of clinical trial simulations. These were conducted with stochastic simulation and re‐estimation procedures, using a published population model of bedaquiline and M2 PK developed on data from healthy volunteers 5. The designs evaluated included washout periods between 2 and 28 days long, and 11–17 samples per dosing occasion. One hundred virtual trials were simulated for each design, assuming no difference in absorption characteristics for whole and suspended tablets. Model parameters were re‐estimated including factors allowing for differences in bioavailability, and delay and rate of absorption, between whole and suspended tablets. Effects on distribution‐ and elimination‐related parameters were not evaluated as these cannot be affected by the drug formulation. The power to show bioequivalence under the suggested design given that the two forms are truly equal, were evaluated by calculating in how many of the 100 trials the 95% confidence interval of the factors describing a difference between whole and suspended tablets were fully contained within the bioequivalence criteria, defined as 80–125% of the expected value 11. The selected design (described below) was estimated to have an 87% power (95% confidence interval 80–94%) to fulfil the formal bioequivalence criteria for bioavailability.
Intervention and randomization
The selected design included 24 participants who received a single dose of each treatment (formulation), with a washout period of 14 days between the two dosing occasions. Each bedaquiline tablet (Sirturo, Janssen Pharmaceuticals) contains 120.89 mg of bedaquiline fumarate drug substance, which is equivalent to 100 mg of bedaquiline. As tablets, 400 mg bedaquiline was administered as 4 × 100 mg tablets swallowed whole with 240 ml water. A bedaquiline suspension was prepared by adding 4 × 100 mg tablets to 30 ml clean water in a plastic dosing cup, using a metal spoon to stir and break up the tablets over 2 min. The suspension was administered within 5 min of adding the tablets to the water. An additional 20 ml of water was added to the dosing cup to rinse any residual medication from the cup and stirrer, and administered to the participant. Lastly, another 10 ml of water was added to the cup for a final rinse and then administered to the participant. All doses were administered within 30 min after a standardized breakfast consisting of approximately 670 kcal with at least 33% fat content.
Participants were randomized 1:1 to having bedaquiline administered as whole tablets at the first occasion, and then as tablets suspended in water on the second occasion, or the reverse. The randomization scheme was created using computer generated random numbers in a single block to ensure equal numbers of participants were assigned to each treatment sequence. Consecutively numbered, sealed, opaque envelopes were prepared by the study pharmacist and stored in a secure location at the site. After enrolment of a participant, the research pharmacist opened the next consecutively numbered envelope to determine the participant's allocation.
Data collection
Pharmacokinetic samples were drawn just before and at 1, 2, 3, 4, 5, 6, 8, 12, 24, 48 and 336 h after each dose (the 336 h sample for the first occasion also serving as the predose sample for the second). Whole blood samples were drawn into EDTA‐containing tubes and immediately placed on ice. Samples were centrifuged at 1500–2000 g within 1 h, plasma was separated and stored at –80°C until bioanalysis was performed.
All treatment emergent laboratory and clinical adverse events were recorded by the study team, and assessed for attribution to the study medication and for severity using the Division of AIDS Table for Grading the Severity of Adult and Pediatric Adverse Events (DAIDS AE Grading Table), Version 2.0, dated November 2014 by the site investigators. Twelve‐lead electrocardiograms were done at screening and on dosing days, just prior to the dose and at 4 h postdose. The QT interval was calculated using the Frederica correction and captured along with other clinically significant abnormalities. Safety laboratory monitoring included haematology, liver function tests and lactate.
A palatability/acceptability questionnaire was administered to each participant within 1 h of each dose. The questionnaire utilized a five‐point facial hedonic scale to assess taste, smell, visual appearance, texture, size/volume and overall acceptability of both treatments.
Bioanalysis
Bedaquiline and M2 concentrations were determined using a validated liquid chromatography–tandem mass spectrometry assay developed in the Division of Clinical Pharmacology, University of Cape Town, South Africa, validated according to Food and Drug Administration and European Medicines Agency guidelines, as previously described 12 and further detailed in the online supplementary material. The assay was validated over the concentration range of 0.01–5 μg ml–1 for bedaquiline and 0.01–0.5 μg ml–1 for M2 (lower and upper limit of quantification). During sample analysis, the accuracies (% Nom) for bedaquiline were 102.6%, 102.0% and 99.3% at the high (4 μg ml–1), medium (2 μg ml–1) and low (0.024 μg ml–1) QC levels respectively with precision (% CV) <10% across all three levels. The accuracies for M2 were 99.1%, 99.3% and 96.7% at the high (0.40 μg ml–1), medium (0.20 μg ml–1) and low (0.024 μg ml–1) QC levels, respectively, with precision (% CV) <7%.
Pharmacokinetic analysis
Nonlinear mixed‐effects models, able to characterize both typical parameter values and distributions of random interindividual and interoccasion variability (IIV and IOV), as well as unexplained residual variability, were employed for the analysis. The previously developed population PK model utilized in the clinical trial simulations was used as a starting point 5. This model included three distribution compartments for bedaquiline and two for M2. Each bedaquiline dose was defined as a separate occasion. IIV and IOV were implemented with log‐normal distributions. A correlation between the residual errors for observations at the same time point was included. Concentration measurements below the limit of quantification were excluded from the analysis. Model selection was based on maximum likelihood ratio test (95% significance level) and goodness‐of‐fit plots, including visual predictive checks based on simulations from the final model (n = 1000). Secondary PK metrics (area under the concentration curve up to 48 and 336 h after dose, i.e. AUC0–48h and AUC0–336h, and time and magnitude of peak concentrations, i.e. Tmax and Cmax) were derived from the final model.
Data management, post processing of results and plotting were performed in R (R Foundation for Statistical Computing, Vienna, Austria) 13. The modelling and simulations were performed in NONMEM 7.3 (Icon Development Solutions, Ellicott City, MD, USA) 14, aided by PsN (Department of Pharmaceutical Biosciences, Uppsala University, Uppsala, Sweden) and Pirana (Pirana Software & Consulting, San Francisco, CA, USA) 15. Parameter uncertainty was obtained from the covariance step in NONMEM. Additionally, log‐likelihood profiling (as implemented in PsN) was used to obtain nonparametric confidence intervals for the parameters describing potential effects of suspending tablets.
Ethics
This study was approved by the Pharma‐Ethics Independent Research Ethics Committee of South Africa (#141110730). All participants provided written informed consent. The trial was registered at http://clinicaltrials.gov with identifier NCT03032367.
Results
Study participants and data
All 24 participants completed the study. A summary of the demographic characteristics can be found in Table 1. Study investigators noted that the tablets did suspend in this volume of water over 2 min, although some amount of stirring and breaking up the tablets with the spoon handle were required. Some visual particles usually remained, which were successfully suspended by the described rinses. There were 552 concentration observations each for bedaquiline and M2 available. All predose observations at the first sampling occasion as well as five postdose bedaquiline and 81 postdose M2 observations were below the limit of quantification. The average concentration of bedaquiline and M2 per nominal time point is shown in Figure S1.
Table 1.
Summary of the demographic characteristics of the study participants
| Characteristics | All participants | Whole tablets first | Suspension first |
|---|---|---|---|
| Median (range)/n (%) | Median (range)/n (%) | Median (range)/n (%) | |
| n | 24 | 12 | 12 |
| Weight (kg) | 63.4 (45.6, 88.5) | 66.15 (45.6, 84.7) | 61.85 (53.3, 88.5) |
| Age (years) | 23.5 (19, 37) | 22 (19, 26) | 24.5 (20, 37) |
| Female sex | 15 (62.5%) | 8 (66.7%) | 7 (58.3%) |
| Race | |||
| Black | 21 (87.5%) | 11 (91.7%) | 10 (83.3%) |
| Mixed race | 3 (12.5%) | 1 (8.3%) | 2 (16.7%) |
Pharmacokinetic analysis
The starting model generally described the data well, and only a few modifications were required. A 6‐h maximum limit for the mean absorption time (i.e. the typical time to when 90% of the dose is absorbed) was added to the flexible transit compartment model describing absorption, consistent with another recently published model of bedaquiline PK 16. The absorption model was simplified without a statistically significant loss of fit by making the rate of absorption from the last transit compartment the same as the rate of transfer between the transit compartments.
The difference in bioavailability between suspended and whole tablets was not statistically significant (P = 0.92). The nonparametric 95% confidence interval (CI) of the relative bioavailability of suspended bedaquiline tablets was 94–108% relative to that of whole bedaquiline tablets; hence the predefined bioequivalence criteria (80–125%) were fulfilled. IIV in bioavailability was not significantly different between whole and suspended tablets. The mean absorption time was slightly longer for suspended tablets, +23% (95% CI 2.1–48%, P = 0.03). In the final model, only the formulation effect on mean absorption time was included. Parameter estimates with uncertainty are reported in Table 2, and the NONMEM control stream detailing the parametrization is included in the online supplementary material. The fit of the model to the observed data per formulation and sequence are shown in Figure 1 and 2 for bedaquiline and M2, respectively. The typical PK profile after a single 400 mg dose bedaquiline administered either as whole or suspended tablets are demonstrated in Figure 3. Secondary PK metrics (AUC0–48h, AUC0–336h, Cmax and Tmax) are reported in Table 3 and Table S1 to facilitate comparison with other clinical studies.
Table 2.
Parameter estimates for the final model including uncertainty
| Structural parameters | Parameter value | Relative standard error |
|---|---|---|
| MAT (h) | 2.63 | 5.0% |
| NN | 4.00 | 10.9% |
| CL BDQ /F (l h –1 ) | 5.67 | 10.1% |
| V BDQ /F (l) | 130 | 6.1% |
| Q BDQ,1 /F (l h –1 ) | 6.33 | 9.6% |
| VP BDQ,1 /F (l) | 3020 | 28.0% |
| Q BDQ,2 /F (l h –1 ) | 4.83 | 15.5% |
| VP BDQ,2 /F (l) | 64.5 | 13.1% |
| CL M2 /F/fm (l h –1 ) | 17.2 | 11.8% |
| V M2 /F/fm (l) | 1380 | 9.2% |
| Q M2 /F/fm (l h –1 ) | 126 | 12.9% |
| VP M2 /F/fm (l) | 3450 | 11.7% |
| Weighting residual error samples 0‐6 h | 1.67 | 5.6% |
| Effect of suspending on MAT (%) | 23 | 43.0% |
| Variability between individuals and occasions | ||
|---|---|---|
| IOV F | 9.1% | 23.8% |
| IIV F | 22.6% | 12.8% |
| IOV MAT | 66.3% | 9.4% |
| IIV CL BDQ | 17.1% | 23.2% |
| Correlation IIV CL BDQ ‐CLM2 | 8.5% | 5.4% |
| IIV CL M2 | 20.5% | 23.4% |
| IIV V BDQ | 28.3% | 15.5% |
| IIV Q BDQ,1 | 17.3% | 25.7% |
| IIV V M2 | 26.3% | 25.3% |
| IIV VP M2 | 22.3% | 35.6% |
| Residual variability | ||
|---|---|---|
| Proportional error BDQ | 23.1% | 4.0% |
| Correlation error BDQ‐M2 | 53.1% | 11.7% |
| Proportional error M2 | 11.4% | 3.7% |
BDQ, bedaquiline; M2, metabolite M2; MAT, mean absorption time; NN, number of transit compartments; CL, clearance; V, volume of distribution central compartments; Q, intercompartmental clearance; VP, volume of distribution peripheral compartments; F, bioavailability; IOV, interoccasion variability; IIV, interindividual variability
Figure 1.
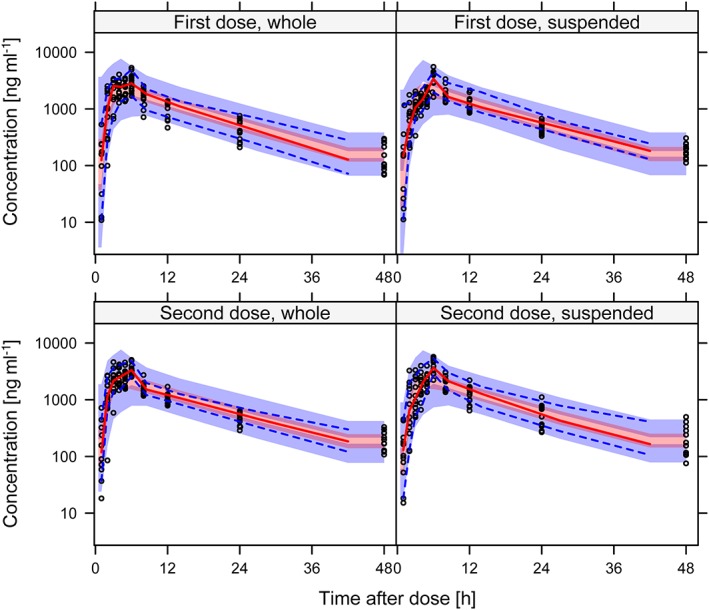
Visual predictive check showing the 5th, 50th and 95th percentiles (lines) of observed bedaquiline concentrations (open circles) over time after dose, per formulation (whole or suspended tablets) and dose. The shaded areas represent the 90% confidence intervals for the same percentiles calculated from model simulated data
Figure 2.
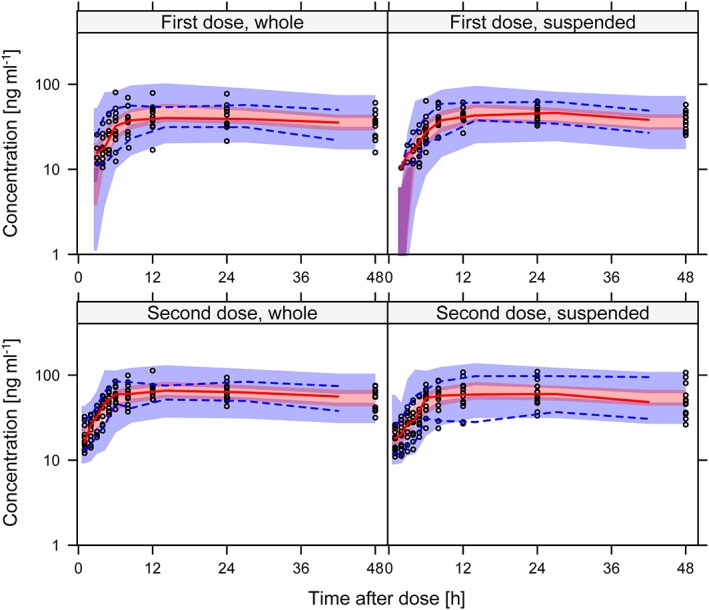
Visual predictive check showing the 5th, 50th and 95th percentiles (lines) of observed M2 concentrations (open circles) over time after dose, per formulation (whole or suspended tablets) and dose. The shaded areas represent the 90% confidence intervals for the same percentiles calculated from model simulated data
Figure 3.
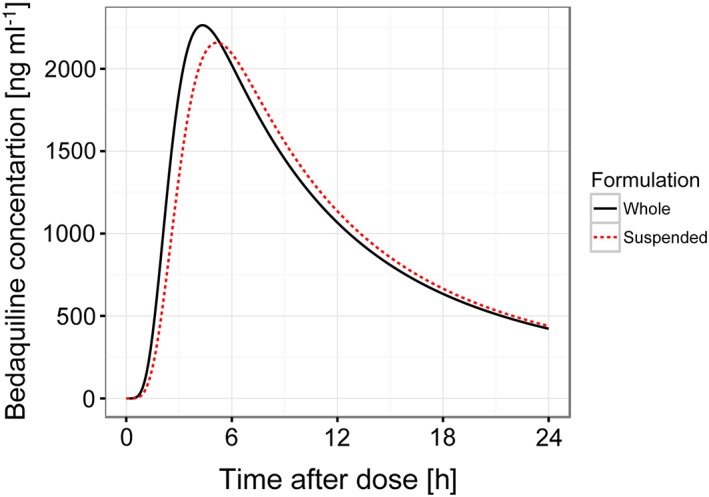
Typical pharmacokinetic profile after a single 400 mg dose bedaquiline administered either as whole (solid line) or suspended (broken line) tablets, based on final model parameters
Table 3.
Summary of secondary PK metrics after two single doses of 400 mg bedaquiline administered 14 days apart. The numbers represent geometric mean and range of individual exposure estimates from the final model
| First dose, whole (n = 12) | First dose, suspended (n = 12) | Second dose, whole (n = 12) | Second dose, suspended (n = 12) | |
|---|---|---|---|---|
| Bedaquiline | ||||
| AUC 0–48h (ng ml –1 *h) | 31 900 (18 600, 51 600) | 32 900 (25 600, 43 800) | 35 900 (29 600, 49 100) | 34 700 (20 700, 54 000) |
| AUC 0–336h (ng ml –1 *h) | 43 500 (24 900, 69 300) | 45 900 (34 300, 60 700) | 56 700 (44 600, 75 400) | 53 400 (31 100, 89 700) |
| C max (ng ml –1 ) | 2400 (1410, 3660) | 2260 (1750, 3280) | 2500 (2030, 3820) | 2460 (1490, 3910) |
| T max (h) | 4.3 (2.8, 5.6) | 4.9 (2.8, 6.9) | 4.1 (2.8,6.7) | 4.9 (3.3, 7.3) |
| M2 metabolite | ||||
| AUC 0–48h (ng ml –1 *h) | 1650 (818, 3110) | 1780 (1270, 2580) | 2800 (1990, 4140) | 2520 (1360, 4380) |
| AUC 0–336h (ng ml –1 *h) | 8450 (4520, 15 400) | 9340 (6480, 13 600) | 14 900 (10 400, 22 000) | 13 400 (7750, 22 300) |
| C max (ng ml –1 ) | 44.3 (22.0, 81.2) | 47.9 (33.4, 72.2) | 69.5 (50.7, 106) | 63.6 (33.9, 109) |
| T max (h) | 14.4 (10.1, 19.6) | 14.8 (11.4, 18.1) | 14.0 (10.9, 17.3) | 14.8 (11.0, 20.0) |
AUC, area under the concentration curve; Cmax, maximal concentration, Tmax, time of maximal concentration
Safety, palatability and acceptability
There were no Grade 3 or 4 or serious treatment emergent adverse events, nor any treatment adverse events leading to withdrawal from the study. All adverse events and all potentially bedaquiline‐related treatment emergent adverse events are shown in Tables S2 and S3 by grade of severity. The most frequent event (n = 7) was mild or moderate headache. No participant had a QTcF >450 ms at any point during the study. No lactate levels >3 mmol l–1 were found. Table 4 shows results of the acceptability and palatability questionnaire by formulation (whole tablets vs. suspension). The large majority of participants (88–100%) were either neutral to or liked most aspects of the bedaquiline suspension palatability, such as taste, smell, texture. Twenty‐three of 24 participants (96%) reported the suspension to be acceptable overall.
Table 4.
Results of palatability and acceptability assessments in healthy adults receiving suspended vs. whole bedaquiline tablets (n = 24)
| Whole formulation | Suspended formulation | |||
|---|---|---|---|---|
| Dislike very much or dislike | Neutral, Like or Like very much | Dislike very much or dislike | Neutral, Like or Like very much | |
| How did you feel about the visual appeal of the formulation? (did the formulation look acceptable to you?) | 1 (4%) | 23 (96%) | 3 (13%) | 21 (88%) |
| How did you feel about the smell of the formulation? | 0 (0%) | 24 (100%) | 1 (4%) | 23 (96%) |
| How did you feel about the taste of the formulation? | 3 (13%) | 21 (88%) | 3 (13%) | 21 (88%) |
| How did you feel about the texture of the formulation? (how did the formulation feel in your mouth?) | 5 (21%) | 19 (79%) | 2 (8%) | 22 (92%) |
| How did you feel about the size/amount of the formulation (volume of liquid or size of tablet)? | 5 (21%) | 19 (79%) | 0 (0%) | 24 (100%) |
| How did you feel about the OVERALL acceptability of the formulation? | 0 (0%) | 24 (100%) | 1 (4%) | 23 (96%) |
| If a child is required to take this formulation, how do you think they would feel about the taste of the formulation? | 5 (21%) | 19 (79%) | 2 (8%) | 22 (92%) |
| If a child is required to take this formulation, how do you think they would feel about the size/amount of the formulation (volume of liquid or size of tablet)? | 6 (25%) | 18 (75%) | 1 (4%) | 23 (96%) |
| If a child is required to take this formulation, how do you think they would feel about the OVERALL acceptability? | 3 (13%) | 21 (88%) | 3 (13%) | 21 (88%) |
Discussion
This study demonstrates that a 400 mg dose of bedaquiline given as 100 mg tablets suspended in a small volume of water had equivalent bioavailability to bedaquiline administered as 100 mg tablets swallowed whole. The suspended bedaquiline tablets were considered by the majority of participants to be palatable and acceptable.
The mean absorption time for suspended bedaquiline was found to typically be 23% longer. This translates to a delay in the time to peak bedaquiline concentrations from 4.3 to 5.2 h, and a decrease in typical maximal concentrations of 5%, but no change in the average concentration. Given that average rather than peak concentrations have been linked to bedaquiline efficacy 17, we do not expect the effect of suspending on mean absorption time to be clinically relevant. The bedaquiline exposures observed in this study (see Table 3) were somewhat lower compared to other studies in healthy volunteers with similar design and the same dose. Dooley et al. reported bedaquiline AUC0–336h of 58 200 (42 200–78 200) ng ml–1*h 18, and Winter et al. reported 67 200 (standard deviation 20 200) ng ml–1*h 19, while the median in this study was 44 000 ng ml–1*h. This might be explained by the larger proportion of black subjects included here (88%) compared to in the studies by Dooley and Winter (22% and 6%, respectively), since black race has been associated with higher bedaquiline clearance 16.
Our findings have important implications for the clinical use of bedaquiline 100 mg tablets in young children, who will be unlikely to have access to paediatric bedaquiline formulations in routine care settings in the near future. Data on the safety and dosing of bedaquiline from paediatric trials across the age range (0–17 years) is expected to be available long before the paediatric formulation used in the studies is registered and widely available, as there are many barriers preventing access to TB medications in children 20, including the development, manufacturer, licensure, procurement and uptake of paediatric drug formulations. Given no other choice due to the lack of child friendly formulations, adult formulations manipulated either by splitting, crushing, dissolving or suspending are frequently used in paediatric TB care, especially for MDR‐TB 10. However, the impact of such manipulation on drug exposures or formulation acceptability is often unknown. Data from our study address these questions for bedaquiline and will facilitate the use of bedaquiline in children with the already widely available adult 100 mg tablets, once paediatric dosing and safety is established, and until the paediatric formulation becomes widely available in the field. It is reassuring that the vast majority of adults found the suspended tablets to be palatable and acceptable, a critical consideration for children's medication and adherence to long‐term treatment. Although children may have different perceptions of palatability and acceptability, the data suggest that poor palatability or acceptability are unlikely to be major barriers to use of suspended bedaquiline tablets in children.
The design of this study was supported by clinical trials simulations to ensure adequate statistical power. The data were analysed with a model‐based approach to handle the extremely long terminal half‐life of bedaquiline and M2 and expected carry‐over between the sampling occasions, avoiding the risk of bias associated with noncompartmental analysis in such cases 21. However, the final model has some limitations. Individual bedaquiline profiles showed a tendency towards having dual peaks. This is not accounted for in the structure of the final model, but simply handled by the larger residual error estimated for the absorption phase (first 6 h after dose). An expanded structural model including enterohepatic circulation linked to meal times was evaluated, but did not improve the model fit to the data. Furthermore, concentration observations below the limit of quantification were excluded in this analysis. For bedaquiline, the proportion of samples below limit of quantification was very low (<1%), hence the exclusion is not expected to impact our results. For M2, the proportion of samples below the limit of quantification was larger (15%) and 95% of occurred within the first 4 h after dose administration. This may have influenced the M2 parameter estimates. However, predictions from the final model at the time points of samples with below limit of quantification results were in 77 of 81 cases below two times the quantification limit, indicating a reasonable description also at low concentration levels.
This study demonstrating bioequivalence of 100 mg bedaquiline tablets suspended in water vs. swallowed whole will support the use of bedaquiline for MDR TB in children. Similar work would be beneficial for other novel TB medications in the future. While these data address an immediate gap in medication formulation availability for children, it should not result in delays or limit the development and availability of an affordable child‐friendly formulation of bedaquiline, preferably a palatable dispersible scored formulation. Equitable access to child‐friendly formulations of life‐saving medications must continue to be a priority for the TB community.
Competing Interests
A.D., B.S., E.M.S., J.B., J.N., L.W., R.K., S.N., A.G.P. and V.R.J. have no competing interests to declare. A.C.H. chairs the IMPAACT P1108 study protocol (NCT02906007).
The authors thank the volunteers and staff that made the study possible and acknowledge Professor Mats O. Karlsson, Uppsala University, for valuable contribution in the process of designing this study. Overall support for the International Maternal Pediatric Adolescent AIDS Clinical Trials Group (IMPAACT) was provided by the National Institute of Allergy and Infectious Diseases (NIAID) of the National Institutes of Health (NIH) under Award Numbers UM1AI068632 (IMPAACT LOC), UM1AI068616 (IMPAACT SDMC) and UM1AI106716 (IMPAACT LC), with cofunding from the Eunice Kennedy Shriver National Institute of Child Health and Human Development (NICHD) and the National Institute of Mental Health (NIMH). The content is solely the responsibility of the authors and does not necessarily represent the official views of the NIH. Exchange and collaboration was facilitated by the Swedish Foundation for International Cooperation in Research and Higher Education, STINT, jointly with the South African National Research Foundation, NRF (grant number STINT: SA2015‐6259, NRF: 101575).
Supporting information
Figure S1 (a) Observed bedaquiline concentrations above the limit of quantification presented as average per nominal time‐point. The table below specifies the number of samples contributing to the average value per nominal time point. (b) Observed M2 concentrations above the limit of quantification presented as average per nominal time‐point. The table below specifies the number of samples contributing to the average value per nominal time point
Table S1 Summary of secondary pharmacokinetic metrics after two single doses of 400 mg bedaquiline administered 14 days apart. The statistics are calculated from individual exposure estimates from the final model
Table S2 Incidence of treatment emergent adverse events by system organ class, preferred term and maximum severity safety population
Table S2 Incidence of potentially investigational medicinal product related treatment emergent adverse events by system organ class, preferred term and maximum severity
Svensson, E. M. , du Bois, J. , Kitshoff, R. , de Jager, V. R. , Wiesner, L. , Norman, J. , Nachman, S. , Smith, B. , Diacon, A. H. , Hesseling, A. C. , and Garcia‐Prats, A. J. (2018) Relative bioavailability of bedaquiline tablets suspended in water: Implications for dosing in children. Br J Clin Pharmacol, 84: 2384–2392. 10.1111/bcp.13696.
References
- 1. Borisov SE, Dheda K, Enwerem M, Leyet RR, D'Ambrosio L, Centis R, et al Bedaquiline (BQ)‐containing regimen at the programmatic level for MDR‐TB: preliminary results. Eur Respir J 2017; 50 (Suppl. 61): OA4852. [Google Scholar]
- 2. Andries K, Verhasselt P, Guillemont J, Göhlmann HWH, Neefs JM, Winkler H, et al A Diarylquinoline drug active on the ATP synthase of mycobacterium tuberculosis. Science 2005; 307: 223–227. [DOI] [PubMed] [Google Scholar]
- 3. van Heeswijk RPG, Dannemann B, Hoetelmans RMW. Bedaquiline: a review of human pharmacokinetics and drug–drug interactions. J Antimicrob Chemother 2014; 69: 2310–2318. [DOI] [PubMed] [Google Scholar]
- 4. FDA . Center for drug evaluation and research. Application number 204384Orig1s000, Clinical Pharmacology and Biopharmaceutics review (s). Available at https://www.accessdata.fda.gov/drugsatfda_docs/nda/2012/204384Orig1s000ClinPharmR.pdf (last accessed 24 July 2018).
- 5. Svensson EM, Aweeka F, Park JG, Marzan F, Dooley KE, Karlsson MO. Model‐based estimates of the effects of efavirenz on bedaquiline pharmacokinetics and suggested dose adjustments for patients coinfected with HIV and tuberculosis. Antimicrob Agents Chemother 2013; 57: 2780–2787. [DOI] [PMC free article] [PubMed] [Google Scholar]
- 6. Svensson EM, Dooley KE, Karlsson MO. Impact of lopinavir–ritonavir or nevirapine on bedaquiline exposures and potential implications for patients with tuberculosis‐HIV coinfection. Antimicrob Agents Chemother 2014; 58: 6406–6412. [DOI] [PMC free article] [PubMed] [Google Scholar]
- 7. Svensson EM, Murray S, Karlsson MO, Dooley KE. Rifampicin and rifapentine significantly reduce concentrations of bedaquiline, a new anti‐TB drug. J Antimicrob Chemother 2015; 70: 1106–1114. [DOI] [PMC free article] [PubMed] [Google Scholar]
- 8. Medecins sans frontiers . TB briefing paper – an overview of MSF's programmatic use and clinical research with new TB treatment regimens, October 2016. Available at http://www.msf.org/sites/msf.org/files/tbbriefingpaper.pdf (last accessed 24 July 2018).
- 9. Cariem R, Cox V, de Azevedo V, Hughes J, Mohr E, Durán LT, et al The experience of bedaquiline implementation at a decentralised clinic in South Africa. Public Health Action 2016; 6: 190–192. [DOI] [PMC free article] [PubMed] [Google Scholar]
- 10. Richey RH, Shah UU, Peak M, Craig JV, Ford JL, Barker CE, et al Manipulation of drugs to achieve the required dose is intrinsic to paediatric practice but is not supported by guidelines or evidence. BMC Pediatr 2013; 13: 81. [DOI] [PMC free article] [PubMed] [Google Scholar]
- 11. FDA . Guidance for industry: bioequivalence studies with pharmacokinetic endpoints for drugs submitted under an ANDA, December 2013. Available at https://www.fda.gov/downloads/drugs/guidancecomplianceregulatoryinformation/guidances/ucm377465.pdf (last accessed 24 July 2018).
- 12. Pandie M, Wiesner L, McIlleron H, Hughes J, Siwendu S, Conradie F, et al Drug–drug interactions between bedaquiline and the antiretrovirals lopinavir/ritonavir and nevirapine in HIV‐infected patients with drug‐resistant TB. J Antimicrob Chemother 2016; 71: 1037–1040. [DOI] [PubMed] [Google Scholar]
- 13. R Core Team . R: A Language and Environment for Statistical Computing. Vienna, Austria: 2014. Available at: http://www.r-project.org (last accessed 24 July 2018).
- 14. Beal S, Sheiner LB, Boeckmann A, Bauer RJ. NONMEM User's guides. (1989‐2013), Icon Development Solutions. Ellicott City, MD, USA; 2013.
- 15. Keizer RJ, Karlsson MO, Hooker A. Modeling and simulation workbench for NONMEM: tutorial on Pirana, PsN, and Xpose. CPT Pharmacomet Syst Pharmacol 2013; 2: e50. [DOI] [PMC free article] [PubMed] [Google Scholar]
- 16. Svensson EM, Dosne AG, Karlsson MO. Population pharmacokinetics of bedaquiline and metabolite M2 in drug‐resistant tuberculosis patients – the effect of time‐varying weight and albumin. CPT Pharmacomet Syst Pharmacol 2016; 5: 682–691. [DOI] [PMC free article] [PubMed] [Google Scholar]
- 17. Svensson EM, Karlsson MO. Modelling of mycobacterial load reveals bedaquiline's exposure–response relationship in patients with drug‐resistant TB. J Antimicrob Chemother 2017; 72: 3398–3405. [DOI] [PMC free article] [PubMed] [Google Scholar]
- 18. Dooley KE, Park JG, Swindells S, Allen R, Haas DW, Cramer Y, et al Safety, tolerability, and pharmacokinetic interactions of the antituberculous agent TMC207 (bedaquiline) with efavirenz in healthy volunteers: AIDS Clinical Trials Group study A5267. J Acquir Immune Defic Syndr 1999 2012; 59: 455–462. [DOI] [PMC free article] [PubMed] [Google Scholar]
- 19. Winter H, Egizi E, Murray S, Erondu N, Ginsberg A, Rouse DJ, et al Evaluation of the pharmacokinetic interaction between repeated doses of rifapentine or rifampicin and a single dose of bedaquiline in healthy adult subjects. Antimicrob Agents Chemother 2014; 59: 1219–1224. [DOI] [PMC free article] [PubMed] [Google Scholar]
- 20. Schaaf HS, Garcia‐Prats AJ, McKenna L, Seddon JA. Challenges of using new and repurposed drugs for the treatment of multidrug‐resistant tuberculosis in children. Expert Rev Clin Pharmacol 2017; 11: 1–12. [DOI] [PubMed] [Google Scholar]
- 21. Svensson EM, Acharya C, Clauson B, Dooley KE, Karlsson MO. Pharmacokinetic interactions for drugs with a long half‐life—evidence for the need of model‐based analysis. AAPS J 2015; 18: 171–179. [DOI] [PMC free article] [PubMed] [Google Scholar]
Associated Data
This section collects any data citations, data availability statements, or supplementary materials included in this article.
Supplementary Materials
Figure S1 (a) Observed bedaquiline concentrations above the limit of quantification presented as average per nominal time‐point. The table below specifies the number of samples contributing to the average value per nominal time point. (b) Observed M2 concentrations above the limit of quantification presented as average per nominal time‐point. The table below specifies the number of samples contributing to the average value per nominal time point
Table S1 Summary of secondary pharmacokinetic metrics after two single doses of 400 mg bedaquiline administered 14 days apart. The statistics are calculated from individual exposure estimates from the final model
Table S2 Incidence of treatment emergent adverse events by system organ class, preferred term and maximum severity safety population
Table S2 Incidence of potentially investigational medicinal product related treatment emergent adverse events by system organ class, preferred term and maximum severity