Abstract
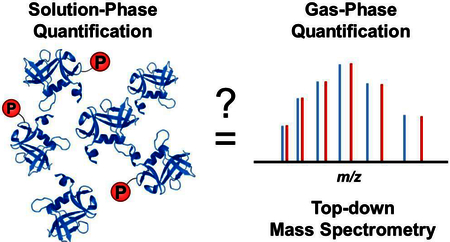
Protein phosphorylation is a ubiquitous and critical post-translational modification (PTM) involved in numerous cellular processes. Mass spectrometry (MS)-based proteomics has emerged as the preferred technology for protein identification, characterization, and quantification. Whereas ionization/detection efficiency of peptides in electrospray (ESI)-MS are markedly influenced by the presence of phosphorylation, the physicochemical properties of intact proteins are assumed not to vary significantly due to the relatively smaller modification on large intact proteins. Thus the ionization/detection efficiency of intact phosphoprotein is hypothesized not to alter appreciably for subsequent MS quantification. However, this hypothesis has never been rigorously tested. Herein, we systematically investigated the impact of phosphorylation on ESI-MS quantification of mono- and multiply-phosphorylated proteins. We verified that a single phosphorylation did not appreciably affect the ESI-MS quantification of phosphoproteins as demonstrated in the enigma homolog isoform 2 (28 kDa) with mono-phosphorylation. Moreover, different ionization and desolvation parameters did not impact phosphoprotein quantification. In contrast to mono-phosphorylation, multi-phosphorylation noticeably affected ESI-MS quantification of phosphoproteins likely due to differential ionization/detection efficiency between unphosphorylated and phosphorylated proteoforms as shown in the pentakis-phosphorylated β-casein (24 kDa).
TOC

Protein phosphorylation is an important post-translational modification (PTM) that is involved in many critical cellular processes, including cell cycle control, cell growth, apoptosis, and signaling transduction pathways.1,2 Not surprisingly, altered phosphorylation levels have been associated with the development of diseases such as cardiovascular disease, cancer, and neurodegenerative disease.3–6 Moreover, recent evidence indicates that protein phosphorylation may also be useful as potential disease biomarkers.7 Therefore, accurate quantification of protein phosphorylation in different biological states not only can help elucidate intracellular signaling pathways that regulate various cellular processes, but may also be useful in understanding disease mechanism and diagnosis.8,9
Mass spectrometry (MS)-based proteomics has emerged as the preferred method for phosphoprotein identification, characterization, and quantification.10–12 The bottom-up MS-based phosphoproteomics approach, which commonly utilizes proteases to digest phosphoproteins into smaller peptides, is a high throughput method for quantification of phosphoproteins.13,14 However, ionization/detection efficiency of peptides in electrospray (ESI)-MS are markedly influenced by the presence of phosphorylation.15 Recently, top-down MS-based proteomics has emerged as the foremost method for the identification and quantification of proteoforms, a term adopted to represent the myriad protein products of a single gene generated via sequence variations (as a consequence of mutations/polymorphisms and/or alternative splicing), as well as post-translational modifications (PTMs).16 In top-down MS, intact proteins are analyzed, providing a “bird’s eye” view of all observed proteoforms in a given sample.17,18 Moreover, as the physicochemical properties of intact proteins are believed to be less impacted than peptides by the addition of smaller PTMs (e.g., phosphorylation), it is hypothesized that the effect of the small modifications on the ionization/detection efficiency of intact proteins will be negligible. Thus, top-down MS has been routinely employed for the quantification of modified and un-modified protein species in biological samples.3,19,20
In support of the long-held belief that the ionization/detection efficiency of intact proteins is not significantly impacted by PTMs, Kelleher and co-workers have demonstrated that the difference in ionization/detection efficiency between un-modified and acetylated intact recombinant H4 protein was minimal as observed by the small deviation (<5%) between protein ion relative ratios and solution ratio.21 Therefore, accurate relative quantification of un-modified and acetylated proteoforms can be achieved by top-down MS analysis. On the other hand, some evidence suggests that phosphorylation can have a dramatic impact on the physicochemical properties of proteins such as hydrophobicity, viscosity, and side chain flexibility.22,23 However, it remains unclear whether the ionization/detection efficiency of proteins will be significantly altered by phosphorylation.
Herein we systematically investigated the impact of phosphorylation on the ionization/detection efficiency of intact proteins using a mono-phosphorylated protein, enigma homolog isoform 2 (ENH2), and a multiply-phosphorylated protein, β-casein, as model phosphoproteins. Phosphorylation or dephosphorylation reaction was achieved by in vitro kinase or phosphatase reaction. The details on purification of ENH2 and characterization of phosphorylation site(s) for both ENH2 and β-casein are described in the Supporting Information (Figure S1–2). With these model systems, we varied the solution-phase ratio of unphosphorylated and phosphorylated proteins quantified by SDS-PAGE analysis, which allowed us to evaluate the impact of phosphorylation on top-down phosphoprotein quantification analysis. We also investigated the ESI-MS response in two different types of mass spectrometers, TOF and FT-ICR, and assessed the correlation between solution-phase ratios of proteins derived from SDS-gel analysis, and their respective gas-phase ratios as measured by these two mass spectrometers. Details regarding solution-phase and gas-phase quantification are described in the Supporting Information (Figure S3).
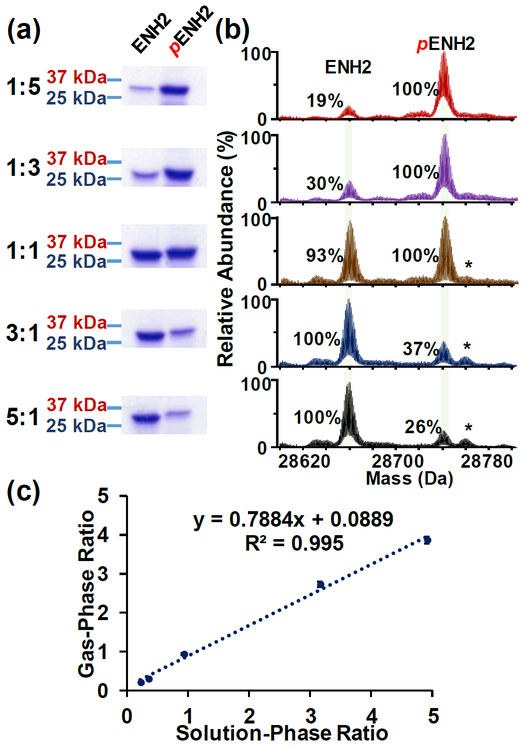
To determine whether the presence of a single phosphate moiety impacts the ionization/detection efficiency of an intact protein, stock solutions of completely unphosphorylated or phosphorylated ENH2 were mixed 1:5, 1:3, 1:1, 3:1, and 5:1 (ENH2:pENH2), and EHN2 and pENH2 components of these mixtures were analyzed on separate lanes by SDS-PAGE to confirm the solution-phase ratios (Figure 1a). Subsequently, ESI-MS analysis of the aforementioned mixtures using a maXis II Q-TOF mass spectrometer was carried out. Our results showed that gas-phase ratios of ENH2:pENH2 as determined from the deconvoluted mass spectra generally correspond to their respective solution-phase ratios derived from the SDS-gel data (i.e. < 6% difference between gas phase and solution phase. Further details concerning calculation and data analysis were provided in the Supporting Information). Additionally, linear regression analysis of the solution-phase and gas-phase ratios yielded an R2 value of 0.995, indicating good correlation between the solution-phase and gas-phase ratios when quantification of the gas-phase ENH2:pENH2 ratio was determined based on the ratios in the deconvoluted mass spectra (Figure 1b–c). Moreover, the effect of different ionization parameters such as variations in the spray voltage, in-source collision-induced dissociation (isCID) voltage and solvent composition also did not affect the observed gas-phase ratio of ENH2:pENH2 mixtures (Figure S4 and S5). Detailed discussion regarding variations at the ionization interface is described in Supporting Information.
Figure 1. Protein quantification using SDS-PAGE gel analysis and maXis II Q-TOF MS analysis for ENH2.
(a) SDS-PAGE analysis of ENH2:pENH2 in five different ratios, 1:5, 1:3, 1:1, 3:1 to 5:1 (top to bottom) and (b) the corresponding Q-TOF MS deconvoluted spectra. Relative abundance is normalized to the most abundant species in each mass spectrum. (c) Correlation analysis between gas-phase ratios (derived from the Q-TOF MS data) and solution-phase ratios (derived from SDS-gel data) of ENH2:pENH2 suggests a linear correspondence between these two methods. *ENH2 with non-covalent phosphate adduct (+98 Da).
Nevertheless, as the relative intensities of unphosphorylated and phosphorylated ENH2 proteoforms in the deconvoluted mass spectra represent an average of the relative abundance ratios for these species across all charge states in the 500 – 3000 m/z range, there was the potential that the gas-phase ratios for ENH2:pENH2 at individual charge states may not correlate well with the solution-phase ratios. To investigate this possibility, we also evaluated the ENH2:pENH2 gas-phase ratio for three individual charge states (41+, 40+, and 39+) from the raw mass spectra (Figure S6). The gas-phase ratio across the three selected charge states differed from the solution-phase ratio by less than 3% (Figure S6), which confirms that the good degree of correspondence between the solution-phase and gas-phase ratios for ENH2:pENH2 was not an artifact of deconvolution. Moreover, similar results were obtained when the same mixtures were analyzed using a 12T solariX FT-ICR mass spectrometer at the most abundant charge states, 41+ (Figure S7), 40+, and 39+ (Figure S8), indicating that the good correlation observed between the solution-phase and gas-phase ratios for ENH2 and pENH2 was not dependent on the mass analyzer employed. Furthermore, we have analyzed all charge states (44+ to 25+) and the results are summarized in Table S1. The data suggested that the gas-phase ratio derived based on the most abundant charge states are within 5% difference from the solution-phase ratio, which is also similar to the gas-phase ratio derived from the deconvoluted spectrum that takes into consideration of all charge states. In contrast, the gas-phase ratio derived from the highest or lowest charge states deviate significantly from the solution-phase ratio. Hence, we have used the most abundant charge states and/or the deconvoluted spectra considering all charge states to generate the gas-phase ratio (detailed discussion in the Supporting Information). Collectively, these data strongly support the long-held belief in the field that the presence of a single phosphate group has a negligible impact on the ionization/detection efficiency of an intact protein.
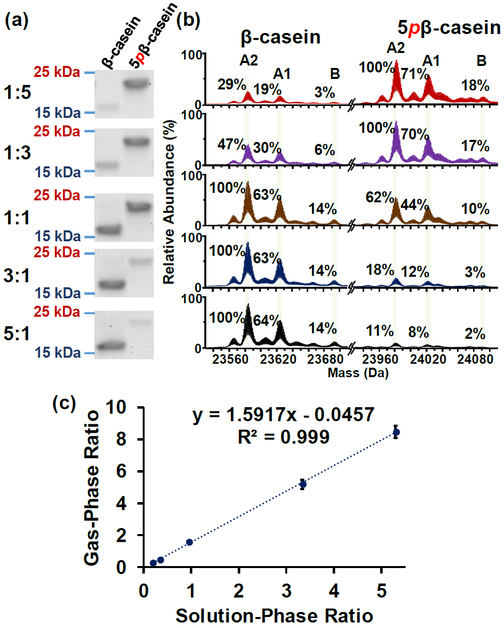
We next sought to determine the impact of multi-phosphorylation on MS quantification of phosphoproteins. Similar to the analysis for ENH2, stock solutions of completely unphosphorylated or phosphorylated β-casein were mixed 1:5, 1:3, 1:1, 3:1, and 5:1 (β-casein:5pβ-casein), and the solution-phase ratios in the mixtures were confirmed by SDS-PAGE (Figure 2a). ESI-MS analysis of the above mentioned mixtures were analyzed by a maXis II Q-TOF mass spectrometer. Relative quantification of β-casein was performed using the three isoforms (A2, A1, and B), and justification was detailed in the Supporting Information (Figure S9). A good linear correlation between the solution-phase ratios and the gas-phase ratios was deduced from the linear regression analysis with an R2 value of 0.999 based on the relative quantification using the deconvoluted mass spectra (Figure 2b–c). However, despite the good linearity between these two ratios, the gas-phase ratios for these mixtures differed from the solution-phase ratios by more than 10%. This result suggests a likelihood that the addition of five phosphate groups gives rise to differential ionization/detection efficiency between unphosphorylated and phosphorylated β-casein. Additionally, the mixtures were analyzed using a 12T solariX FT-ICR mass spectrometer at high abundance charge states, 24+, 23+, and 22+ (Figure S10). The linear regression using a linear equation afforded an R2 value of 0.961, whereas the gas-phase ratios for these mixtures again had more than 10% difference compared to their respective solution-phase ratios. Altogether, these results indicate that the presence of multiple phosphate groups on the intact protein may have an impact on the ionization/detection efficiency of intact proteins.
Figure 2. Protein quantification using SDS-PAGE gel analysis and maXis II Q-TOF MS analysis for β-casein.
(a) SDS-PAGE analysis of five different β-casein:5pβ-casein ratios from 1:5, 1:3, 1:1, 3:1 to 5:1 (top to bottom); (b) corresponding Q-TOF MS spectra (deconvoluted). In each deconvoluted spectrum, the relative abundance is normalized to the highest abundance species; (c) Correlation analysis between gas-phase ratios (derived from Q-TOF MS data) and solution-phase ratios (derived from SDS-gel data) of β-casein:5pβ-casein suggests a linear correspondence between these two ratios.
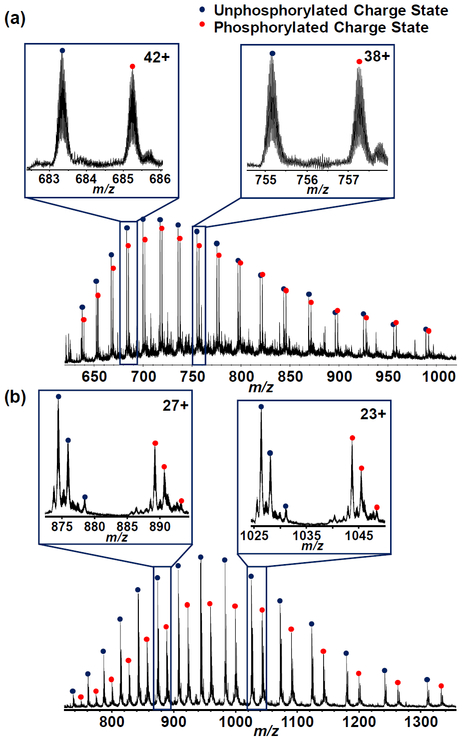
The influence of multi-phosphorylations on gas-phase ratios in MS becomes apparent when we examined the overall charge state distribution profile of the mono-phosphorylated ENH2 and the multiply-phosphorylated β-casein mixtures in 1:1 solution-phase ratio with their corresponding unphosphorylated counterparts (Figure 3a–b). While the mono-phosphorylated ENH2 ions have similar intensities to their unphosphorylated counterparts, the multiply-phosphorylated β-casein showed much lower ion intensities. To further investigate this discrepancy caused by multi-phosphorylation, a mixture of the unphosphorylated and the multiply-phosphorylated β-casein that led to 1:1 intensity ratio from the deconvoluted spectra was prepared (Figure S11). For these three mixtures (1:1 solution-phase ratio of ENH2:pENH2; 1:1 solution-phase ratio of β-casein:5pβ-casein; and 1:1 gas-phase ratio of β-casein:5pβ-casein based on the deconvoluted spectra), gas-phase ratios of individual charge states from 44+ to 25+ and from 31+ to 16+ were analyzed for ENH2 proteoforms and β-casein proteoforms, respectively. While the CVs of all these charge states for 1:1 solution-phase ratio of both ENH2:pENH2 and β-casein:5pβ-casein have a value of 0.24 and 0.30, respectively, the CV of 1:1 gas-phase ratio of β-casein:5pβ-casein based on deconvoluted spectra has a greater value of 0.41 (Table S1 and S2). This result indicates that the variations of gas-phase ratios of individual charge state significantly varied even though the deconvoluted spectra implied an equal 1:1 gas-phase ratio. The high CV (0.41) in the case of 1:1 gas-phase ratio of β-casein:5pβ-casein based on deconvoluted spectra arises from the fact that the charge state distribution of 5pβ-casein was shifted to higher m/z value (Figure S11), inferring that the ionization/detection efficiency between β-casein and 5pβ-casein may be affected by the negatively charged phosphate groups. Collectively, the difference in ionization/detection efficiency owing to multiple phosphate modifying groups provides a possible explanation for the discrepancy between gas-phase ratios and solution-phase ratios for β-casein analysis.
Figure 3. Comparison between mono-phosphorylation and multi-phosphorylation on protein quantification.
Charge state distributions obtained from ESI/Q-TOF MS of 1:1 solution-phase ratio mixture of (a) ENH2:pENH2 and (b) β-casein:5pβ-casein were shown. Compared to mono-phosphorylation, multi-phosphorylation affects the phosphoprotein quantification. Insets, representative higher and lower charge state of ENH2:pENH2 and β-casein:5pβ-casein, respectively.
Relative quantification of phosphorylation levels of proteins provides important information which can be used to correlate with cellular processes and disease pathophysiology. Recent studies have correlated phosphorylation levels of proteins with alteration in cardiac and muscle functions.4,7 Top-down MS is especially attractive for relative quantification of protein PTMs because it is believed that these modifications will have negligible impact on the ionization/detection efficiency of intact proteins.17,21 However, such assumption has not been vigorously validated. Previously, Steen et al. reported that the ionization/detection efficiency of phosphopeptides and their unphosphorylated cognates vary drastically.15 They have demonstrated that more phosphopeptides show better ionization/detection efficiencies than their unphosphorylated cognates.15 In this study, we have shown that mono-phosphorylation has minimal impact on the ionization/detection efficiency of the intact proteins as demonstrated by ESI-MS analysis of recombinant ENH2 with mono-phosphorylation using both a TOF and an FT-ICR mass spectrometers (Figure 1, Figure S4–8, and Table S1). Therefore, relative quantification using top-down proteomics analysis can be an accurate and powerful method for the relative quantification of mono-phosphorylated proteins.
In addition to mono-phosphorylation, multi-phosphorylation is also observed in biological processes.24,25 Previous study from Medina et al. suggested that multiple phosphate modifying groups changed the physicochemical properties of proteins such as electrophoretic mobility and side chain flexibility of caseins.23 Therefore, we prepared and characterized a multiply-phosphorylated protein model using β-casein, and observed discrepancy between gas-phase ratios and solution-phase ratios of β-casein:5pβ-casein (Figure 2). Conceivably, our result showed that multi-phosphorylation significantly altered the electrophoretic mobility between β-casein and 5pβ-casein (Figure 2a), in agreement with the previous finding from Medina et al.23 Further investigation into the shift in charge state distribution between β-casein and 5pβ-casein suggests a change in the ionization/detection efficiency resulted from possible alteration in physicochemical properties likely due to the multiple negative charges imparted by five phosphate modifying groups, and thus impacts relative quantification (Figure 3).
Regarding other PTMs beyond phosphorylation, previously, the Kelleher group attained quantitative information about the isomeric composition of intact histone H4 protein by monitoring the mono-, di-, tri-, and tetra-acetylation.21 Multiple histone acetylation modifications do not appear to affect the ionization/detection efficiency of the histone H4 protein, in contrast to our results of multi-phosphorylation quantification.
To recapitulate, we conducted a systematic interrogation on the top-down ESI-MS-based relative quantification of phosphoproteins using a mono-phosphorylated protein model (ENH2) and a multiply-phosphorylated protein model (β-casein). Our results showed that the mono-phosphorylation does not appreciably affect ESI-MS quantification of phosphoproteins. In contrast to mono-phosphorylation, pentakis-phosphorylation noticeably influenced ESI-MS quantification of phosphoproteins, possibly due to the differential ionization/detection efficiency resulted from slightly different physicochemical properties between unphosphorylated and pentakis-phosphorylated proteoforms.
Supplementary Material
Acknowledgement
This work was supported by the NIH R01 GM117058 (to S.J. and Y.G.), and NIH F31 HL128086 (to Z.R.G.). YG would also like to acknowledge support by NIH R01 HL109810, HL096971 and S10 OD018475.
Footnotes
Conflict of Interest Disclosure
The authors declare no compete for financial interest.
Reference:
- (1).Hunter T Cell 1995, 80, 225–236. [DOI] [PubMed] [Google Scholar]
- (2).Olsen JV; Blagoev B; Gnad F; Macek B; Kumar C; Mortensen P; Mann M Cell 2006, 127, 635–648. [DOI] [PubMed] [Google Scholar]
- (3).Peng Y; Gregorich ZR; Valeja SG; Zhang H; Cai W; Chen Y-C; Guner H; Chen AJ; Schwahn DJ; Hacker TA; Liu X; Ge Y Mol. Cell. Proteomics 2014, 13, 2752–2764. [DOI] [PMC free article] [PubMed] [Google Scholar]
- (4).Gregorich ZR; Peng Y; Cai W; Jin Y; Wei L; Chen AJ; McKiernan SH; Aiken JM; Moss RL; Diffee GM; Ge YJ Proteome Res. 2016, 15, 2706–2716. [DOI] [PMC free article] [PubMed] [Google Scholar]
- (5).Li Y-Y; Popivanova BK; Nagai Y; Ishikura H; Fujii C; Mukaida N Cancer Res. 2006, 66, 6741–6747. [DOI] [PubMed] [Google Scholar]
- (6).Hanger DP; Anderton BH; Noble W Trends Mol. Med 2009, 15, 112–119. [DOI] [PubMed] [Google Scholar]
- (7).Zhang J; Guy MJ; Norman HS; Chen Y-C; Xu Q; Dong X; Guner H; Wang S; Kohmoto T; Young KH; Moss RL; Ge YJ Proteome Res. 2011, 10, 4054–4065. [DOI] [PMC free article] [PubMed] [Google Scholar]
- (8).Kosako H; Nagano K Expert Rev. Proteomics 2011, 8, 81–94. [DOI] [PubMed] [Google Scholar]
- (9).Chan C. Y. X.a.; Gritsenko MA; Smith RD; Qian W-J Expert Rev. Proteomics 2016, 13, 421–433. [DOI] [PMC free article] [PubMed] [Google Scholar]
- (10).Taus T; Köcher T; Pichler P; Paschke C; Schmidt A; Henrich C; Mechtler KJ Proteome Res. 2011, 10, 5354–5362. [DOI] [PubMed] [Google Scholar]
- (11).Ong S-E; Mann M Nat. Chem. Biol 2005, 1, 252–262. [DOI] [PubMed] [Google Scholar]
- (12).Steen H; Jebanathirajah JA; Springer M; Kirschner MW Proc. Natl. Acad. Sci. U S A 2005, 102, 3948–3953. [DOI] [PMC free article] [PubMed] [Google Scholar]
- (13).Wu R; Haas W; Dephoure N; Huttlin EL; Zhai B; Sowa ME; Gygi SP Nat. Method 2011, 8, 677. [DOI] [PMC free article] [PubMed] [Google Scholar]
- (14).Riley NM; Coon JJ Anal. Chem. 2016, 88, 74–94. [DOI] [PMC free article] [PubMed] [Google Scholar]
- (15).Steen H; Jebanathirajah JA; Rush J; Morrice N; Kirschner MW Mol. Cel. Proteomics 2006, 5, 172–181. [DOI] [PubMed] [Google Scholar]
- (16).Smith LM; Kelleher NL; The Consortium for Top Down, P. Nat. Method 2013, 10, 186–187. [Google Scholar]
- (17).Cai W; Tucholski TM; Gregorich ZR; Ge Y Expert Rev. Proteomics 2016, 13, 717–730. [DOI] [PMC free article] [PubMed] [Google Scholar]
- (18).Toby TK; Fornelli L; Kelleher NL Annu. Rev. Anal. Chem. (Palo Alto Calif) 2016, 9, 499–519. [DOI] [PMC free article] [PubMed] [Google Scholar]
- (19).Jiang L; Smith JN; Anderson SL; Ma P; Mizzen CA; Kelleher NL J. Biol. Chem 2007, 282, 27923–27934. [DOI] [PubMed] [Google Scholar]
- (20).Chamot-Rooke J; Mikaty G; Malosse C; Soyer M; Dumont A; Gault J; Imhaus A-F; Martin P; Trellet M; Clary G; Chafey P; Camoin L; Nilges M; Nassif X; Duménil G Science 2011, 331, 778–782. [DOI] [PubMed] [Google Scholar]
- (21).Pesavento JJ; Mizzen CA; Kelleher NL Anal. Chem 2006, 78, 4271–4280. [DOI] [PubMed] [Google Scholar]
- (22).Polyansky AA; Zagrovic BJ Phys. Chem. Lett 2012, 3, 973–976. [DOI] [PMC free article] [PubMed] [Google Scholar]
- (23).Medina AL; Colas B; Le Meste M; Renaudet I; Lorient DJ Food Sci 1992, 57, 617–621. [Google Scholar]
- (24).Ali AAE; Jukes RM; Pearl LH; Oliver AW Nucleic Acids Res. 2009, 37, 1701–1712. [DOI] [PMC free article] [PubMed] [Google Scholar]
- (25).Wang Y; Guan S; Acharya P; Liu Y; Thirumaran RK; Brandman R; Schuetz EG; Burlingame AL; Correia MA Mol. Cell. Proteomics 2012, 11, M111 010132. [DOI] [PMC free article] [PubMed] [Google Scholar]
Associated Data
This section collects any data citations, data availability statements, or supplementary materials included in this article.


