

Abstract
The positive effects of chronic endurance exercise training on health and performance have been well documented. These positive effects have been evaluated primarily at the structural level, and work has begun to evaluate mechanical adaptations of the myocardium. However, it remains poorly understood how the volume of exercise training affects cardiac adaptation. To gain some understanding, we subjected 3-mo-old Sprague-Dawley rats (n = 23) to treadmill running for 11 wk at one of three exercise volumes (moderate, high, and extra high). Following training, hearts were excised and mechanical testing was completed on skinned trabecular fiber bundles. Performance on a maximal fitness test was dose dependent on training volume, where greater levels of training led to greater performance. No differences were observed between animals from any group for maximal active stress and passive stress at a sarcomere length of 2.2 µm. Heart mass and passive stress at sarcomere lengths beyond 2.4 µm increased in a dose-dependent manner for animals in the control and moderate- and high-duration groups. However, hearts from animals in the extra high-duration group presented with inhibited responses for heart mass and passive stress, despite performing greatest on a graded treadmill fitness test. These results suggest that heart mass and passive stress adapt in a dose-dependent manner, until exercise becomes excessive and adaptation is inhibited. Our findings are in agreement with the beneficial role exercise has in cardiac adaptation. However, excessive exercise comes with risks of maladaptation, which must be weighed against the desire to increase performance.
NEW & NOTEWORTHY For the first time, we present findings on cardiac trabecular muscle passive stiffness and show the effect of excessive exercise on the heart. We demonstrated that heart mass increases with exercise until a maximum, after which greater exercise volume results in inhibited adaptation. At paraphysiological lengths, passive stiffness increases with exercise but to a lesser degree with excessive training. Despite greater performance on graded exercise tests, animals in the highest trained group exhibited possible maladaptation.
Keywords: excessive exercise, heart, treadmill exercise
INTRODUCTION
Following chronic aerobic exercise, adaptations to the heart have been observed at both the structural and mechanical levels. For example, it is well documented that aerobic exercise leads to proportional increases in the thickness of the ventricular walls and the volume of the ventricular lumen (30, 41, 43). As a result, the stroke volume, cardiac output, and therefore aerobic capacity increase (2, 4). Similarly, mechanical properties have been shown to adapt in isolated cardiac muscles following chronic exercise training (8).
Previous work has been conducted to evaluate the effects of exercise training on force produced by cardiac myocytes. For example, Diffee et al. (12) evaluated active and passive forces following an 11-wk treadmill exercise-training regimen in rats. Following the exercise training, they found no change in active and passive stresses produced by myocytes at optimal sarcomere length (2.3 μm). Several other studies supported the findings that active and passive force outputs in myocytes are unaltered following training (9–11). However, in these studies only the passive forces produced by inactive samples at optimal sarcomere lengths (2.2–2.3µm) were evaluated. It is not known how force production is affected by exercise at lengths below and beyond optimal length. Despite little change in isometric maximal force production, greater calcium sensitivity (10, 12, 29, 45) and loaded shortening velocities (6, 9) have been observed in rats following 11 to 13 wk of exercise training.
Natali et al. (32) performed an exercise intervention on rats and found increases in cardiac cell size. It is important to note that in this study voluntary wheel exercise was used, which may have elicited different adaptations than the forced exercise protocol used by Diffee et al. (12) and Diffee and Chung (9). Others have also found increased cell size with exercise training (9, 37).
The differences in contractile properties between trained and untrained myocytes have been well evaluated (6, 9, 10, 12, 45). However, the adaptations of cardiac myocytes in response to different volumes of exercise are not well understood. There are only a handful of studies in which the effects of exercise dose were evaluated, and the results are contradictory. For example, Kemi et al. (22) evaluated a 10-wk treadmill running program, which compared sedentary controls with moderate- and high-intensity-trained animals. The authors measured the rate of force production and calcium sensitivity in cardiac myocytes. As expected, the animals that completed the higher intensity exercise program had a greater rate of force production, increased calcium sensitivity, and greater fitness levels. They concluded that the greater the intensity of exercise, the more adaptation was observed.
Chung and Diffee (6) evaluated myocyte contractile properties in animals who completed a moderate- or a high-intensity exercise program. They found that the myocytes from animals who exercised had a greater power output than myocytes from the control animals, with no change in active or passive force output at 2.3 μm. However, and contrary to Kemi et al. (22), the myocytes in the moderate group had greater shortening velocities and thus a larger peak power output than myocytes from the high-intensity group animals.
The primary difference between these two studies was the age of the rats. Kemi et al. (22) used young rats (3–5 mo) and Chung and Diffee (6) used aged rats (>33 mo). The old rats may have had a lower exercise tolerance and therefore, the relative intensity might have been higher, possibly having led to excessive training loads. These high loads may have in turn resulted in decreased cell adaptations. These results led us to suggest a dose-dependent adaptation with training volume, until a threshold at which increased training volume leads to exhaustion and decrements in adaptation and performance.
Alterations in cardiac cell function in response to exercise have been described previously for active force production, calcium sensitivity, and power output. However, passive forces following stretch have not been evaluated and the effect of increasing exercise loads has not been well studied. In particular, the effects of very high-training loads have not yet been systematically evaluated. Therefore, the purpose of this study was to investigate the dose-dependent adaptation of cardiac muscle in response to chronic exercise training, including very high-training loads.
METHODS
Animals.
Twenty-four, three-month-old male Sprague-Dawley rats were randomized into four groups: 1) moderate-duration exercise (n = 6), 2) high-duration exercise (n = 6), 3) extra high-duration exercise (n = 6), and 4) no exercise (control) (n = 6) groups. Data were excluded from one control animal who was found dead during the intervention, leaving the final control group at n = 5. Animals were housed individually at 21°C on a 12:12-h light-dark cycle and were given standard rat chow and water ad libitum. All protocols were reviewed and approved by the University of Calgary Conjoint Health Research Ethics Board.
Exercise training.
Once the rats arrived at the animal holding facility, they were given 1 wk to acclimatize to the housing environment without being disturbed. Following the uninterrupted acclimatization week, the rats began their treadmill training. The training study protocol is outlined in Table 1. Week 0 of training (familiarization) was used to allow the animals to become familiarized with the treadmill (Columbus Instruments Exer-3R treadmill). The rats were placed on the stationary treadmill belt and allowed to explore the space for 10 min. There was a shocker located at the back of the treadmill, which delivered a mild electrical stimulus when the animals touched it. The animals were given a single piece of sugary fruit cereal (Froot Loop) at the front of the treadmill to encourage them to stay to the front of the belt. The following week (week 1 of training), the treadmill belt was turned on at low velocity (15 m/min) for 20 min. Immediately following each training session, rats were given one Froot Loop presented at the front of the treadmill as a reward. The treadmill speed was progressively increased until 25 m/min and duration was increased up to 60 min, depending on the animal’s respective training group (Table 1). The moderate-duration group progressively built up to 30 min of exercise each day, five times per week at 25 m/min. The high-duration group built up to 60 min of exercise per day, for five days per week at 25 m/min. The extra high-duration protocol (19) has been used previously to elicit an extra high-load response in rats. This group progressively reached sixty-minute training sessions 7 days per week at 25 m/min. In week 9, rats trained twice a day (two, 1-h sessions per day). In week 10, rats trained three times, and had four training sessions in the week 11 (equaling 4 h per day). To control for handling of the animals, the control animals were placed on the stationary treadmill 4 days per week for 10 min. In addition to the four sedentary sessions, the control animals also completed 15 min of very low-intensity exercise at 10 m/min once per week to maintain treadmill training for the fitness testing. Body mass was recorded on the first day of each week.
Table 1.
Exercise treadmill training protocols for all groups
| Moderate |
High |
Extra High |
||||||||
|---|---|---|---|---|---|---|---|---|---|---|
| Week | Speed (m/min) | Sessions/week | Sessions/day | Training Time | Sessions/week | Sessions/day | Training Time | Sessions/week | Sessions/day | Training Time |
| 1 | 15 | 5 | 1 | 20 | 5 | 1 | 30 | 7 | 1 | 20 |
| 2 | 20 | 5 | 1 | 30 | 5 | 1 | 30 | 7 | 1 | 30 |
| 3 | 22.5 | 5 | 1 | 30 | 5 | 1 | 45 | 7 | 1 | 45 |
| 4 | 25 | 5 | 1 | 30 | 5 | 1 | 60 | 7 | 1 | 60 |
| 5–8 | 25 | 5 | 1 | 30 | 5 | 1 | 60 | 7 | 1 | 60 |
| 9 | 25 | 5 | 1 | 30 | 5 | 1 | 60 | 7 | 2 | 60 |
| 10 | 25 | 5 | 1 | 30 | 5 | 1 | 60 | 7 | 3 | 60 |
| 11 | 25 | 5 | 1 | 30 | 5 | 1 | 60 | 7 | 4 | 60 |
| Control | ||||||||||
| 1–11 | 10 | 1 | — | 15 | ||||||
Maximal exercise testing.
Maximal exercise testing was conducted 9 days following the end of the final treadmill training session. This delay was intended to ensure chronic adaptation was measured, rather than effects of acute fatigue. Testing consisted of rats running on the treadmill while the treadmill speed was consistently increased until the rats were unable to maintain the pace. Following protocols set by Hohl et al. (19), the rats began running at 12 m/min and flat (0% grade). The speed was increased 1 m/min every 2 min until reaching a speed of 20 m/min. After 16 min, the speed was increased by 2 m/min every 3 min. The test was run until rats reached exhaustion and were unable to keep up with the treadmill pace, defined as the time in which the rat touched the shocker five times within 1 min (19). Maximal fitness was then calculated as a function of total work (19) completed where Work (kgm) = mass (kg) × velocity (m/min) × time (min) and Total work (kg/m) = Σmass (kg) × distance (m).
Tissue isolation.
While anesthetized, the rat’s chest cavities were opened. Animals were euthanized by severing the aorta and vena cava, and the heart was then removed. Hearts were immediately flushed with relaxing solution, and the aorta and vena cava were further dissected. Hearts were weighed to determine heart mass, and normalized to the left tibia length to control for body size, independent of body composition. The left ventricle was cut open and pinned, and thin strips of trabeculae were sliced across the left ventricle wall and pinned slightly stretched in relaxing solution. Muscle strips were skinned in a relaxing solution containing 1% Triton for 24 h on ice to permeabilize the cell membrane. Once skinned, the samples were moved to a 50% glycerol/50% relaxing solution for storage at −20°C and were tested within a week of being skinned.
Mechanical testing.
On the day of mechanical testing, a muscle strip was removed and placed in a relaxing solution where samples of ~100–300 μm in width and 1,000–2,000 μm in length were manually isolated under a Nikon SMZ1500 microscope. One end of the fiber was pierced by and glued to a hook connected to a length controller (Model 308; Aurora Scientific, Ontario, Canada) and the other end was attached to the hook of a force transducer (Model 400A; Aurora Scientific), allowing for control of myocyte length and measurement of force. All experiments were performed at ~15°C. The sample length was coarsely adjusted from slack until tension first developed. A He-Ne laser beam was then used to finely adjust sarcomere length to resting length of 2.2 μm. Following a 3-min rest period at 2.2 μm, the length and width of the sample and the passive force were recorded.
Maximal active stress.
Maximal active force at a sarcomere length of 2.2 µm, at the plateau region of the force-length relationship (17, 44), was determined by transferring the sample from the relaxing solution into a washing solution and then an activating solution. Length was maintained while total force produced was recorded. Once peak force was reached, the sample was returned to the relaxing solution. Active force was calculated as the difference between total force and resting passive force preceding the contraction (Fig. 1). Force was normalized to the samples cross-sectional area (the samples were assumed to be cylindrical in shape) to allow for comparison of active stress production across samples.
Fig. 1.
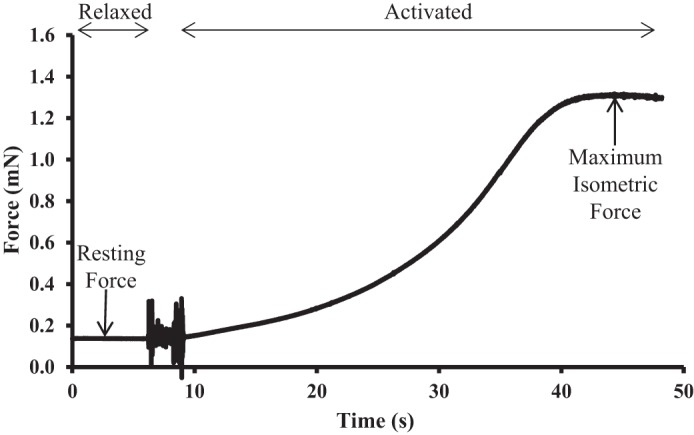
Sample trace from an active force measurement. Active force calculated as the difference between maximum isometric force and resting force before activation.
Passive stress.
While in the relaxing solution, samples were stretched passively from a resting sarcomere length of 2.2 µm to 10% (final sarcomere length of 2.42 µm) of the sample’s total resting length at a rate of 5% fiber length/s. Once the 10% stretch was finished, it was held for 20 s to allow for stress relaxation before being returned to the resting length. Peak passive force was taken as the maximum value at the end of the stretch, while steady-state passive force was determined as the mean value of the last second after stress-relaxation was complete and force had reached a plateau (Fig. 2). Both passive force values were converted to passive stress by normalizing force by the cross-sectional area. The same protocol was then repeated for a 15% fiber length stretch (final sarcomere length of 2.53 µm) at the same rate of stretch.
Fig. 2.

Sample trace from a passive force measurement. Black line indicates change in length, and gray line indicates the corresponding force output. Peak passive force was taken immediately following the stretch, and steady-state passive force was taken following stress relaxation.
Following the passive stretches, passive stress and active stress at a sarcomere length of 2.2 µm were measured to ensure the sample did not sustain damage. If passive stress or the maximum active stress decreased by more than 15% from the initial values before stretch, then the data from that fiber was excluded.
Data analysis.
To compare differences between groups for outcome measures (heart mass, fitness, and active/passive stress), one-way ANOVAs were conducted. Differences in body mass between groups and between weeks were analyzed using two-way ANOVAs. Between group differences were analyzed using Tukey post hoc analyses. Results are considered significant if P < 0.05.
Solutions.
Relaxing solution contained the following (in mM): 170 potassium propionate, 2.5 magnesium acetate, 20 MOPS, 5 K2EGTA, and 2.5 ATP, pH 7.0.
Activating solution contained the following (in mM): 170 potassium propionate, 2.5 magnesium acetate, 10 MOPS, 2.5 ATP, and CaEGTA and K2EGTA mixed at different proportions to obtain various values of pCa, pH 7.0.
Washing solution contained the following (in mM): 185 potassium propionate, 2.5 magnesium acetate, 10 MOPS, and 2.5 ATP, pH 7.0.
Skinning solution was comprised of 99 parts relaxing solution (potassium propionate, magnesium acetate, MOPS, K2EGTA, and ATP) and 1 part Triton.
Storing solution was comprised of a 1:1 mixture of relaxing solution and glycerol.
All solutions contained one tablet of protease inhibitors (Complete; Roche Diagnostics, Quebec, Canada) for 100 ml of solution.
RESULTS
Body mass.
Body mass increased significantly in all groups over the course of the acclimatization, familiarization, and training periods (P < 0.001; Fig. 3). The rate of body mass increase between groups was similar. However, animals who performed more exercise had significantly lower body masses (P < 0.001). Following week 9, and coinciding with the onset of the multiple sessions per day, animals in the extra high-duration group showed a significant decrease in body mass that continued until the end of the exercise training. In the final 3 wk of training, the animals in the extra high-duration group lost, on average, 63 g, or 10% of their body mass (P < 0.001; Fig. 3).
Fig. 3.
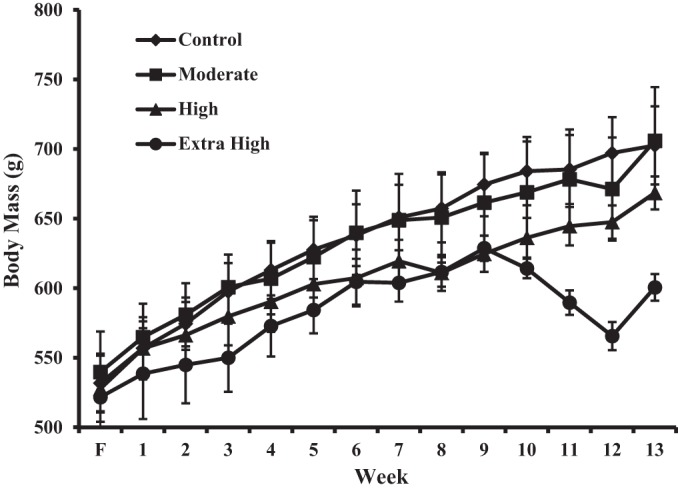
Body mass as a function of time (F = familiarization week) for each exercise intervention group.
Maximal exercise testing.
Performance on the graded treadmill test was positively related to the amount of exercise training completed (Fig. 4). Animals in all three exercise groups performed significantly better than the control group animals (P < 0.001). There was a positive dose-dependent trend. However there were no significant differences in performance between animals in the moderate- and the high-trained groups (P = 0.413) or between animals in the high-and the extra high-duration groups (P = 0.254). Animals in the extra high-trained group performed significantly better in the performance test than both the controls and the moderate-training group animals (P = 0.002).
Fig. 4.
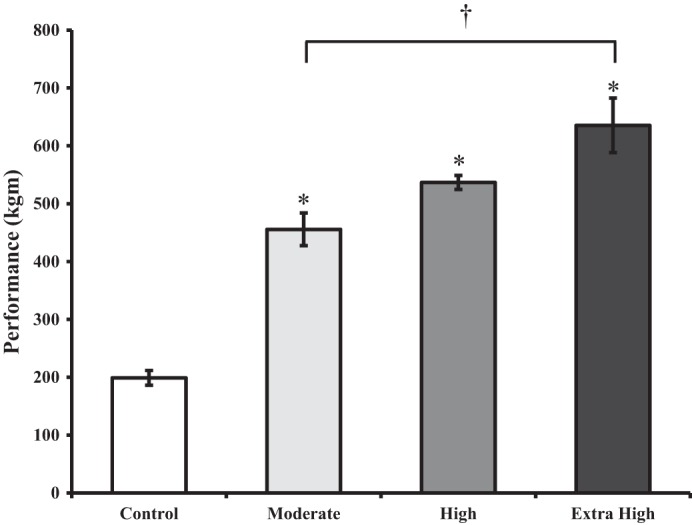
Mean performance scores for each group on a graded treadmill fitness test to volitional fatigue. Bars represent means ± SE. *Significant difference from control group animals. †Significant difference from the extra high-duration group animals.
Heart mass.
There was a positive dose-dependent trend for heart mass (normalized to tibia length) and exercise training volume from the control to the high-duration animals (Fig. 5), whereby more exercise training led to a greater relative heart mass. However, this trend was reversed for animals in the extra high-duration-trained group. Specifically, high-trained animals had significantly larger hearts than both the extra high-trained animals (P = 0.006) and the control group animals (P = 0.029).
Fig. 5.
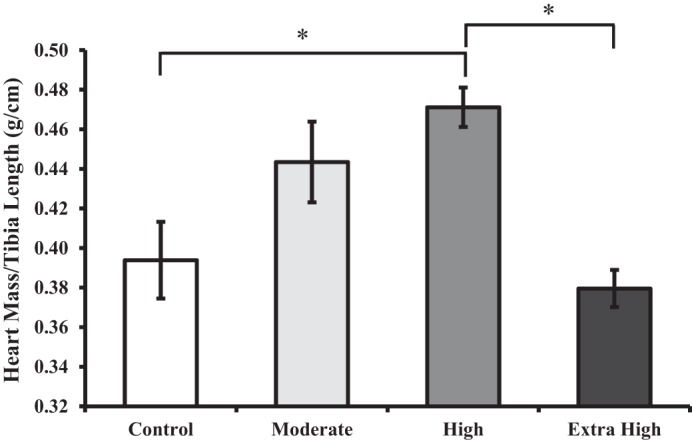
Heart mass relative to left tibia length. Bars represent mean ± SE. *Significant difference from high-training group animals.
Maximal active stress.
Active stress for maximal isometric activation of myocyte fascicle bundles at an average sarcomere length of 2.2 µm was similar across control and experimental training group animals (Table 2; P = 0.790).
Table 2.
Active and passive stresses from isolated myocyte bundles
| Control | Moderate | High | Extra High | |
|---|---|---|---|---|
| Maximal active stress, kN/m2 | 21.5 ± 2.8 | 18.2 ± 2.9 | 16.4 ± 4.1 | 17.3 ± 4.1 |
| SL = 2.2 μm | ||||
| Passive stress, kN/m2 | 2.4 ± 0.5 | 3.8 ± 0.6 | 4.1 ± 0.5 | 3.3 ± 0.8 |
| SL = 2.42μm | ||||
| Peak stress, kN/m2 | 9.8 ± 2.1 | 25.1 ± 5.6 | 28.3 ± 5.2 | 21.8 ± 5.4 |
| Steady state stress, kN/m2 | 5.3 ± 1.3 | 14.2 + 3.4 | 16.9 ± 3.7* | 8.2 ± 1.1 |
| Ratio of steady-state to peak stress, % | 52.6 ± 2.3 | 53.7 ± 0.4 | 55.8 ± 2.9 | 47.3 ± 8.0 |
| SL = 2.53μm | ||||
| Peak stress, kN/m2 | 15.8 ± 3.9 | 35.5 ± 5.9 | 49.1 ± 9.3* | 26.7 ± 4.1 |
| Steady state stress, kN/m2 | 10.1 ± 2.6 | 23.8 ± 4.2 | 33.8 ± 7.2* | 16.5 ± 2.7 |
| Ratio of steady-state to peak stress, % | 62.6 ± 2.7 | 62.6 ± 0.4 | 65.6 ± 2.1 | 61.3 ± 1.5 |
Values are means ± SE.
Significant difference from control group animals.
Passive stress.
Passive stresses at an average sarcomere length of 2.2 µm were similar across control and experimental group animals (P = 0.316; Table 2).
Following a 10% stretch beyond optimal length to an average sarcomere length of 2.42 µm, passive force increased throughout the stretch and then dropped to a steady-state stress (Figs. 2 and 6). The peak and the steady-state stresses tended to be greater for the moderate- and high-training group animals and to a lesser extent for the extra high-duration group animals, compared with the control group animals (P = 0.05; Table 2). Stress for animals in the high-training group was significantly greater than for the control group animals (P = 0.047), but none of the other groups were statistically different from each other (P = 0.164–0.867).
Fig. 6.
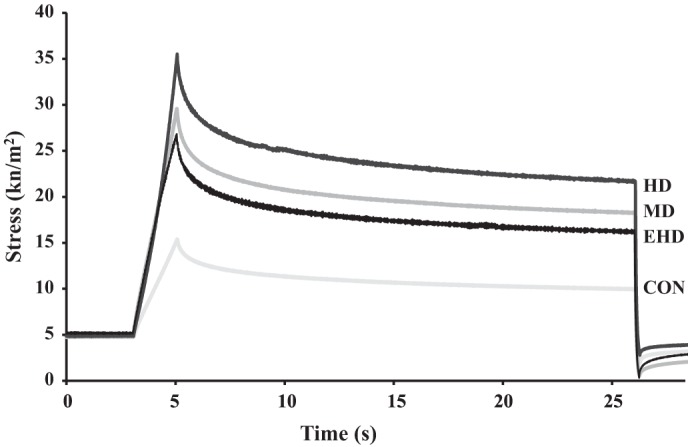
Sample traces from passive force measurements from each group during the stretch from 2.2 to 2.42 µm. HD, high duration; MD, moderate duration; EHD, extra high duration; CON, control.
At the average sarcomere length of 2.53 µm, the differences in the passive stresses between the control and various training group animals increased further from the differences observed at the shorter sarcomere lengths (Table 2) with the passive stresses significantly greater for the high-training group compared with the control group animals (P = 0.013). However, the passive stresses for the extra high-duration group animals were lower than those obtained for the high-duration training group animals (P = 0.079).
The relative differences between the maximum and steady-state stresses were not different between control group and training group animals at average sarcomere lengths of 2.42 µm (P = 0.853) and 2.53 µm (P = 0.716) (Table 2).
DISCUSSION
The purpose of this study was to investigate the dose-dependent adaptation of cardiac muscle in response to chronic exercise training. The main findings were that heart mass and passive stiffness at sarcomere lengths beyond 2.4 µm increased with exercise training in a dose-dependent manner, until training became exhaustive and these trends were reversed.
Body mass.
All animals increased in body mass up until the ninth week. Given that rats never reach skeletal maturity and their growth rate only begins to slow after 7–8 mo of age (39), it was expected that body mass increases over the course of the training program. In line with previous work (20), the animals that completed more exercise tended to have lower body mass compared with the control animals, which likely was the result of a more neutral caloric balance and a smaller increase in fat mass. An exception to the gradual and consistent increase in body mass was seen in the extra high-duration group animals between weeks 9 and 11 when they had a substantial loss of body mass. This loss of body mass coincided with the onset of the multiple training sessions per day. The substantial drop in body mass is likely attributable to a negative caloric balance (i.e., more energy was expended than was consumed), resulting in degradation of muscle proteins into amino acids to be catabolized for energy (7, 38). Exhaustive exercise in laboratory animal studies has been shown to result in decreased muscle mass and volume and a transition to a faster muscle type (7, 38). Additionally, previous work with the same extra high-duration protocol has also identified decreases in citrate synthase activity, greater blood leukocyte concentrations, and a lower glutamine to glutamate ratio (19). A decrease in body mass, like the one observed in this study, may be reflective of training-induced fatigue and a degradation stimulus that exceeds the adaptive capabilities for recovery.
Heart mass.
According to the classic findings of Morganroth et al. (30) and subsequent work (41, 43), we would expect an increase in the volume of the left ventricle and a proportional thickening of the heart walls with aerobic exercise. A limitation of our work is that we used heart mass as an indicator of cardiac structural development, rather than measuring the detailed architecture directly. However, increases in left ventricle mass have been attributed to an increase in hypertrophy and length of cardiac cells (28). For example, following 7 wk of treadmill running in rats, Anversa et al. (1) observed a 10% greater mass from trained hearts and a 25% enlargement of the ventricular volume with no change in the wall thickness. Based on these observations, it seems feasible to speculate that a greater heart mass represents a greater ventricular volume. In previous works in which heart mass was evaluated following exercise (9–12, 32, 45), increases in heart mass were observed, suggesting increases in absolute and relative heart mass are positive adaptations to aerobic exercise. Fitzsimmons et al. (15) evaluated heart rate following a 10-wk treadmill running program (similar in intensity and duration to our high-duration-training group) and found that the trained animals had significantly lower heart rates than the controls for a given performance. They attributed the decrease in heart rate to an increase in stroke volume, which would support the occurrence of eccentric hypertrophy of the heart in a rat training program similar to that used by our high-training group animals.
As expected, we observed an increase in heart mass with increasing exercise duration. This increase was observed for the animals in the high-training-duration exercise groups but was reversed with the extra high-duration group animals, which had hearts similar in mass to the moderate-duration group animals. This result suggests that there might have been a structural maladaptation to the exercise training in the extra high-duration group animals (1, 9, 45). Similar to the decreases in body mass observed in the extra high-training group animals, this finding may reflect an imbalance between anabolism and catabolism due to insufficient recovery between training stimuli. In a similar study comparing a moderate and high intensity of exercise in aged rats, Chung and Diffee (6) evaluated ventricular mass, both in absolute terms and normalized to tibia length. Although not statistically significant, they observed a trend toward a greater mass in the moderate group relative to controls and a lower mass in the high-trained group relative to the control and moderate-trained groups. Despite not reaching statistical significance, their findings parallel ours and may suggest a maladaptation that could occur with excessive chronic exercise training. These results may be indicative of a possible chronic, long-term inhibition of adaptation in heart structure with excessive exercise (26).
Maximal exercise testing.
Maximal exercise test results from the control and moderate- and high-duration group animals were as expected (2). Animals that completed more exercise performed better on the maximal treadmill test. Based on previous work using the same protocols (13, 19), we hypothesized that the animals in the extra high-duration group would have decreased performance relative to those in the high-training group. Counter to our hypothesis, the extra high-duration group had the greatest scores for the performance test. Given that this result did not support our hypothesis, we speculate three possible reasons for the observed discrepancy. First, it is possible that the test failed to measure the true maximum abilities of the animals. Since expired gases were not measured in this study, we cannot confirm that all animals reached their true maximal performance. However, we attempted to minimize this potential error by using an established protocol with defined end criteria that has been previously validated (19).
It is also possible that the animals in the extra high-duration group may have had a reduced performance potential but the true peak performance was not captured. We only had three exercise groups, and it is possible that if we had another group of animals that had done more exercise than the high-duration group animals but less than the extra high-duration group animals, these animals may have had the greatest performance potential. The extra high-duration group animals would then reflect a drop in performance relative to the new group, but this was not captured. Similarly, had we performed multiple performance tests throughout the intervention protocol, we may have captured a decrease in performance and would have been able to identify when this performance reduction occurred, rather than just evaluating cross sectionally (19). For example, it is possible that performance was highest for the extra high-duration group animals at week 9 and then decreased over the final 3 wk of the exercise intervention.
Additionally, the extra high-duration animals may have functionally adapted to the high loads (26) and were still able to perform at a high level despite the inhibited tissue responses. For example, despite smaller increases in heart mass and passive stiffness, these animals had functionally adapted to the excessive stress and had recovered performance capability (19, 26). Using the same training protocol as our extra high group, Hohl et al. (19) found a natural split between animals whose performance decreased and those whose performance increased during the multiple sessions per day. Hohl et al. (19) measured performance at multiple time points throughout the exercise intervention protocol and used repeated measures analysis for assessing performance longitudinally and identify overtraining, while in our study, comparisons were made cross sectionally at one time point and across training groups. In the present study, the standard deviation of the performance test scores in the extra high-duration animals was twice as big as the standard deviation of the other groups, which possibly suggests a stratified adaptation across the animals. When this distribution of performance was evaluated further, there seemed to be a case for splitting the animals into responders and nonresponders (Fig. 7). However, without multiple performance testing, we do not know if performance in some of these animals reached a peak and then dropped during the exercise intervention period or if performance just increased at a lower rate throughout the entire intervention period. Furthermore, when evaluating animals from the extra high-duration group closer, animals with the lowest performance scores did not necessarily have the lowest scores for the other variables, and therefore, this analysis may not provide a relevant and meaningful distinction between animals in the extra high-duration group.
Fig. 7.
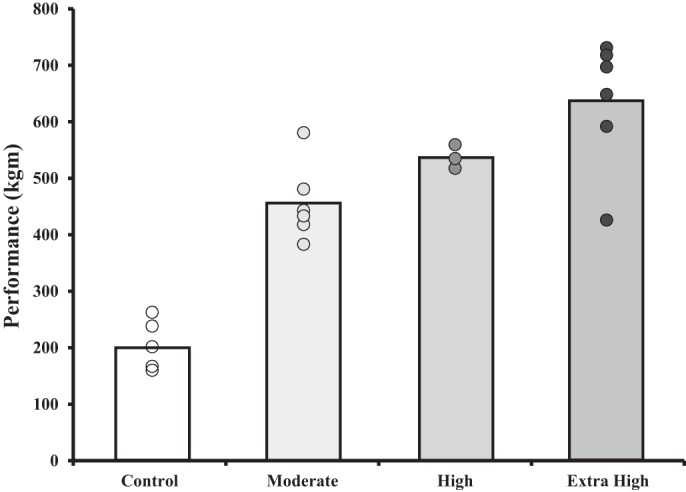
Illustration depicting the variability in performance tests for the animals in the extra high-duration group. Bars indicate the average for each group. Points indicate each animal within the group.
Maximal active stress.
There were no differences between our groups for tissue sample diameter. However, to control for the effect of preparation size on force production, force production was normalized relative to the cross-sectional area of each sample to obtain stress. Stress values similar to the ones obtained in our study were previously reported for cardiac muscle at the same temperature and sarcomere length (6, 9, 25, 35, 42, 44). Furthermore, our findings suggest, in alignment with previous work (6, 9–12), that maximal active force production is not different between exercise trained and untrained animals. Therefore, it seems the primary adaptation enabling a greater force output from the heart is due to an increase in muscle mass, rather than an increase in the maximum active contractile force of the muscle. However, some previous work has identified adaptations in the submaximal active force output (calcium sensitivity) of myocytes following exercise training (10–12). Additionally, future work should evaluate active force production at shorter sarcomere lengths to better evaluate force production throughout the physiological range of sarcomere lengths during systole.
Passive stress.
We did not find differences in passive force at a sarcomere length of 2.2 μm. Previous work investigating the effects of exercise on the mechanical properties of the cardiac muscle and passive force found similar results and suggested that no adaptations occur to passive stiffness at sarcomere lengths of 2.2 µm (6, 9–12). However, as the average sarcomere lengths increased from 2.2 to 2.42 μm, and finally to 2.53 μm, the differences in passive force between experimental group animals began to increase. For average sarcomere lengths of 2.42 and 2.53 μm, differences in passive forces reached statistical significance between the high-duration and the control group animals. Although passive stretching following exercise training has not been evaluated previously beyond average sarcomere lengths of 2.2 μm, the values obtained in this study are similar to those found in previous works in which passive forces were measured in sedentary animals (14, 18, 34, 44). Cardiac muscle has been shown to have a passive stiffness that is approximately three to four times greater than that of skeletal muscles at similar sarcomere lengths. It is thought that this increased passive stiffness is due to a denser network of connective tissue and shorter, and thus stiffer, isoforms of titin compared with skeletal muscle (14, 17). Therefore, passive stiffness in cardiac muscle can be attributed to titin within sarcomeres and the connective tissue between fibers, fascicles and surrounding the muscle. Granzier and Irving (17) evaluated passive forces in cardiac myocytes and suggested that passive stiffness in cardiac muscle at average sarcomere lengths of less than 2.1 μm is due primarily to titin, while at sarcomere lengths greater than ~2.1 μm the stiffness are predominantly a result of the connective tissue. Previous work using skinned muscle preparations has shown that titin degradation does not exceed 15% during the skinning process (16, 17, 21). Based on these previous studies, we speculate that titin was intact following skinning, and its contribution to passive force was measured. However, whether titin was intact in this study was not confirmed directly. Therefore, since we did not observe differences in passive forces at sarcomere lengths of 2.2 μm, but observed greater differences at sarcomere lengths of 2.42 μm, and larger differences yet at sarcomere lengths of 2.53 μm, we speculate that the increased passive forces observed with exercise training were caused primarily by adaptations of the connective tissue content rather than an alteration in the expression of titin isoforms.
When stretching cardiac muscle beyond 2.2 µm, it is important to ensure damage does not occur to the samples. In this study, the force-time traces were carefully examined during stretches to ensure there were no sharp decreases in slope which would indicate breaking of the samples or the attachments. Stretches were conducted in the same order for all samples. Additionally, resting passive and maximum active forces were compared before and after the stretches to ensure resting forces did not decrease and that active force did not decrease by more than 15%. Furthermore, the average change in resting passive force following both stretches was only a 4% decrease. Therefore, in the samples analyzed, damage to the preparations is not likely to have contributed to the observed forces.
Given that we did not measure changes to passive forces within the physiological range (<2.2 μm), it seems that exercise training does not affect in vivo (1.7–2.3 μm) (17, 44) heart stiffness. Previous work has been conducted on aging or pathologies (heart failure, for example) and has also identified a stiffening of heart muscle. However, many of these studies have been performed on whole muscle and at physiological lengths (24, 31). In isolated muscle, the stiffening has also occurred at shorter sarcomere lengths [ascending limb and the plateau of the force-length relationship (1.9–2.4 µm)] (3, 5, 40) which significantly affect the ability of the hearts to fill. In the present study, there did not seem to be differences in the passive force of the hearts at average sarcomere lengths shorter than 2.2 µm. Therefore, as the heart fills through this range during normal function, the passive forces have much less effect on filling of the heart as has been shown to occur in fibrosis associated with aging and certain pathologies.
It is important to consider that due to the chemical skinning of the muscle, the passive forces may have been affected. For example, Kentish et al. (23) evaluated passive forces before, and following, a skinning protocol (1% Triton) and observed decreases in passive forces at sarcomere lengths greater than 2.2 µm. Based on these findings, we speculate that the differences in passive force beyond 2.2 µm observed in this study were due to the extracellular matrix but that passive forces may be underestimated relative to the in vivo (unskinned) forces. As mentioned previously, it is likely that titin has remained intact through the skinning process (16, 17, 21) and that the samples did not sustain damage from stretching. However, the skinning process and isolation of fiber bundles have been shown to break down connective tissue, which should be considered when interpreting these results. Furthermore, it is important to consider that this testing was conducted on trabecular muscle. It is possible that the trabeculae adapt differently than the muscle of the ventricular walls, due to differing in vivo demands.
Conclusion.
The heart has previously been shown to respond to chronic exercise primarily through structural (30) as well as mechanical adaptations (8). We observed a dose-dependent increase in heart mass and passive forces at sarcomere lengths beyond 2.4 µm for the animals in the control and moderate- and high-duration exercise groups with a reversal of these trends for the animals in the extra high-duration group. However, performance on a graded exercise test increased in a dose-dependent manner, with the extra high-duration group animals showing the greatest fitness levels. Despite the beneficial role exercise plays in heart health, highly trained and masters athletes have a greater risk for cardiac arrest and arrhythmias than normal peers (27). Similarly, despite the fact that the animals in this study were seemingly able to functionally adapt and perform at a high level, there were also negative adaptations. These negative adaptations may be early signs of a possible maladaptation in the athlete’s heart and, if left unaddressed, may have developed into cardiac myopathies resulting in increased risk for cardiac arrest (27, 33, 36).
Within an appropriate volume, exercise has been shown to be overwhelmingly beneficial. This study is in agreement with these earlier observations and supports participation in aerobic training with evidence of positive structural and mechanical adaptations of the heart. However, excessive exercise comes with risks of maladaptation, which must be weighed against the desire to increase performance.
GRANTS
This work was supported by the Natural Sciences and Engineering Research Council, Canada Research Chair Programme, the Canadian Institutes for Health Research, Alberta Innovates Health Solutions, Killam Foundation, and Brazil Ministry of Education CAPES Foundation.
DISCLOSURES
No conflicts of interest, financial or otherwise, are declared by the authors.
AUTHOR CONTRIBUTIONS
K.R.B., V.J., and W.H. conceived and designed research; K.R.B. and J.L.R. performed experiments; K.R.B. analyzed data; K.R.B., V.J., and W.H. interpreted results of experiments; K.R.B. prepared figures; K.R.B. drafted manuscript; K.R.B., J.L.R., V.J., and W.H. edited and revised manuscript; K.R.B., J.L.R., V.J., and W.H. approved final version of manuscript.
ACKNOWLEDGMENTS
We thank the staff of the University of Calgary Life and Environmental Sciences Animal Resource Centre for tremendous support and for taking such good care of our animals.
REFERENCES
- 1.Anversa P, Levicky V, Beghi C, McDonald SL, Kikkawa Y. Morphometry of exercise-induced right ventricular hypertrophy in the rat. Circ Res 52: 57–64, 1983. doi: 10.1161/01.RES.52.1.57. [DOI] [PubMed] [Google Scholar]
- 2.Bassett DR Jr, Howley ET. Limiting factors for maximum oxygen uptake and determinants of endurance performance. Med Sci Sports Exerc 32: 70–84, 2000. doi: 10.1097/00005768-200001000-00012. [DOI] [PubMed] [Google Scholar]
- 3.Borbély A, van der Velden J, Papp Z, Bronzwaer JG, Edes I, Stienen GJ, Paulus WJ. Cardiomyocyte stiffness in diastolic heart failure. Circulation 111: 774–781, 2005. doi: 10.1161/01.CIR.0000155257.33485.6D. [DOI] [PubMed] [Google Scholar]
- 4.Brady AJ. Mechanical properties of isolated cardiac myocytes. Physiol Rev 71: 413–428, 1991. doi: 10.1152/physrev.1991.71.2.413. [DOI] [PubMed] [Google Scholar]
- 5.Chaturvedi RR, Herron T, Simmons R, Shore D, Kumar P, Sethia B, Chua F, Vassiliadis E, Kentish JC. Passive stiffness of myocardium from congenital heart disease and implications for diastole. Circulation 121: 979–988, 2010. doi: 10.1161/CIRCULATIONAHA.109.850677. [DOI] [PubMed] [Google Scholar]
- 6.Chung E, Diffee GM. Moderate intensity, but not high intensity, treadmill exercise training alters power output properties in myocardium from aged rats. J Gerontol A Biol Sci Med Sci 67: 1178–1187, 2012. doi: 10.1093/gerona/gls146. [DOI] [PMC free article] [PubMed] [Google Scholar]
- 7.De Souza RW, Aguiar AF, Carani FR, Campos GE, Padovani CR, Silva MD. High-intensity resistance training with insufficient recovery time between bouts induce atrophy and alterations in myosin heavy chain content in rat skeletal muscle. Anat Rec (Hoboken) 294: 1393–1400, 2011. doi: 10.1002/ar.21428. [DOI] [PubMed] [Google Scholar]
- 8.Diffee GM. Adaptation of cardiac myocyte contractile properties to exercise training. Exerc Sport Sci Rev 32: 112–119, 2004. doi: 10.1097/00003677-200407000-00007. [DOI] [PubMed] [Google Scholar]
- 9.Diffee GM, Chung E. Altered single cell force-velocity and power properties in exercise-trained rat myocardium. J Appl Physiol (1985) 94: 1941–1948, 2003. doi: 10.1152/japplphysiol.00889.2002. [DOI] [PubMed] [Google Scholar]
- 10.Diffee GM, Nagle DF. Exercise training alters length dependence of contractile properties in rat myocardium. J Appl Physiol (1985) 94: 1137–1144, 2003. doi: 10.1152/japplphysiol.00565.2002. [DOI] [PubMed] [Google Scholar]
- 11.Diffee GM, Nagle DF. Regional differences in effects of exercise training on contractile and biochemical properties of rat cardiac myocytes. J Appl Physiol (1985) 95: 35–42, 2003. doi: 10.1152/japplphysiol.00951.2002. [DOI] [PubMed] [Google Scholar]
- 12.Diffee GM, Seversen EA, Titus MM. Exercise training increases the Ca2+ sensitivity of tension in rat cardiac myocytes. J Appl Physiol (1985) 91: 309–315, 2001. doi: 10.1152/jappl.2001.91.1.309. [DOI] [PubMed] [Google Scholar]
- 13.Ferraresso RL, de Oliveira R, Macedo DV, Nunes LA, Brenzikofer R, Damas D, Hohl R. Interaction between overtraining and the interindividual variability may (not) trigger muscle oxidative stress and cardiomyocyte apoptosis in rats. Oxid Med Cell Longev 2012: 935483, 2012. doi: 10.1155/2012/935483. [DOI] [PMC free article] [PubMed] [Google Scholar]
- 14.Fish D, Orenstein J, Bloom S. Passive stiffness of isolated cardiac and skeletal myocytes in the hamster. Circ Res 54: 267–276, 1984. doi: 10.1161/01.RES.54.3.267. [DOI] [PubMed] [Google Scholar]
- 15.Fitzsimons DP, Bodell PW, Herrick RE, Baldwin KM. Left ventricular functional capacity in the endurance-trained rodent. J Appl Physiol (1985) 69: 305–312, 1990. doi: 10.1152/jappl.1990.69.1.305. [DOI] [PubMed] [Google Scholar]
- 16.Fukuda N, Wu Y, Nair P, Granzier HL. Phosphorylation of titin modulates passive stiffness of cardiac muscle in a titin isoform-dependent manner. J Gen Physiol 125: 257–271, 2005. doi: 10.1085/jgp.200409177. [DOI] [PMC free article] [PubMed] [Google Scholar]
- 17.Granzier HL, Irving TC. Passive tension in cardiac muscle: contribution of collagen, titin, microtubules, and intermediate filaments. Biophys J 68: 1027–1044, 1995. doi: 10.1016/S0006-3495(95)80278-X. [DOI] [PMC free article] [PubMed] [Google Scholar]
- 18.Hanft LM, McDonald KS. Length dependence of force generation exhibit similarities between rat cardiac myocytes and skeletal muscle fibres. J Physiol 588: 2891–2903, 2010. doi: 10.1113/jphysiol.2010.190504. [DOI] [PMC free article] [PubMed] [Google Scholar]
- 19.Hohl R, Ferraresso RL, De Oliveira RB, Lucco R, Brenzikofer R, De Macedo DV. Development and characterization of an overtraining animal model. Med Sci Sports Exerc 41: 1155–1163, 2009. doi: 10.1249/MSS.0b013e318191259c. [DOI] [PubMed] [Google Scholar]
- 20.Jakicic JM, Clark K, Coleman E, Donnelly JE, Foreyt J, Melanson E, Volek J, Volpe SL; American College of Sports Medicine . American College of Sports Medicine position stand. Appropriate intervention strategies for weight loss and prevention of weight regain for adults. Med Sci Sports Exerc 33: 2145–2156, 2001. doi: 10.1097/00005768-200112000-00026. [DOI] [PubMed] [Google Scholar]
- 21.Joumaa V, Rassier DE, Leonard TR, Herzog W. The origin of passive force enhancement in skeletal muscle. Am J Physiol Cell Physiol 294: C74–C78, 2008. doi: 10.1152/ajpcell.00218.2007. [DOI] [PubMed] [Google Scholar]
- 22.Kemi OJ, Haram PM, Loennechen JP, Osnes JB, Skomedal T, Wisløff U, Ellingsen Ø. Moderate vs. high exercise intensity: differential effects on aerobic fitness, cardiomyocyte contractility, and endothelial function. Cardiovasc Res 67: 161–172, 2005. doi: 10.1016/j.cardiores.2005.03.010. [DOI] [PubMed] [Google Scholar]
- 23.Kentish JC, ter Keurs HE, Ricciardi L, Bucx JJ, Noble MI. Comparison between the sarcomere length-force relations of intact and skinned trabeculae from rat right ventricle. Influence of calcium concentrations on these relations. Circ Res 58: 755–768, 1986. doi: 10.1161/01.RES.58.6.755. [DOI] [PubMed] [Google Scholar]
- 24.Lieber SC, Aubry N, Pain J, Diaz G, Kim SJ, Vatner SF. Aging increases stiffness of cardiac myocytes measured by atomic force microscopy nanoindentation. Am J Physiol Heart Circ Physiol 287: H645–H651, 2004. doi: 10.1152/ajpheart.00564.2003. [DOI] [PubMed] [Google Scholar]
- 25.McDonald KS, Wolff MR, Moss RL. Force-velocity and power-load curves in rat skinned cardiac myocytes. J Physiol 511: 519–531, 1998. doi: 10.1111/j.1469-7793.1998.519bh.x. [DOI] [PMC free article] [PubMed] [Google Scholar]
- 26.Meeusen R, Duclos M, Gleeson M, Rietjens G, Steinacker J, Urhausen A. Prevention, diagnosis and treatment of the overtraining syndrome. Eur J Sport Sci 6: 1–14, 2006. doi: 10.1080/17461390600617717. [DOI] [PubMed] [Google Scholar]
- 27.Molina L, Mont L, Marrugat J, Berruezo A, Brugada J, Bruguera J, Rebato C, Elosua R. Long-term endurance sport practice increases the incidence of lone atrial fibrillation in men: a follow-up study. Europace 10: 618–623, 2008. doi: 10.1093/europace/eun071. [DOI] [PubMed] [Google Scholar]
- 28.Moore RL, Korzick DH. Cellular adaptations of the myocardium to chronic exercise. Prog Cardiovasc Dis 37: 371–396, 1995. doi: 10.1016/S0033-0620(05)80019-2. [DOI] [PubMed] [Google Scholar]
- 29.Moore RL, Musch TI, Yelamarty RV, Scaduto RC Jr, Semanchick AM, Elensky M, Cheung JY. Chronic exercise alters contractility and morphology of isolated rat cardiac myocytes. Am J Physiol Cell Physiol 264: C1180–C1189, 1993. doi: 10.1152/ajpcell.1993.264.5.C1180. [DOI] [PubMed] [Google Scholar]
- 30.Morganroth J, Maron BJ, Henry WL, Epstein SE. Comparative left ventricular dimensions in trained athletes. Ann Intern Med 82: 521–524, 1975. doi: 10.7326/0003-4819-82-4-521. [DOI] [PubMed] [Google Scholar]
- 31.Nance ME, Whitfield JT, Zhu Y, Gibson AK, Hanft LM, Campbell KS, Meininger GA, McDonald KS, Segal SS, Domeier TL. Attenuated sarcomere lengthening of the aged murine left ventricle observed using two-photon fluorescence microscopy. Am J Physiol Heart Circ Physiol 309: H918–H925, 2015. doi: 10.1152/ajpheart.00315.2015. [DOI] [PMC free article] [PubMed] [Google Scholar]
- 32.Natali AJ, Wilson LA, Peckham M, Turner DL, Harrison SM, White E. Different regional effects of voluntary exercise on the mechanical and electrical properties of rat ventricular myocytes. J Physiol 541: 863–875, 2002. doi: 10.1113/jphysiol.2001.013415. [DOI] [PMC free article] [PubMed] [Google Scholar]
- 33.Naylor LH, George K, O’Driscoll G, Green DJ. The athlete’s heart: a contemporary appraisal of the ‘Morganroth hypothesis’. Sports Med 38: 69–90, 2008. doi: 10.2165/00007256-200838010-00006. [DOI] [PubMed] [Google Scholar]
- 34.Opitz CA, Kulke M, Leake MC, Neagoe C, Hinssen H, Hajjar RJ, Linke WA. Damped elastic recoil of the titin spring in myofibrils of human myocardium. Proc Natl Acad Sci USA 100: 12688–12693, 2003. doi: 10.1073/pnas.2133733100. [DOI] [PMC free article] [PubMed] [Google Scholar]
- 35.Raman S, Kelley MA, Janssen PM. Effect of muscle dimensions on trabecular contractile performance under physiological conditions. Pflugers Arch 451: 625–630, 2006. doi: 10.1007/s00424-005-1500-9. [DOI] [PubMed] [Google Scholar]
- 36.Rowland T. Is the ‘athlete’s heart’ arrhythmogenic? Implications for sudden cardiac death. Sports Med 41: 401–411, 2011. doi: 10.2165/11583940-000000000-00000. [DOI] [PubMed] [Google Scholar]
- 37.Schultz RL, Swallow JG, Waters RP, Kuzman JA, Redetzke RA, Said S, de Escobar GM, Gerdes AM. Effects of excessive long-term exercise on cardiac function and myocyte remodeling in hypertensive heart failure rats. Hypertension 50: 410–416, 2007. doi: 10.1161/HYPERTENSIONAHA.106.086371. [DOI] [PubMed] [Google Scholar]
- 38.Seene T, Kaasik P, Alev K, Pehme A, Riso EM. Composition and turnover of contractile proteins in volume-overtrained skeletal muscle. Int J Sports Med 25: 438–445, 2004. doi: 10.1055/s-2004-820935. [DOI] [PubMed] [Google Scholar]
- 39.Sengupta P. The laboratory rat: relating its age with human’s. Int J Prev Med 4: 624–630, 2013. [PMC free article] [PubMed] [Google Scholar]
- 40.Slater RE, Strom JG, Granzier H. Effect of exercise on passive myocardial stiffness in mice with diastolic dysfunction. J Mol Cell Cardiol 108: 24–33, 2017. doi: 10.1016/j.yjmcc.2017.04.006. [DOI] [PubMed] [Google Scholar]
- 41.Spence AL, Naylor LH, Carter HH, Buck CL, Dembo L, Murray CP, Watson P, Oxborough D, George KP, Green DJ. A prospective randomised longitudinal MRI study of left ventricular adaptation to endurance and resistance exercise training in humans. J Physiol 589: 5443–5452, 2011. doi: 10.1113/jphysiol.2011.217125. [DOI] [PMC free article] [PubMed] [Google Scholar]
- 42.van der Velden J, Klein LJ, van der Bijl M, Huybregts MA, Stooker W, Witkop J, Eijsman L, Visser CA, Visser FC, Stienen GJ. Force production in mechanically isolated cardiac myocytes from human ventricular muscle tissue. Cardiovasc Res 38: 414–423, 1998. doi: 10.1016/S0008-6363(98)00019-4. [DOI] [PubMed] [Google Scholar]
- 43.Venckunas T, Lionikas A, Marcinkeviciene JE, Raugaliene R, Alekrinskis A, Stasiulis A. Echocardiographic parameters in athletes of different sports. J Sports Sci Med 7: 151–156, 2008. [PMC free article] [PubMed] [Google Scholar]
- 44.Weiwad WK, Linke WA, Wussling MH. Sarcomere length-tension relationship of rat cardiac myocytes at lengths greater than optimum. J Mol Cell Cardiol 32: 247–259, 2000. doi: 10.1006/jmcc.1999.1069. [DOI] [PubMed] [Google Scholar]
- 45.Wisløff U, Helgerud J, Kemi OJ, Ellingsen O. Intensity-controlled treadmill running in rats: V̇o2max and cardiac hypertrophy. Am J Physiol Heart Circ Physiol 280: H1301–H1310, 2001. doi: 10.1152/ajpheart.2001.280.3.H1301. [DOI] [PubMed] [Google Scholar]