

Abstract
Free all-trans-retinal (atRAL) and retinal pigment epithelium (RPE) lipofuscin are both considered to play etiological roles in Stargardt disease and age-related macular degeneration. A2E and all-trans-retinal dimer (atRAL-dimer) are two well characterized bisretinoid constituents of RPE lipofuscin. In this study, we found that, after treatment of primary porcine RPE (pRPE) cells with atRAL, atRAL-dimer readily formed and accumulated in a concentration- and time-dependent manner, but A2E was barely detected. Cell-based assays revealed that atRAL, the precursor of atRAL-dimer, significantly altered the morphology of primary pRPE cells and decreased cell viability at a concentration of 80 μm regardless of light exposure. By contrast, atRAL-dimer was not cytotoxic and phototoxic to primary pRPE cells. Compared with atRAL and A2E, atRAL-dimer was more vulnerable to light, followed by the generation of its photocleaved products. Moreover, we observed the presence of atRAL-dimer in reaction mixtures of atRAL with porcine rod outer segments (ROS), RPE/choroid, or neural retina. Taken together, we here proposed an alternative metabolic/antidotal pathway of atRAL in the retina: atRAL that evades participation of the visual (retinoid) cycle undergoes a condensation reaction to yield atRAL-dimer in both ROS and RPE. Translocation of atRAL, all-trans N-retinylidene–phosphatidylethanolamine (NR-PE), atRAL-dimer, and photocleavage products of atRAL-dimer from ROS into RPE is accomplished by phagocytosing shed ROS on a daily basis. Without causing damage to RPE cells, light breaks up total atRAL-dimer within RPE cells to release low-molecular-weight photocleavage fragments. The latter, together with ROS-atRAL-dimer photocleavage products, may easily move across membranes and thereby be metabolically eliminated.
Keywords: retinal metabolism, photoreceptor, retina, retinoid, phagocytosis, all-trans-retinal, all-trans-retinal dimer, metabolic/antidotal pathway, primary porcine RPE cells, retina
Introduction
Most steps of the visual (retinoid) cycle take place between retinal pigment epithelium (RPE)2 and rod outer segments (ROS) (1). Rhodopsin consisting of the 11-cis-retinal (11-cis-RAL) chromophore and opsin is embedded in the disks of ROS (2). After absorbing a photon of light, rhodopsin is bleached to form the meta II intermediate, along with the photoisomerization of 11-cis-RAL into all-trans-retinal (atRAL). The latter will be reduced to all-trans-retinol (atROL) in the photoreceptor cytoplasm by retinol dehydrogenase 8 (RDH8), RDH11, and RDH12 (3, 4). atROL, also called vitamin A, can be isomerized into 11-cis-retinol (11-cis-ROL) in the RPE via RPE65, the visual cycle retinol isomerase (5). 11-cis-RAL, generated by the oxidation of 11-cis-ROL by RDH5 (6), will be transported through the interphotoreceptor matrix into the ROS disk lumen with the aid of interphotoreceptor retinoid–binding protein (IRBP). In the ROS disk lumen, 11-cis-RAL binds with opsin to regenerate a dark-adapted rhodopsin, and initiates a fresh visual (retinoid) cycle (7).
During the visual (retinoid) cycle, ABCA4 functions as a transporter of all-trans N-retinylidene-phosphatidylethanolamine (NR-PE) Schiff base, a condensation product of atRAL and PE. After being transported from the disk membrane to the cytoplasmic side of the photoreceptor, all-trans NR-PE is dissociated into atRAL and PE (8–10), and atRAL is reduced to atROL by RDH8, RDH11, and RDH12 (3, 4, 11). Nevertheless, free atRAL that evades reduction will further react with all-trans NR-PE or condense itself to create atRAL condensation products, which are phagocytosed by the RPE and thereby accumulate as leading components of RPE lipofuscin (1). Previous evidence has revealed that, compared with atRAL, A2E (12, 13) and all-trans-retinal dimer (atRAL-dimer) (Fig. 1) (14), two well characterized bisretinoid constituents of RPE lipofuscin, were much less toxic to ARPE-19 cells, a human RPE cell line (15, 16). In the eyes of WT mice as well as the RPE/choroid of normal humans, A2E is readily detected and deposited age-dependently (17–21); however, atRAL-dimer is observed at a very low level and even not detected (14, 16, 22, 23). Most recently, we demonstrated that incubation of ARPE-19 cells with atRAL significantly gives rise to atRAL-dimer, but A2E is hardly detected (16). These phenomena suggest additional roles for atRAL-dimer formation. Accordingly, in this work, we elucidate an alternative metabolic/antidotal pathway of atRAL in the retina.
Figure 1.

atRAL and atRAL-dimer. Shown are structures, UV-visible absorbance maxima (nanometers), and electronic transition assignments (↔). Two (2) molecules of atRAL undergo a condensation reaction to generate one (1) molecule of atRAL-dimer (14). The carbon atoms in atRAL-dimer are numbered.
Results
atRAL-induced formation and buildup of atRAL-dimer in primary pRPE cells
Shown in Fig. 2A is a representative picture of the morphology of primary pRPE cells isolated from porcine eyes. Immunofluorescence staining of primary pRPE cells showed significant expression of the tight junction protein ZO-1 (Fig. 2B, green). In work aimed at corroborating the identity of primary pRPE cells, we clearly observed expression of the RPE-specific marker RPE65 by immunofluorescence staining (Fig. 2C, red) as well as that of RPE65 in cell lysates by Western blotting (Fig. 2D). To further confirm the activity of RPE65 in primary pRPE cells, we incubated primary pRPE cells with atROL for 12 h and readily observed the generation of 11-cis-ROL by reverse-phase HPLC (Fig. 2E). Upon examination by HPLC, 6-h incubation of primary pRPE cells with 80 μm atRAL significantly induced the formation of atRAL-dimer, exhibiting absorbance maxima at 430 and 290 nm (Fig. 3A). To further corroborate the presence of atRAL-dimer in atRAL-treated primary pRPE cells, the HPLC chromatogram of one-half of a methanolic chloroform extract derived from primary pRPE cells treated with atRAL for 6 h was compared with that of a mixture of the second half of the cell extract and 20 pmol of synthetic atRAL-dimer. As expected, the peak height of atRAL-dimer was significantly raised (Fig. 3A, a), and quantification by measuring the peak areas showed that the amount of atRAL-dimer increased by 172% (Fig. 3A, b). UPLC/APCI-MS analysis of the 430/290-nm adduct from primary pRPE cells cultured with 80 μm atRAL for 6 h in positive ion mode disclosed an m/z peak at 551.5 (MH+) (Fig. 3A, c) that was compatible with that of atRAL-dimer (theoretically, m/z 551.4, MH+). Taken together, these results demonstrated that the 430/290-nm pigment of interest in the extract of atRAL-treated primary pRPE cells was atRAL-dimer. As expected, when chloroform/methanol extracts of primary pRPE cells fed with atRAL for 6 h were evaluated by reverse-phase HPLC, the amount of atRAL-dimer was increased with the increase in atRAL concentration (Fig. 3B). Moreover, HPLC analysis of chloroform/methanol extracts of primary pRPE cells treated with 40 μm atRAL demonstrated that there was a time-dependent elevation from 2 h to 12 h, but no more increase at 24 h, in the quantity of atRAL-dimer (Fig. 3C).
Figure 2.

Characterization of primary pRPE cells. A, light microscopic image of primary pRPE cells after being cultured for 3 days. Scale bar = 50 μm. B and C, immunofluorescence staining of the tight junction protein ZO-1 (green) and RPE-specific marker RPE65 (red) in cultured primary pRPE cells. Nuclei were stained blue with 4′,6-diamidino-2-phenylindole (DAPI). Scale bars = 50 μm. D, Western blot analysis of RPE65 in lysates of primary pRPE cells. The arrow indicates the RPE65-specific band. E, detection of RPE65 activity in primary pRPE cells. Top panel, a reverse-phase HPLC profile (dC18 column, 325-nm monitoring) of chloroform/methanol extract of primary pRPE cells cocultured with atROL for 12 h. The chromatogram was expanded between 20 and 25 min for detection of 11-cis-ROL. Insets, UV-visible absorbance spectra of 11-cis-ROL and atROL. Bottom panel, an overlay of HPLC chromatograms (dC18 column, 325-nm monitoring) generated from moderate concentrations of 11-cis-ROL (blue) and atROL (red). Insets, UV-visible absorbance spectra of 11-cis-ROL and atROL.
Figure 3.

Formation of atRAL-dimer in atRAL-treated primary pRPE cells. A, an overlay of typical HPLC chromatograms (dC18 column, 430-nm monitoring) generated with extracts of primary pRPE cells treated and untreated with 80 μm atRAL for 6 h as well as a moderate amount of synthetic atRAL-dimer. Left insets, UV-visible absorbance spectra of atRAL and atRAL-dimer peak fractions isolated from the extract of primary pRPE cells treated with 80 μm atRAL for 6 h. Right insets, corroboration of atRAL-dimer by a method of co-injection and UPLC/APCI-MS. Panel a, after primary pRPE cells were treated with 80 μm atRAL for 6 h, the HPLC profile (dC18 column, 430-nm monitoring) obtained from half of the extract of pRPE cells was overlaid with the chromatogram (dC18 column, 430-nm monitoring) that was generated when the injectant was the second half of the cell extract and 20 pmol of synthetic atRAL-dimer. Panel b, the level of atRAL-dimer in primary pRPE cells fed with 80 μm atRAL was measured before and after addition of synthesized atRAL-dimer. The integrated peak areas (microvolts per second) were determined by Empower version 3 software. mAU, milliabsorbance unit. Panel c, mass spectrum of the atRAL-dimer peak from primary pRPE cells exposed to 80 μm atRAL for 6 h with the APCI source operated in positive ion mode. atRAL-dimer has a mass of 550.86. B, quantification of atRAL-dimer formed in primary pRPE cells after 6 h of incubation with 0, 20, 40, and 80 μm atRAL. Each value represents mean ± S.D. (n = 3). C, the levels of atRAL-dimer 0, 2, 4, 8, 12, and 24 h after treatment of primary pRPE cells with 40 μm atRAL were measured. Each value represents mean ± S.D. (n = 3).
Cytotoxicity of atRAL and atRAL-dimer in primary pRPE cells
The health of primary pRPE cells exposed to atRAL or atRAL-dimer was examined. The cell toxicity of atRAL was tested by crystal violet staining assay after 6 h to 5 days of atRAL treatment. As depicted in Fig. 4, atRAL induced loss of cell viability in a concentration-dependent manner. In the presence of 20 μm atRAL, there was a slight but not significant decrease in cell viability within 3 days, whereas cell viability loss was found to be statistically significant when the incubation period was extended to 5 days. Cell viability loss caused by 40 μm of atRAL was clearly detected after 6 h, 24 h, and 5 days of incubation, although cell viability was slightly but not significantly decreased after incubation for 3 days. When the concentration of atRAL was increased to 80 μm, significant loss of cell viability was observed after incubation for 6 h, 24 h, 3 days, and 5 days, and cell viability in all cases decreased by ∼50%.
Figure 4.
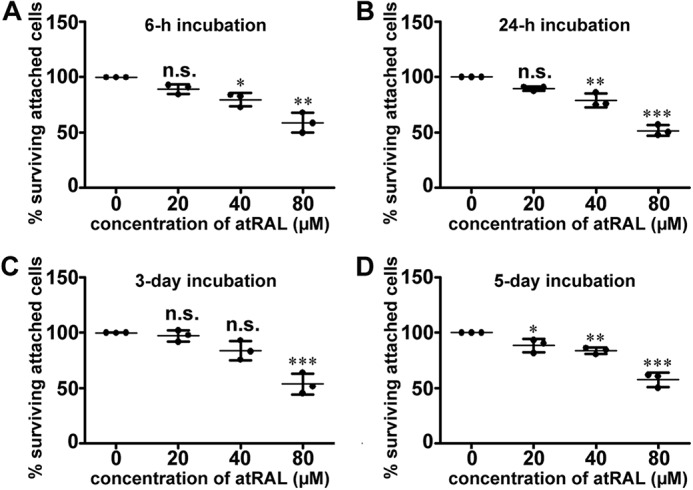
Cytotoxicity of atRAL for primary pRPE cells. A–D, cell viability 6 h (A), 24 h (B), 3 days (C), and 5 days (D) after uptake of atRAL was evaluated by using the crystal violet assay. Each value is expressed as mean ± S.D. of three independent experiments. n.s., not significant; *, p < 0.05; **, p < 0.01; ***, p < 0.001 versus controls.
Based on the autofluorescent nature of atRAL-dimer, primary pRPE cells treated with this adduct for 3 days manifested autofluorescence, viewed by confocal laser-scanning fluorescence microscopy. Confocal imaging in the horizontal plane confirmed that exogenously delivered atRAL-dimer was internalized by primary pRPE cells in culture (Fig. 5A). Alternatively, cellular uptake was verified by analysis of intracellular granules after incubation of primary pRPE cells with atRAL-dimer for 3 days (Fig. 5B). In typical HPLC chromatograms generated from extracts of primary pRPE cells receiving 20, 40, or 80 μm atRAL-dimer, a clear peak attributable to atRAL-dimer was observed that was not present in the extract of cells unexposed to atRAL-dimer, and the peak heights of atRAL-dimer increased with increasing atRAL-dimer exposure concentrations (Fig. 5B). The cytotoxicity of atRAL-dimer was assayed by MTS assay. The data revealed that atRAL-dimer did not trigger loss of cell viability at concentrations ranging from 20 to 80 μm after 6 h to 5 days of treatment (Fig. 5C).
Figure 5.
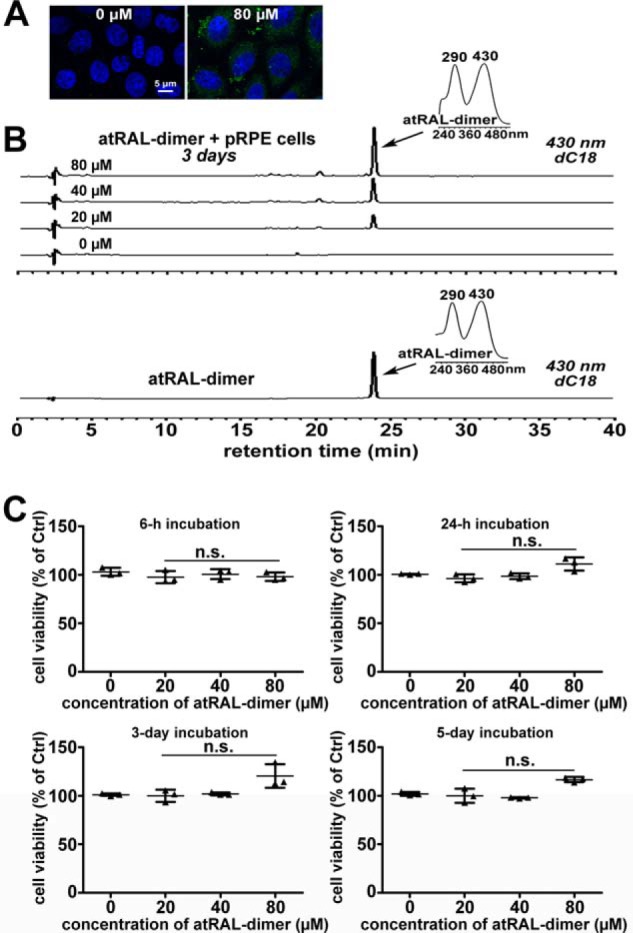
Detection of internalized atRAL-dimer and atRAL-dimer cytotoxicity for primary pRPE cells. A and B, internalized atRAL-dimer was detected by confocal laser-scanning fluorescence microscopy and HPLC. Primary pRPE cells were left untreated and incubated with 80 μm atRAL-dimer for 3 days. Then cells were fixed, and nuclei were stained with 4′,6-diamidino-2-phenylindole (blue). Internalized atRAL-dimer granules exhibit green autofluorescence at excitation/emission of 488/505 to 550 nm, and perinuclear distribution of this adduct is evident. Also shown is HPLC analysis of methanolic chloroform extracts from primary pRPE cells laden with 0, 20, 40, and 80 μm atRAL-dimer for 3 days and control atRAL-dimer. Right insets, UV-visible absorbance spectra of atRAL-dimer. C, cell viability 6 h, 24 h, 3 days, and 5 days after introduction of atRAL-dimer was probed by MTS assay. n.s., not significant compared with controls.
Phototoxicity of atRAL and atRAL-dimer in primary pRPE cells
The health of primary pRPE cells cultured with 0, 20, 40, and 80 μm of atRAL-dimer for 6 h, 24 h, 3 days, and 5 days was examined in the presence of 220 or 10,000 lx of LED light illumination. By using a light meter (HCJYET, Guangzhou, China), we found that 220 lx was close to the intensity of room light, and 10,000 lx was close to the average intensity of midday sunlight. The cell toxicity of atRAL-dimer 6 and 24 h after 5-min irradiation by LED light was evaluated by the MTS assay. Loss of cell viability was not detected in all cases with light exposure (Fig. 6). To further understand the role of the conversion of atRAL into atRAL-dimer, the cytotoxic activities of these two compounds, 6 h after exposure to LED light (220 or 10,000 lx) for 5 min, were compared by crystal violet staining assay (Fig. 7). As expected, atRAL-dimer at concentrations of 20 and 80 μm did not alter the morphology of primary pRPE cells (Fig. 7, A and B) and induced the decline of cell viability in the presence or absence of light irradiation (Fig. 7, E and F). In the case of atRAL, although morphologic changes of primary pRPE cells and decrease of cell viability were not detected at 20 μm, they were both observed at a higher concentration (80 μm) with or without light illumination (Fig. 7, A–D). Moreover, we noted that cell viability loss was not significantly aggravated by light irradiation when atRAL accumulated in primary pRPE cells (Fig. 7).
Figure 6.

Cell viability of primary pRPE cells laden with atRAL-dimer after exposure to 220 lx and 10,000 lx of LED light. A and B, primary pRPE cells cultured with 0, 20, 40, and 80 μm atRAL-dimer for 6 h, 24 h, 3 days, and 5 days were illuminated by 220 lx (A) and 10,000 lx (B) of light for 5 min, respectively. Following 6 and 24 h of incubation, cell viability was detected by MTS assay. Data are expressed as mean ± S.D. of results of three independent experiments. Ctrl, control.
Figure 7.

Determination of the cytomorphology and cytotoxicity of primary pRPE cells accumulating atRAL or atRAL-dimer after light exposure by crystal violet staining assay. A and B, typical photomicrographs of primary pRPE cells containing atRAL or atRAL-dimer before and after light irradiation. Primary pRPE cells cultured with 20 and 80 μm atRAL or atRAL-dimer for 6 h were exposed or unexposed to 220 lx (A) and 10,000 lx (B) of LED light for 5 min. After another 6 h of incubation, cells were stained with 0.05% crystal violet for 30 min and imaged with an inverted phase-contrast microscope. Ctrl, control. C–F, primary pRPE cells treated with 20 and 80 μm atRAL (C and D) or atRAL-dimer (E and F) for 6 h were illuminated by 220 lx (C and E) and 10,000 lx (D and F) of LED light for 5 min or left unilluminated. After another 6 h of incubation, cell viability was probed using the crystal violet assay. Data are expressed as mean ± S.D. of three independent experiments.
Detection of RPE/choroid–atRAL-dimer, neural retina–atRAL-dimer, and ROS–atRAL-dimer
To investigate the sites where atRAL-dimer formed, we analyzed reaction mixtures of atRAL with porcine RPE/choroid, neural retina, or ROS by reverse-phase HPLC. As shown in Fig. 8, atRAL-dimer was significantly generated in these tissues, as judged by HPLC retention time, UV-visible absorbance spectra, and UPLC/APCI-MS, corroborating the formation of atRAL-dimer in both ROS and RPE cells when the clearance of atRAL in the visual (retinoid) cycle was disrupted. Incubation of RPE/choroid with atRAL from 6 to 24 h resulted in a slight increase in the quantity of atRAL-dimer (Fig. 8A, right inset). Moreover, we found that A2E was present in methanolic chloroform extract of RPE/choroid (Fig. 8A) or neural retina (Fig. 8B) but was not detected in the ROS extract (Fig. 8C).
Figure 8.

Chromatographic detection of atRAL-dimer. A, reaction mixture of RPE/choroid with 80 μm atRAL; 6-h room temperature incubation. Top insets, UV-visible absorbance spectra of atRAL, A2E, and atRAL-dimer. Center inset, APCI-MS spectrum of RPE/choroid–atRAL-dimer operated in positive ion mode. Right inset, quantification of RPE/choroid–atRAL-dimer when RPE/choroid was incubated with atRAL for 6 and 24 h. B, reaction mixture of neural retina with 80 μm atRAL; 6-h room temperature incubation. Top insets, UV-visible absorbance spectra of atRAL, A2E, and atRAL-dimer. C, reaction mixture of ROS with 80 μm atRAL; 6-h room temperature incubation. Top insets, UV-visible absorbance spectra of atRAL and atRAL-dimer. D, an overlay of typical HPLC chromatograms (dC18 column, 430 nm monitoring) generated from a moderate amount of atRAL or synthetic A2E and atRAL-dimer. Top insets, UV-visible absorbance spectra of atRAL, A2E, and atRAL-dimer. The constituents of tissue extracts were analyzed by reverse-phase HPLC on the dC18 column by monitoring of UV-visible absorbance at 430 nm. Porcine RPE/choroid, neural retina, or ROS alone served as controls. mAU, milliabsorbance units.
Photosensitive comparison of atRAL-dimer with atRAL and A2E
Now that atRAL-dimer was produced by atRAL in primary pRPE cells (Fig. 3), light sensitivity comparison of atRAL-dimer with atRAL and A2E, a major bisretinoid constituent of RPE lipofuscin, aroused our interest, and was carried out with LED light (λ = 450–630 nm). After exposure to two different light intensities (220 and 10,000 lx), the amounts of atRAL, atRAL-dimer, and A2E all declined in a time-dependent manner (Fig. 9). Under the illumination of 220 lx of LED light, the decrease in the levels of atRAL-dimer showed a similar tendency from 0.5 to 2 min but was significantly greater at 5 min versus atRAL and A2E (Fig. 9, A–C). By contrast, when irradiated with 10,000 lx of LED light, there was a more rapid reduction in the levels of atRAL-dimer from 0.5 to 5 min compared with that of atRAL and A2E, and almost complete elimination of atRAL-dimer was observed at 5 min (Fig. 9, D–F). The results revealed a strong susceptibility of atRAL-dimer to light, whereas A2E was relatively resistant to photodamage.
Figure 9.

Photosensitivity of atRAL, atRAL-dimer and A2E. A–F, solutions of atRAL (A and D), atRAL-dimer (B and E), or A2E (C and F) in culture medium (200 μm) with 2% DMSO were irradiated by LED light (220 and 10,000 lx) for 0.5, 1, 2, and 5 min and analyzed using reverse-phase HPLC. Scatterplots display the area percentage of atRAL, A2E, or atRAL-dimer in control samples that were not exposed to LED light. Integrated peak areas (microvolts per second) were calculated using Empower version 3 software. Each value is expressed as mean ± S.D. of three independent experiments. n.s., not significant; *, p < 0.05; **, p < 0.01; ***, p < 0.001 compared with controls.
APCI-MS analysis of photocleavage products of atRAL-dimer
To ascertain the modification of atRAL-dimer after light exposure, solutions of it in water (200 μm) containing 2% DMSO for solubility purposes were irradiated for 5 min via LED light and analyzed by MS using the APCI source operating in positive ion mode. The results confirmed that 10,000 lx of light irradiation of atRAL-dimer underwent photocleavage in the same fashion as exposure of it to 220 lx of light and gave rise to three prominent low-mass peaks (m/z 335, 365, and 391; MH+) corresponding to light-induced cleavage products of atRAL-dimer (m/z 551, MH+) (Fig. 10A). Furthermore, several other low-molecular-weight species were also observed.
Figure 10.

Photodegradation of atRAL-dimer. A, by using MS with an APCI source operated in positive ion mode, irradiation of 200 μm of atRAL-dimer (m/z 551, MH+) in water with 2% DMSO with 220 lx and 10,000 lx of LED light for 5 min produced lower mass peaks corresponding to atRAL-dimer photodegradation products and gave rise to three prominent ion peaks at m/z 335, 365, and 391, MH+. B–D, APCI-MS2/MS3 spectra and proposed structures of photocleavage products of atRAL-dimer. Product MS2/MS3 ion spectra of MH+ ions at m/z 335 (B), 365 (C), and 391 (D). Also shown are proposed structures of MS2 cleavage products corresponding to MH+ ions at m/z 147 from 335 (B, bottom inset), m/z 175 from 365 (C, bottom inset), and m/z 149 from 391 (D, bottom inset). E, proposed structures of the largest of atRAL-dimer photodegradation products (m/z 335, 365, and 391, MH+) and the photochemical mechanism proposed for their formation.
Characterization of atRAL-dimer photocleavage products by tandem MS
To structurally characterize three photoinduced cleavage products identified by APCI-MS (m/z 335, 365, and 391; MH+), tandem mass spectrometric analysis (MS2 and MS3) was performed in APCI positive ion mode (Fig. 10, B–D). The MS2/MS3 fragmentation processes leading to structural assignments for the photocleavage products corresponding to the precursor molecular ions (Fig. 10, B–D, insets) involved eliminations, rearrangements, and bond cleavages; these MS2 and MS3 mechanisms are shown in Figs. S1–S3 and are described in the supporting Results.
Discussion
The Abca4 gene encodes the transporter of all-trans NR-PE, the atRAL/PE condensation product serving as an essential intermediate of the visual (retinoid) cycle, from the inside to the outside of ROS disc membranes (1, 24, 25). The Rdh8 gene encodes one of the main enzymes that reduces atRAL in the ROS (1, 11). Because of the critical role of ABCA4 and RDH8 in the clearance of atRAL, deficiencies in these two proteins will result in excess buildup of atRAL, all-trans NR-PE, and atRAL condensation products in the ROS disk lumen (1). Daily phagocytosis of shed ROS by RPE cells translocates these compounds into the RPE through the c-merprotooncogene receptor tyrosine kinase (MERTK)-mediated signaling pathway (1). In the eyes of Rdh8−/−Abca4−/− mice, a mouse model with defects in the visual (retinoid) cycle that displays some symbolic characteristics of Stargardt disease and age-related macular degeneration, the amount of atRAL-dimer significantly increases compared with WT mice (23) and is even much more than that of A2E (22); this phenomenon highly concerned us. Most recently, by using the immortalized adult RPE cell line ARPE-19, we reported that the formation of atRAL-dimer alleviates the cytotoxicity of atRAL by reducing oxidative stress (16). Only when accumulated beyond a threshold can atRAL-dimer induce DNA damage and mitochondrion-associated apoptosis in ARPE-19 cells as well as inhibition of cellular proliferation (22). Obviously, these findings support that the conversion of free atRAL to atRAL-dimer is likely a detoxification process at the start.
Given that the human RPE cell line ARPE-19 does not represent all properties of the RPE, and the tight junction in cultured ARPE-19 cells is weaker versus that of primary RPE cells, we isolated primary RPE cells from porcine eyes, followed by the use of them in this study. Indeed, cultures of primary pRPE cells were more resistant to the toxicity of atRAL and atRAL-dimer compared with APRE-19 cells (Figs. 4 and 5) (16, 22). Cell-based assays showed that atRAL-dimer, different from atRAL, was not cytotoxic and phototoxic to primary pRPE cells at a concentration of 80 μm (Figs. 4–7), suggesting that atRAL-dimer and the light-mediated fragmentation of it were relatively innocuous. The atRAL-dimer intake of primary pRPE cells was examined by reverse-phase HPLC after primary pRPE cells were incubated with 80 μm atRAL-dimer for 6 h to 5 days. The result showed that the level of internalized atRAL-dimer increased with extension of the incubation time and reached 19.7% of total atRAL-dimer at 5 days. Accordingly, the difficulty to observe toxicity toward primary pRPE cells may be due to the insufficient uptake of atRAL-dimer. However, because the concentrations of atRAL-dimer adopted in these experiments are likely far beyond what is expected in vivo, we conclude that the amount of atRAL-dimer entering pRPE cells should be at least comparable with the endogenous levels. The fact that atRAL-dimer did not produce any obvious toxicity regardless of light exposure (Figs. 5–7) further supports our claim that the initial formation of atRAL-dimer is an antidotal process for aberrant accumulation of atRAL. In addition, primary pRPE cells exposed to 80 μm atRAL-dimer for 5 days were irradiated for 5 min with 220 or 10,000 lx of LED light. After an additional 6 and 24 h of incubation, the amounts of intracellular atRAL-dimer were also measured by reverse-phase HPLC and found to decrease by 55% and 77%, respectively, under 220 lx of light irradiation and by 98% in both cases under 10,000 lx of light. APCI-MS analysis of the atRAL-dimer solution irradiated by light in positive ion mode yielded three prominent ions at m/z 335, 365, and 391 (MH+), corresponding to photocleavage products of atRAL-dimer (Fig. 10A). The structures of these atRAL-dimer photocleavage products are shown in Fig. 10E and were further corroborated by MS2 and MS3 (Fig. 10, B–D; Figs. S1–S3). The photochemical mechanisms proposed for the generation of m/z 335, 365, and 391 (MH+) photocleavage products released from the illumination of atRAL-dimer (m/z 551, MH+) are presented in Fig. 10E. Light-induced dissociation of C12′–C13′/C12-C13 single bond and transfer of a hydrogen atom from C16/C14 to C12′/C12 gives rise to two m/z 335 (MH+) photocleavage products. An atRAL-dimer molecule undergoes peroxide formation at four sites (C11′–C12′/C11-C12/C9′–C10′/C9-C10 double bond) on two arms. The O-O bond photocleavage, along with light-triggered cleavage of C11′–C12′/C11-C12 single bond generates a pair of m/z 365 (MH+) photocleavage products. Formation of two m/z 391 (MH+) photocleavage products results from photoinduced dissociation of C9′–C10′/C9-C10 single bond as well as light-induced cleavage of the O-O bond.
In primary pRPE cells after exposure to atRAL, atRAL-dimer forms easily, but A2E was scarcely detected (Fig. 3), implying that A2E may be unlikely to form directly in the RPE. A plausible explanation for the phenomenon is that A2E biosynthesis involves the formation of A2PE, the precursor of A2E, in the ROS (26). atRAL-dimer was highly susceptible to light (Fig. 9), explaining why it is observed at a very low level or not detected in the eyes of WT mice as well as neural retina and RPE/choroid dissected from pigs, cows, and humans (Fig. 8) (16, 17, 27). The finding that atRAL-dimer was significantly generated in reaction mixtures of atRAL with RPE/choroid or ROS from porcine eyes (Fig. 8) revealed that the formation of atRAL-dimer likely occurred in both ROS and RPE cells. It should be noted that only a portion of atRAL-dimer in the ROS could perhaps enter into RPE cells because we cannot exclude the possibility that light directly breaks ROS–atRAL-dimer into pieces. Moreover, ROS–atRAL-dimer photocleavage products possibly suffer further light-induced cleavage in the RPE. Because the reaction of atRAL with PE to produce all-trans NR-PE is readily reversible in vivo (28), the source of atRAL in RPE cells may include both free atRAL and all-trans NR-PE from the ROS.
Collectively, we proposed an alternative metabolic/antidotal pathway of atRAL in RPE cells (Fig. 11) when atRAL clearance in the visual (retinoid) cycle is disrupted. Overproduced atRAL induces the generation of atRAL-dimer in both ROS and RPE. Phagocytosis of shed ROS by RPE cells on a daily basis translocates atRAL, all-trans NR-PE, atRAL-dimer, and photocleavage products of atRAL-dimer in the ROS into the RPE. Decomposition of all-trans NR-PE serves as an additional source of atRAL in the RPE. Fragmentation of atRAL-dimer by light does not provoke damage to RPE cells and generates low-molecular-weight photoinduced cleavage products. The latter may readily pass through membranes to enter the intercellular matrix, thereby being metabolically eliminated. Compounds that favor the conversion of free atRAL into atRAL-dimer may benefit the therapy of macular degeneration caused by disrupted clearance of atRAL.
Figure 11.

Proposed alternative metabolic/antidotal pathway of atRAL in the retina. In the visual (retinoid) cycle, after light exposure, atRAL is released from rhodopsin into the cytoplasm of photoreceptor cells. Subsequently, atRAL is reduced into atROL (also called vitamin A) and transported from ROS into RPE cells with the help of IRBP. Next, all-trans-retinyl ester is generated by lecithin:retinol acyltransferase (LRAT)-mediated esterification of atROL and then undergoes isomerization to produce 11-cis-ROL with the action of RPE65. RDH5 oxidizes 11-cis-ROL into 11-cis-RAL, which is transported back into the ROS and binds to free opsin to regenerate fresh rhodopsin. However, when clearance of atRAL in the visual (retinoid) cycle is disrupted, atRAL is overaccumulated and causes toxicity to both photoreceptor and RPE cells. Accordingly, we propose an alternative detoxification module or metabolic pathway of atRAL in the retina. Excess atRAL provokes the formation of atRAL-dimer in both ROS and RPE in an undefined manner. Phagocytosis of shed ROS by RPE cells on a daily basis translocates atRAL, all-trans–NR-PE, atRAL-dimer, and photocleavage products of atRAL-dimer resident in the ROS into the RPE. It should be mentioned that an additional source of atRAL in the RPE is all-trans–NR-PE decomposition. Light-mediated fragmentation of atRAL-dimer does not cause damage to RPE cells and produces low-molecular-weight cleavage products that may readily pass through membranes to enter the intercellular matrix, thereby being metabolically eliminated.
Experimental procedures
Materials
atRAL and atROL were purchased from Sigma-Aldrich. 11-cis-ROL was obtained from Toronto Research Chemicals (Toronto, ON, Canada). atRAL-dimer and A2E were synthesized as published previously (14, 29).
Primary pRPE cell culture
Porcine eyes were dissected under sterile conditions. The cornea, lens and neural retina were discarded, and the eyecups were incubated with 0.25% trypsin-EDTA (Life Technologies) for 25 min at 37 °C in a humidified 5% CO2 atmosphere. pRPE cells were harvested by gentle aspiration. Following the neutralization of trypsin, the cell suspension was centrifuged and resuspended in DMEM-F12 (Life Technologies) containing 10% fetal bovine serum (HyClone, Beijing, China) and 1× N1 supplement (Sigma-Aldrich, St. Louis, MO). The single-cell suspension was seeded into cell culture plates and incubated at 37 °C in 5% CO2. When most of the cells were attached after 24 h, the culture medium was changed. After 7 days, primary pRPE cells reached confluency and exhibited a hexagonal, binucleated, pigmented, and epithelioid morphology. Experiments with animals were performed in accordance with protocols approved by the Institutional Animal Care and Use Committee of Xiamen University and adherent to the Association for Research in Vision and Ophthalmology (ARVO) Statement for the Use of Animals in Ophthalmic and Vision Research.
Identity analysis of primary pRPE cells
Primary pRPE cells were fixed with 4% paraformaldehyde, permeabilized in PBS containing 0.2% Triton X-100, blocked in PBS with 2% BSA, and incubated overnight at 4 °C with a primary antibody against ZO-1 (Thermo Fisher Scientific, Rockford, IL) or RPE65 (Novus Biologicals, Littleton, CO), followed by an Alexa Fluor–conjugated secondary antibody (Thermo Fisher Scientific). Images were acquired with a DM2500 microscope (Leica, Wetzlar, Germany). Primary pRPE cells were lysed with radioimmune precipitation assay buffer (Sigma-Aldrich) containing a protease and phosphatase inhibitor mixture (Thermo Fisher Scientific). Protein concentrations were determined with the BCA protein assay kit (Thermo Fisher Scientific). Twenty micrograms of protein in each sample was subjected to SDS-PAGE, and the gels were transferred to a polyvinylidene difluoride membrane (Roche, Mannheim, Germany) by electroblotting. The polyvinylidene difluoride membrane was incubated with a primary antibody against RPE65 (Proteintech, Wuhan, Hubei, China; catalog no. 17939-1-AP) overnight at 4 °C, followed by HRP-conjugated goat anti-mouse IgG (H+L) secondary antibody (Thermo Fisher Scientific) for 1 h at room temperature. Finally, the protein band was visualized with a ChemiDoc XRS+ imaging system (Bio-Rad) with the use of ECL Western blotting detection reagents (Advansta, Menlo Park, CA).
Cell treatments and HPLC analysis
Primary pRPE cells were treated with serial concentrations of atRAL (0, 20, 40, and 80 μm) for 6 h or with 40 μm atRAL for the indicated time periods (0, 2, 4, 8, 12, and 24 h) and then harvested. Incubation of primary pRPE cells with 80 μm atRAL-dimer was performed for 6 h, 24 h, 3 days, and 5 days. Primary pRPE cells were cultured with 80 μm atRAL-dimer for 5 days. After washing the cells with PBS, the 96-well plates were illuminated by the LED light (220 and 10,000 lx) for 5 min at room temperature and incubated for an additional 6 and 24 h. Cell lysates were extracted with 50% methanolic chloroform. After centrifugation at 3000 × g for 5 min, the organic layer was filtered through the cotton and collected in a 10 × 100 mm glass tube. Extraction was repeated with chloroform three times. The extracting solution was combined and placed into a 25-ml round-bottom flask, and organic solvents were removed by a rotary evaporator. By using 50% methanolic chloroform, residues were transferred into a 0.5-ml centrifuge tube and dried under argon gas. Finally, the resulting extract was redissolved in 100 μl of 50% methanolic chloroform and injected into reverse-phase HPLC using an Alliance System (Waters Corp., Milford, MA) equipped with a 2695 separation module, a 2998 photodiode array detector, and a 2475 multichannel (λ) fluorescence detector. A waters Atlantis® dC18 reverse-phase column (3 μm, 4.6 × 150 mm), operating at 35 °C, was used for the stationary phase. Compounds were eluted with a gradient mobile phase consisting of acetonitrile and water in the presence of 0.1% TFA: 85–100% acetonitrile, 0.8 ml/min, 15 min; 100% acetonitrile, 0.8–1.2 ml/min, 15–20 min; 100% acetonitrile, 1.2 ml/min, 20–40 min. The peak area (microvolts per second; 1 mV/s = 1000 μV/s) was integrated using Empower version 3 software. Photodiode array detection was set at 430 nm.
Detection of 11-cis-ROL
Primary pRPE cells were incubated with 50 μm of atROL in DMEM-F12 with 1% BSA for 12 h. Then cells were completely washed with PBS and harvested. Cell extracts were analyzed by HPLC. For compound elution, the dC18 column was used for the stationary phase, and for the mobile phase, a gradient of acetonitrile in water with 0.1% TFA was used: 75–90% acetonitrile (0–30 min) and 90–100% acetonitrile (30–40 min) with a flow rate of 0.5 ml/min. The photodiode array detector was set at 325 nm for eluent monitoring.
MTS assay
Primary pRPE cells were grown in the dark for 10 days in growth medium (DMEM-F12 supplemented with 5% fetal bovine serum, 1% penicillin/streptomycin, and 1× N1 supplement). Then growth medium was completely replaced with DMEM-F12 containing 0, 20, 40, and 80 μm atRAL-dimer, followed by 6 h, 24 h, 3 days, or 5 days of incubation. After these treatments, the 96-well plates were illuminated by 220 lx and 10,000 lx light delivered by a self-designed and manufactured LED-based system (λ = 450–630 nm) for 5 min at room temperature after washing the cells with PBS and incubated for an additional 6 and 24 h. Cell viability was evaluated using an MTS assay. The MTS assay was performed by adding 20 μl of CellTiter 96® AQueous One Solution reagent (Promega, Madison, WI) directly to 96-well plates, incubating for 1 h, and then recording the absorbance at 490 nm using a 1510 Multiskan GO spectrophotometer (Thermo Fisher Scientific, Vantaa, Finland).
Crystal violet staining assay
Primary pRPE cells were cocultured with 0, 20, 40, and 80 μm atRAL for 6 h, 24 h, 3 days, or 5 days. Alternatively, primary pRPE cells were incubated with 0, 20, and 80 μm of atRAL or atRAL-dimer in DMEM-F12 for 6 h. After the cells were completely washed by PBS, the 96-well plates were illuminated by the LED light (220 and 10,000 lx) for 5 min at room temperature, followed by incubation for an additional 6 h. Cell toxicity was evaluated using a crystal violet assay. The crystal violet assay was performed by fixing the cells with 4% paraformaldehyde for 5 min. After being washed with water, cells were stained with 0.05% crystal violet for 30 min. The plates were washed with water twice and dried overnight, and the cells were photographed under a CKX3-SLP inverted microscope (Olympus, Tokyo, Japan). Finally, 100 μl of methanol was added to each well to solubilize the dye, and then we record the absorbance at 540 nm with the spectrophotometer.
Detection of photosensitivity
Solutions of atRAL, atRAL-dimer, or A2E in culture medium (200 μm) containing 2% DMSO were exposed to the LED light (220 and 10,000 lx) for 0, 0.5, 1, 2, and 5 min. A portion of the resulting samples (20 μl) was subjected to HPLC as described above. The integrated peak area (microvolts per second) was determined by Empower version 3 software. Detection by photodiode array was monitored at 380 nm for atRAL and 430 nm for A2E and atRAL-dimer.
Porcine ROS isolation
Porcine ROS was isolated according to the method published by Parinot et al. (30). All operations were performed under dim red light. Neural retinas dissected from 40 porcine eyeballs were collected and placed in 15 ml of homogenizing buffer containing 20% sucrose (w/v), 20 mm Tris acetate (pH 7.2), 2 mm MgCl2, 10 mm glucose, and 5 mm taurine. After shaking the retinas vigorously for 2 min, the suspension was filtered through double-layered clean gauze three times to remove large fragments. The crude retina preparation was gently placed on top of a prechilled 25∼60% sucrose gradient and ultracentrifuged at 106,000 × g for 50 min at 4 °C. The orange-pink ROS band was collected, diluted with 4∼5 volumes of ice-cold wash 1 buffer (20 mm Tris acetate (pH 7.2) and 5 mm taurine), and then centrifuged at 3000 × g for 10 min at 4 °C. The pellets were sequentially washed with 10 ml of wash 2 buffer (10% sucrose, 20 mm Tris acetate (pH 7.2), and 5 mm taurine) and 15 ml of wash 3 buffer (10% sucrose, 20 mm sodium phosphate (pH 7.2), and 5 mm taurine). Finally, ROS was diluted in 5 ml of DMEM with 2.5% sucrose and stored at −80 °C.
Reaction of atRAL with RPE/choroid, neural retina, or ROS
Following an initial incision made in the corneal limbus of porcine eyes, the cornea–iris complex was carefully cut off 4–5 mm posterior to the corneal limbus, and the lens and vitreous body were removed. Neural retina adjacent to the RPE/choroid layer was first isolated by using sterile tweezers. For the remaining eyecup to lay flat, it was dissected into four quadrants. After washing with PBS, neural retina (one eye/sample) and RPE/choroid (one eye/sample) firmly attached to the sclera were cultured with 80 μm atRAL for 6 h or 24 h, respectively. Next, the tissues were completely washed with PBS. The RPE/choroid layer was peeled off from the sclera using forceps. Porcine ROS was incubated with 80 μm atRAL for 6 h. Finally, extracts of RPE/choroid, neural retina, or ROS were obtained and analyzed by HPLC. For elution from the dC18 column, the following gradient of acetonitrile in water with 0.1% TFA was utilized: 0–15 min, 85–100% acetonitrile, 0.8 ml/min; 15–20 min, 100% acetonitrile, 0.8–1.2 ml/min; 20–40 min, 100% acetonitrile, 1.2 ml/min. Photodiode array detection was set at 430 nm. The peak area (microvolts per second) was determined using Empower version 3 software. Molar quantity was calculated using a calibration curve constructed from known concentrations of synthesized standard.
UPLC/APCI-MS
Ultraperformance LC (UPLC)–MS was performed using an AB Sciex Qtrap 6500+ mass spectrometer coupled on-line to a Waters Acquity UPLC I-Class. The mass spectrometer was equipped with an atmospheric pressure chemical ionization (APCI) interface and ion trap analyzer operating in full scan mode from m/z 50–2000. The same dC18 column and mobile phase were used as described above for HPLC. Mass spectra were achieved using atmospheric pressure chemical ionization in positive ion mode. Analyst software was used for data acquisition and instrument control.
APCI-MS/MS2/MS3 analysis of atRAL-dimer irradiated by LED light
A solution of atRAL-dimer (200 μm in water with 2% DMSO) was irradiated with LED light (220 and 10,000 lx) for 5 min or left unirradiated and dried under argon. The resulting samples were redissolved in methanol, ionized by APCI, and analyzed using the AB Sciex Qtrap 6500+ MS instrument supplied by the Analyst software. MS detection was carried out in positive ion mode or in MS2 and MS3 modes.
Statistical analysis
All experiments were independently repeated three times. Data were analyzed by one-way or two-way analysis of variance, followed by Bonferroni post-test for multiple comparisons (Prism 5.0; GraphPad Software, La Jolla, CA) and expressed as mean ± S.D. A p value of less than 0.05 was accepted as significant.
Author contributions
Z. G., Y. L., C. C., C. L., D. H., and Y. W. formal analysis; Z. G., Y. L., C. C., C. L., D. H., and Y. W. investigation; Y. L. and Y. W. funding acquisition; J. C. and Y. W. data curation; J. M., Z. L., and Y. W. writing-review and editing; Y. W. conceptualization; Y. W. supervision; Y. W. methodology; Y. W. writing-original draft; Y. W. project administration.
Supplementary Material
This work was supported in part by grants from the China National Natural Science Foundation (81570857 to Y. W. and 81700864 to Y. L.), the Sanming Project of Medicine in Shenzhen (SZSM201612022 to Z. L. and Y. W.), the Fundamental Research Funds for the Central Universities (to Y. W. and Y. L.), and the Natural Science Foundation of Fujian Province (2017J01148 to Y. W. and 2016J01412 to Y. L.) and in part by a research grant for young and mid-aged teachers of Fujian Province (JAT160011 to Y. L.). The authors declare that they have no conflicts of interest with the contents of this article.
This article contains Figs. S1–S3 and Results.
- RPE
- retinal pigment epithelium
- ROS
- rod outer segment(s)
- atRAL
- all-trans-retinal
- atROL
- all-trans-retinol
- NR-PE
- N-retinylidene–phosphatidylethanolamine
- pRPE
- porcine retinal pigment epithelium
- UPLC
- ultraperformance LC
- APCI
- atmospheric pressure chemical ionization
- MTS
- [3-(4,5-dimethylthiazol-2-yl)-5-(3-carboxymethoxyphenyl)-2-(4-sulfophenyl)-2H-tetrazolium, inner salt]
- DMEM
- Dulbecco's modified Eagle's medium
- lx
- lux
- LED
- light-emitting diode.
References
- 1. Liu X., Chen J., Liu Z., Li J., Yao K., and Wu Y. (2016) Potential therapeutic agents against retinal diseases caused by aberrant metabolism of retinoids. Invest. Ophthalmol. Vis. Sci. 57, 1017–1030 10.1167/iovs.15-18429 [DOI] [PubMed] [Google Scholar]
- 2. Fishkin N., Berova N., and Nakanishi K. (2004) Primary events in dim light vision: a chemical and spectroscopic approach toward understanding protein/chromophore interactions in rhodopsin. Chem. Rec. 4, 120–135 10.1002/tcr.20000 [DOI] [PubMed] [Google Scholar]
- 3. Travis G. H., Golczak M., Moise A. R., and Palczewski K. (2007) Diseases caused by defects in the visual cycle: retinoids as potential therapeutic agents. Annu. Rev. Pharmacol. Toxicol. 47, 469–512 10.1146/annurev.pharmtox.47.120505.105225 [DOI] [PMC free article] [PubMed] [Google Scholar]
- 4. Tang P. H., Kono M., Koutalos Y., Ablonczy Z., and Crouch R. K. (2013) New insights into retinoid metabolism and cycling within the retina. Prog. Retin. Eye Res. 32, 48–63 10.1016/j.preteyeres.2012.09.002 [DOI] [PMC free article] [PubMed] [Google Scholar]
- 5. Moiseyev G., Chen Y., Takahashi Y., Wu B. X., and Ma J. X. (2005) RPE65 is the isomerohydrolase in the retinoid visual cycle. Proc. Natl. Acad. Sci. U.S.A. 102, 12413–12418 10.1073/pnas.0503460102 [DOI] [PMC free article] [PubMed] [Google Scholar]
- 6. Wang J. S., and Kefalov V. J. (2011) The cone-specific visual cycle. Prog. Retin. Eye Res. 30, 115–128 10.1016/j.preteyeres.2010.11.001 [DOI] [PMC free article] [PubMed] [Google Scholar]
- 7. Sparrow J. R., Wu Y., Kim C. Y., and Zhou J. (2010) Phospholipid meets all-trans-retinal: the making of RPE bisretinoids. J. Lipid Res. 51, 247–261 10.1194/jlr.R000687 [DOI] [PMC free article] [PubMed] [Google Scholar]
- 8. Chen C., Jiang Y., and Koutalos Y. (2002) Dynamic behavior of rod photoreceptor disks. Biophys. J. 83, 1403–1412 10.1016/S0006-3495(02)73911-8 [DOI] [PMC free article] [PubMed] [Google Scholar]
- 9. Sullivan J. M. (2009) Focus on molecules: ABCA4 (ABCR): an import-directed photoreceptor retinoid flipase. Exp. Eye Res. 89, 602–603 10.1016/j.exer.2009.03.005 [DOI] [PMC free article] [PubMed] [Google Scholar]
- 10. Sun H., and Nathans J. (2001) Mechanistic studies of ABCR, the ABC transporter in photoreceptor outer segments responsible for autosomal recessive Stargardt disease. J. Bioenerg. Biomembr. 33, 523–530 10.1023/A:1012883306823 [DOI] [PubMed] [Google Scholar]
- 11. Rattner A., Smallwood P. M., and Nathans J. (2000) Identification and characterization of all-trans-retinol dehydrogenase from photoreceptor outer segments, the visual cycle enzyme that reduces all-trans-retinal to all-trans-retinol. J. Biol. Chem. 275, 11034–11043 10.1074/jbc.275.15.11034 [DOI] [PubMed] [Google Scholar]
- 12. Eldred G. E., and Lasky M. R. (1993) Retinal age pigments generated by self-assembling lysosomotrophic detergents. Nature 361, 724–726 10.1038/361724a0 [DOI] [PubMed] [Google Scholar]
- 13. Sakai N., Decatur J., and Nakanishi K. (1996) Ocular age pigment “A2-E”: an unprecedented pyridinium bisretinoid. J. Am. Chem. Soc. 118, 1559–1560 10.1021/ja953480g [DOI] [Google Scholar]
- 14. Fishkin N. E., Sparrow J. R., Allikmets R., and Nakanishi K. (2005) Isolation and characterization of a retinal pigment epithelial cell fluorophore: an all-trans-retinal dimer conjugate. Proc. Natl. Acad. Sci. U.S.A. 102, 7091–7096 10.1073/pnas.0501266102 [DOI] [PMC free article] [PubMed] [Google Scholar]
- 15. Wielgus A. R., Chignell C. F., Ceger P., and Roberts J. E. (2010) Comparison of A2E cytotoxicity and phototoxicity with all-trans-retinal in human retinal pigment epithelial cells. Photochem. Photobiol. 86, 781–791 10.1111/j.1751-1097.2010.00750.x [DOI] [PMC free article] [PubMed] [Google Scholar]
- 16. Li J., Zhang Y., Cai X., Xia Q., Chen J., Liao Y., Liu Z., and Wu Y. (2016) All-trans-retinal dimer formation alleviates the cytotoxicity of all-trans-retinal in human retinal pigment epithelial cells. Toxicology 371, 41–48 10.1016/j.tox.2016.10.005 [DOI] [PubMed] [Google Scholar]
- 17. Wu Y., Fishkin N. E., Pande A., Pande J., and Sparrow J. R. (2009) Novel lipofuscin bisretinoids prominent in human retina and in a model of recessive Stargardt disease. J. Biol. Chem. 284, 20155–20166 10.1074/jbc.M109.021345 [DOI] [PMC free article] [PubMed] [Google Scholar]
- 18. Feeney-Burns L., Hilderbrand E. S., and Eldridge S. (1984) Aging human RPE: morphometric analysis of macular, equatorial, and peripheral cells. Invest. Ophthalmol. Vis. Sci. 25, 195–200 [PubMed] [Google Scholar]
- 19. Okubo A., Rosa R. H. Jr., Bunce C. V., Alexander R. A., Fan J. T., Bird A. C., and Luthert P. J. (1999) The relationships of age changes in retinal pigment epithelium and Bruch's membrane. Invest. Ophthalmol. Vis. Sci. 40, 443–449 [PubMed] [Google Scholar]
- 20. von Rückmann A., Fitzke F. W., and Bird A. C. (1997) Fundus autofluorescence in age-related macular disease imaged with a laser scanning ophthalmoscope. Invest. Ophthalmol. Vis. Sci. 38, 478–486 [PubMed] [Google Scholar]
- 21. Delori F. C., Goger D. G., and Dorey C. K. (2001) Age-related accumulation and spatial distribution of lipofuscin in RPE of normal subjects. Invest. Ophthalmol. Vis. Sci. 42, 1855–1866 [PubMed] [Google Scholar]
- 22. Zhao J., Liao Y., Chen J., Dong X., Gao Z., Zhang H., Wu X., Liu Z., and Wu Y. (2017) Aberrant buildup of all-trans-retinal dimer, a nonpyridinium bisretinoid lipofuscin fluorophore, contributes to the degeneration of the retinal pigment epithelium. Invest. Ophthalmol. Vis. Sci. 58, 1063–1075 10.1167/iovs.16-20734 [DOI] [PubMed] [Google Scholar]
- 23. Maeda A., Maeda T., Golczak M., and Palczewski K. (2008) Retinopathy in mice induced by disrupted all-trans-retinal clearance. J. Biol. Chem. 283, 26684–26693 10.1074/jbc.M804505200 [DOI] [PMC free article] [PubMed] [Google Scholar]
- 24. Molday R. S., Beharry S., Ahn J., and Zhong M. (2006) Binding of N-retinylidene-PE to ABCA4 and a model for its transport across membranes. Adv. Exp. Med. Biol. 572, 465–470 10.1007/0-387-32442-9_64 [DOI] [PubMed] [Google Scholar]
- 25. Tsybovsky Y., Wang B., Quazi F., Molday R. S., and Palczewski K. (2011) Posttranslational modifications of the photoreceptor-specific ABC transporter ABCA4. Biochemistry 50, 6855–6866 10.1021/bi200774w [DOI] [PMC free article] [PubMed] [Google Scholar]
- 26. Liu J., Itagaki Y., Ben-Shabat S., Nakanishi K., and Sparrow J. R. (2000) The biosynthesis of A2E, a fluorophore of aging retina, involves the formation of the precursor, A2-PE, in the photoreceptor outer segment membrane. J. Biol. Chem. 275, 29354–29360 10.1074/jbc.M910191199 [DOI] [PubMed] [Google Scholar]
- 27. Li J., Yao K., Yu X., Dong X., Gan L., Luo C., and Wu Y. (2013) Identification of a novel lipofuscin pigment (iisoA2E) in retina and its effects in the retinal pigment epithelial cells. J. Biol. Chem. 288, 35671–35682 10.1074/jbc.M113.511386 [DOI] [PMC free article] [PubMed] [Google Scholar]
- 28. Molday R. S. (2007) ATP-binding cassette transporter ABCA4: molecular properties and role in vision and macular degeneration. J. Bioenerg. Biomembr. 39, 507–517 10.1007/s10863-007-9118-6 [DOI] [PubMed] [Google Scholar]
- 29. Parish C. A., Hashimoto M., Nakanishi K., Dillon J., and Sparrow J. (1998) Isolation and one-step preparation of A2E and iso-A2E, fluorophores from human retinal pigment epithelium. Proc. Natl. Acad. Sci. U.S.A. 95, 14609–14613 10.1073/pnas.95.25.14609 [DOI] [PMC free article] [PubMed] [Google Scholar]
- 30. Parinot C., Rieu Q., Chatagnon J., Finnemann S. C., and Nandrot E. F. (2014) Large-scale purification of porcine or bovine photoreceptor outer segments for phagocytosis assays on retinal pigment epithelial cells. J. Vis. Exp. e52100 10.3791/52100 [DOI] [PMC free article] [PubMed] [Google Scholar]
Associated Data
This section collects any data citations, data availability statements, or supplementary materials included in this article.