

Abstract
Enzalutamide, a nonsteroidal second-generation antiandrogen, has been recently approved for the management of castration-resistant prostate cancer (CRPC). Although patients can benefit from enzalutamide at the beginning of this therapy, acquired enzalutamide resistance usually occurs within a short period. This motivated us to investigate the mechanism involved and possible approaches for overcoming enzalutamide resistance in CRPC. In the present study, we found that 3-hydroxy-3-methyl-glutaryl–CoA reductase (HMGCR), a crucial enzyme in the mevalonate pathway for sterol biosynthesis, is elevated in enzalutamide-resistant prostate cancer cell lines. HMGCR knockdown could resensitize these cells to the drug, and HMGCR overexpression conferred resistance to it, suggesting that aberrant HMGCR expression is an important enzalutamide-resistance mechanism in prostate cancer cells. Furthermore, enzalutamide-resistant prostate cancer cells were more sensitive to statins, which are HMGCR inhibitors. Of note, a combination of simvastatin and enzalutamide significantly inhibited the growth of enzalutamide-resistant prostate cancer cells in vitro and tumors in vivo. Mechanistically, simvastatin decreased protein levels of the androgen receptor (AR), which was further reduced in combination with enzalutamide. We observed that the decrease in AR may occur through simvastatin-mediated inhibition of the mTOR pathway, whose activation was associated with increased HMGCR and AR expression. These results indicate that simvastatin enhances the efficacy of enzalutamide-based therapy, highlighting the therapeutic potential of statins to overcome enzalutamide resistance in CRPC.
Keywords: drug resistance, prostate cancer, cholesterol regulation, tumor therapy, hormone receptor
Introduction
Progression of prostate cancer (PCa),2 the second leading cause of cancer death in American men, is androgen-dependent. Consequently, androgen-deprivation therapy (ADT) is currently the primary approach for the treatment of PCa. Although patients can benefit from ADT at the beginning of treatment, most of them will relapse with castration-resistant prostate cancer (CRPC), which is currently incurable. Enzalutamide is a nonsteroidal second-generation antiandrogen that has recently been approved for the treatment of metastatic CRPC both in the post-docetaxel and chemotherapy-naive settings. It can inhibit androgen binding to the androgen receptor (AR), AR translocation into the nucleus, AR binding to DNA, and coactivator recruitment (1). Although enzalutamide can work efficiently at the beginning of treatment, it is only valid for a specified period, after which acquired drug resistance usually occurs. Currently, it is reported that such resistance can be induced by AR splice variants (AR-Vs), AR mutation, autophagy, aberrant glucose metabolism, intracrine androgen biosynthesis, etc. (2–7).
Increasing data suggest that activation of de novo cholesterogenesis induces PCa cell proliferation and promotes cancer development and progression (8–10). Men with a higher level of cholesterol are usually at greater risk of developing high-grade PCa. During cholesterol biosynthesis, 3-hydroxy-3-methyl-glutaryl–CoA reductase (HMGCR) is the first rate-limiting enzyme, whose inhibition has been traditionally used to lower serum cholesterol as a means of reducing the risk for cardiovascular disease. Drugs that inhibit HMGCR, known collectively as statins, are generic drugs for the treatment of hypercholesterolemia. In addition to statins' efficacy on treating cardiovascular disease, accumulating evidence suggests that statins also exert an antineoplastic effect in many types of cancer, including breast, prostate, ovarian, lymphoma, renal cell carcinoma, and colorectal cancer (11). In PCa, both in vitro and in vivo experiments showed that statins could significantly reduce the level of prostate-specific antigen (PSA) (12–14). Further, it was reported that such down-regulated PSA levels might be caused by proteolysis of AR induced by statins (15). All these studies suggest that statins may suppress PCa progression through inhibiting AR. Therefore, we aim to test whether statins can overcome acquisition of enzalutamide resistance in CRPC, in which AR continues to play an important role.
Herein, RNA-Seq analysis was performed in two PCa cells lines: LNCaP and MR49F, the enzalutamide-resistant derivative of LNCaP. We found that genes involved in cholesterol biosynthesis pathway were up-regulated in MR49F compared with those in LNCaP cells. Therefore, we hypothesize that cholesterol biosynthesis plays an essential role in the acquisition of enzalutamide resistance and that targeting HMGCR will overcome enzalutamide resistance in CRPC.
Results
Identification of highly expressed HMGCR in enzalutamide-resistant PCa cell lines
To investigate molecular mechanisms underlying enzalutamide resistance, we performed RNA-Seq analysis with LNCaP and MR49F cells. Based on the RNA-Seq result, higher gene expression of cholesterol biosynthesis pathway was observed in MR49F cells than that in LNCaP cells (Fig. 1A). Herein, HMGCR was selected for further study because it is the first rate-limiting protein that plays an important role in cholesterol biosynthesis. To validate the findings from our RNA-Seq analysis, a series of Western blotting analyses was performed in LNCaP, MR49F, C4-2, and C4-2R (an enzalutamide-resistant cell line derived from C4-2). As shown in Fig. 1 (B–D), C4-2R and MR49F showed higher expression levels of HMGCR than those of C4-2 and LNCaP. In addition, such a tendency became more significant when all cells were treated with enzalutamide for 4 h prior to harvest. Meanwhile, the protein level of SREBP2, another critical regulator of cholesterol synthesis, was also examined. Upon enzalutamide treatment, MR49F and C4-2R express higher levels of cleaved SREBP2, the active form of SREBP2, than those of LNCaP and C4-2, respectively (Fig. 1B). Next, we wanted to investigate whether there was more cholesterol synthesized in enzalutamide-resistant cell lines by directly measuring total cholesterol levels. As shown in Fig. 1 (E and F), both MR49F and C4-2R show much higher cholesterol levels than those of LNCaP and C4-2, respectively, upon enzalutamide treatment. Thus, cholesterol biosynthesis is indeed elevated by enzalutamide in enzalutamide-resistant PCa cells, but not in enzalutamide-sensitive cells. Collectively, the data described above indicated that a high level of HMGCR activates cholesterol biosynthesis in enzalutamide-resistant PCa cells. To further validate this finding in clinic, we performed bioinformatics analysis with 72 patient specimens (described under “Experimental procedures”). Accordingly, we found that cholesterol biosynthesis pathway gene set was enriched in high HMGCR-expressing group, indicating that cholesterol biosynthesis pathway was activated as HMGCR expression was elevated (Fig. 1, G and H). Furthermore, gene set enrichment analysis (GSEA) of the HMGCR expression profile showed that the steroid biosynthesis pathway-related gene set is also positively enriched (Fig. 1, I and J).
Figure 1.
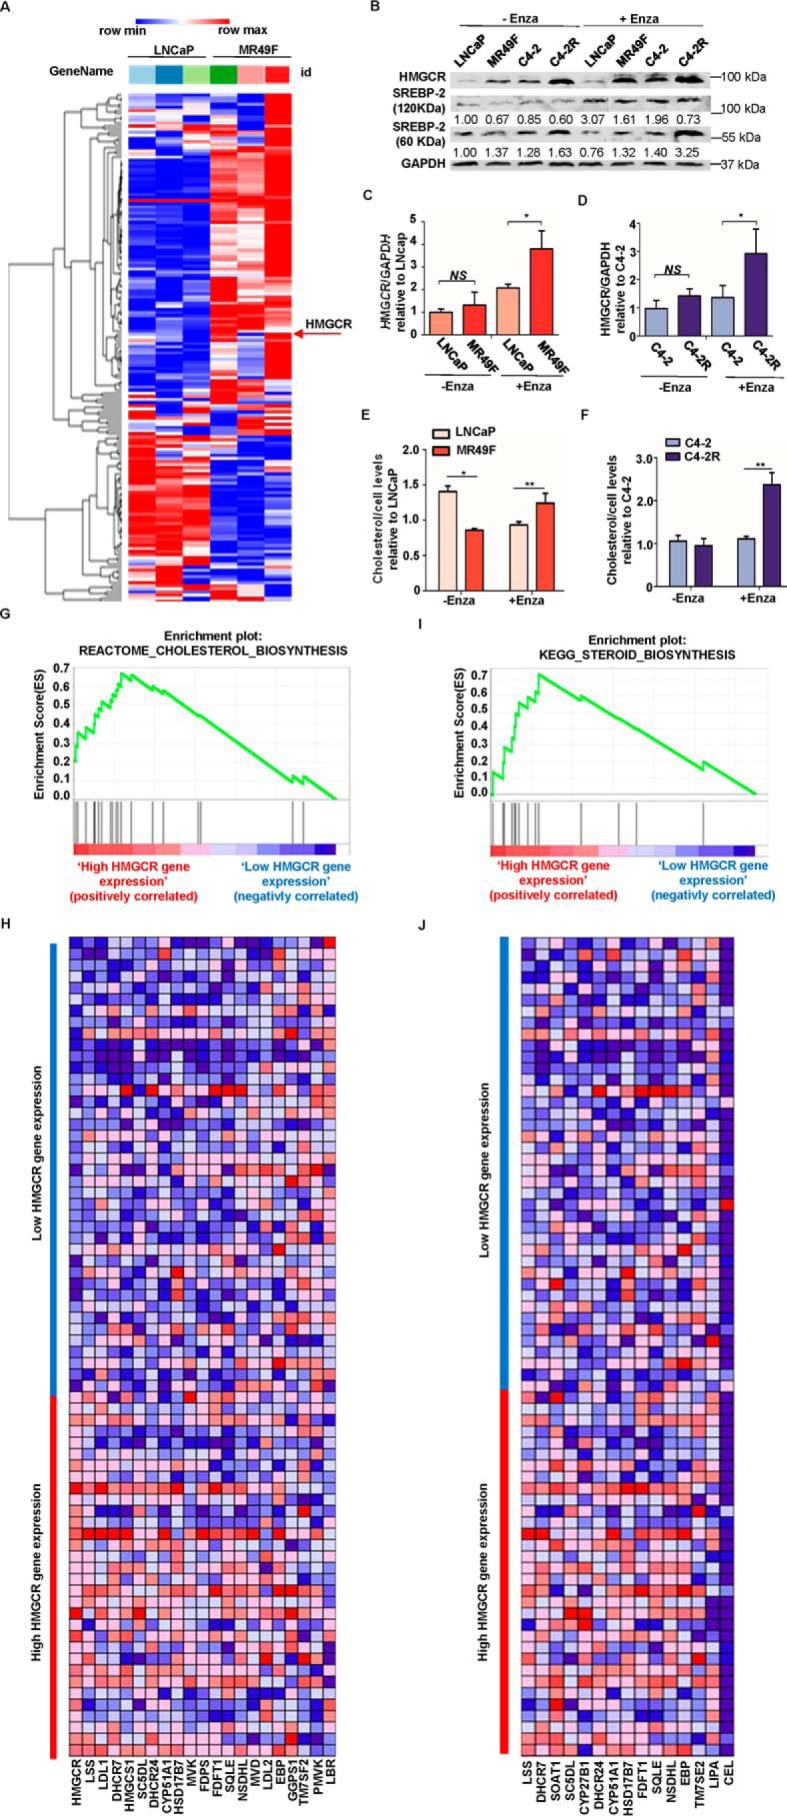
Cholesterol biosynthesis is elevated in enzalutamide-resistant PCa cells. A, heat map of gene expression patterns in LNCaP versus MR49F cells upon RNA-Seq. B, LNCaP, MR49F, C4-2, and C4-2R cells were treated with DMSO or enzalutamide (Enza) for 4 h and harvested for IB with antibodies indicated. C and D, quantification of the relative HMGCR band intensities from three experiments. The intensities of HMGCR bands were normalized to GAPDH first and then normalized to those of LNCaP and C4-2 cells with DMSO treatment, respectively. The results are represented as means ± S.D., n = 3. E and F, after cells were treated with enzalutamide for 4 h, total cholesterol was extracted and measured by a kit following the manufacturer's instructions. The results are presented as means ± S.D. of two experiments in duplicate. G, GSEA confirms that the cholesterol biosynthesis pathway gene set is enriched in the high HMGCR-expressing group. The enrichment plot shows the distribution of genes in the set that are correlated with HMGCR expression. H, the heat map shows where gene expression is high (red) or low (blue) for each gene within the cholesterol biosynthesis pathway. I, GSEA confirms that steroid biosynthesis pathway gene set is enriched in the high HMGCR-expressing group. The enrichment plot shows the distribution of genes in the set that are correlated with HMGCR expression. J, the heat map shows where gene expression is high (red) or low (blue) for each gene within the steroid biosynthesis pathway. NS, not significant.
HMGCR expression level affects cellular response to enzalutamide
Having established that HMGCR is highly expressed in enzalutamide-resistant PCa cells, we asked whether alternation of HMGCR protein level could affect cellular response to enzalutamide. To explore this, shRNA was used to knock down HMGCR in C4-2R cells, and the down-regulation of HMGCR was determined by IB (Fig. 2A). Because of the relative lower KD efficacy of a single shRNA, a mixed pool of both shRNAs was used to construct stable HMGCR-KD cell line. Then the growth assay was performed to test whether HMGCR-KD cells were more sensitive to enzalutamide. After 3-day treatment of enzalutamide with different concentrations, C4-2R cells were still fairly resistant to enzalutamide, whereas down-regulation of HMGCR clearly rendered C4-2R cells more sensitive to enzalutamide (Fig. 2B). Furthermore, after HMGCR was restored in HMGCR-KD cells (Fig. 2C), it apparently rescued cells from enzalutamide-induced growth inhibition (Fig. 2D). In agreement, a similar observation was made in anchorage-independent growth assay (Fig. 2, E and F). Compared with control cells, which showed no significant difference in colony numbers after enzalutamide treatment (Fig. 2E), significantly fewer colonies were formed when HMGCR-KD cells were treated with enzalutamide (Fig. 2F), and the phenotype was largely reversed upon reintroduction of HMGCR (Fig. 2G). Furthermore, cell apoptosis was examined by IB against cleaved PARP. C4-2R cells are resistant to enzalutamide and showed almost no apoptosis upon enzalutamide treatment, whereas knockdown of HMGCR restored their sensitivity to enzalutamide (Fig. 2H). Further, we transiently transfected C4-2 cells with HMGCR and asked whether overexpression of HMGCR could confer C4-2 cells resistance to enzalutamide. After HMGCR protein overexpression was confirmed by IB, we performed a 3-day cell-growth assay under treatment of enzalutamide with the indicated concentrations. As indicated, more C4-2 cells overexpressing HMGCR could survive than C4-2 cells transfected with pcDNA3.0 (Fig. 2I). Collectively, these results demonstrate that down-regulation of HMGCR renders enzalutamide-resistant PCa cells to be sensitive to enzalutamide and that up-regulation of HMGCR can confer resistance. Because overexpression of HMGCR can confer PCa cells resistance to enzalutamide, we finally asked whether enzalutamide-resistant PCa cells are more sensitive to statins, which targets HMGCR. To test this, a 3-day growth assay under treatment of mevastatin with different concentrations was conducted. As expected, MR49F and C4-2R are more sensitive to mevastatin than their parental cell lines, respectively (Fig. 2, J and K), providing a possible new approach to overcome enzalutamide resistance.
Figure 2.

HMGCR confers resistance to enzalutamide in PCa cells. A, C4-2R cells were stably transfected with sh-Control, sh-HMGCR #1, sh-HMGCR #2, or a mixed pool of #1 and #2 and then harvested for IB, followed by quantification. B, HMGCR-KD C4-2R cells and control (Ctrl) cells were treated with enzalutamide (Enza) at the indicated concentrations for 3 days, followed by cell number determination. The results are presented as means ± S.D. of three experiments. C and D, HMGCR-KD C4-2R cells were transfected with control or shRNA-resistant HMGCR plasmid, treated with different concentrations of enzalutamide for 3 days, and harvested for cell number determination. E and F, HMGCR-KD C4-2R cells and control cells were cultured in the medium with enzalutamide (20 μm) for 14 days with the medium being changed on the seventh day. After cells were fixed in 10% formalin, colony formation was subjected to crystal violet staining and quantified with results being presented as means ± S.D. of three experiments. G, HMGCR-KD C4-2R cells were transfected with control or shRNA-resistant HMGCR plasmid and cultured in the medium containing enzalutamide (20 μm), followed by a 14-day anchorage-independent growth assay. H, C4-2R cells (control or HMGCR-KD) were treated with 20 μm enzalutamide for 48 h and harvested for IB against cleaved PARP (C-PARP). IB results are quantified and presented as means ± S.D. of three experiments. I, C4-2 cells were transiently transfected with HMGCR or pcDNA3.0, treated with different concentrations of enzalutamide for 3 days, and harvested for cell number determination. The results are presented as means ± S.D. of one experiment in triplicate. Meanwhile, cell lysates were collected after 3 days for IB to determine the expression of HMGCR. J and K, the indicated PCa cells were treated with different concentrations of mevastatin (Meva) for 72 h, followed by MTT assay to measure cell viability. The results are presented as means ± S.D. of two experiments in triplicate. *, p < 0.05.
Simvastatin treatment overcomes enzalutamide resistance in vitro
Next, we asked whether simvastatin, one of the marked statins, could enhance the inhibitory effect of enzalutamide on enzalutamide-resistant PCa cells. For that purpose, colony formation assay was performed with MR49F, C4-2R, and 22RV1 cells (Fig. 3, A–C). Significantly fewer colonies were observed in the combination groups in all three cell lines, suggesting that simvastatin enhances enzalutamide efficacy of these enzalutamide-resistant cell lines. To further validate this, we also performed proliferation assays in MR49F and C4-2R cells. As shown in Fig. 3 (D and E), simvastatin alone could slightly slow down cell growth, whereas a combination of enzalutamide and simvastatin significantly inhibited cell proliferation rate. Meanwhile, representative images of four treatment groups were taken on day 5 for C4-2R cells to compare potential morphology change of the cells. As shown in Fig. 3F, there was no apparent difference between control group and enzalutamide monotherapy group, but simvastatin alone was capable of inducing shrinkage of cells. For combination group, the same morphological modification was observed, and cells were clearly sparser. Next, the apoptosis level was tested after different treatments with indicated cell lines. 22RV1 or C4-2R cells were treated with simvastatin at the indicated concentrations in the presence or absence of enzalutamide and harvested for IB against cleaved PARP, a marker of apoptosis. As shown in Fig. 3 (G–I), enzalutamide alone could not induce any apoptosis because the cells used are enzalutamide-resistant. Although simvastatin treatment alone caused relatively weak cell death, the combination of two drugs clearly led to significantly higher levels of apoptosis. However, such a combinational effect on cell death was not observed in enzalutamide-sensitive LNCaP and C4-2 cells (Fig. 3J). To further confirm the combinatory effect between simvastatin and enzalutamide, the CI was measured. As shown in Table 1, the IC50 values for enzalutamide in C4-2R and MR49F cells are 57.6 and 20.0 μm, respectively. However, the IC50 values for enzalutamide in C4-2R and MR49F cells are reduced to 23.3 and 8.2 μm, respectively, when cells are treated with simvastatin, suggesting that simvastatin renders enzalutamide-resistant cells sensitive to enzalutamide. CIs of the two drugs in these two cell lines are 0.9 and 0.91, further indicating that statin and enzalutamide exert a synergistic effect in inhibiting cell growth.
Figure 3.

Simvastatin treatment overcomes enzalutamide resistance in vitro. A–C, MR49F, C4-2R, and 22RV1 cells (500–1,000 cells/well) were cultured in the media with enzalutamide (Enza), simvastatin (SIM), or both drugs at the indicated concentrations. After changing fresh media containing drug(s) every 3 days for 10 days, the cells were fixed, followed by colony formation staining with crystal violet. The colonies were counted, and the results are presented as means ± S.D. of three experiments. D, MR49F cells (5,000 cells/well) were cultured in the media with enzalutamide (10 μmol/liter), simvastatin (1 μmol/liter), or both drugs. Growth assay was carried out for 5 days, with cell numbers being counted every day. E and F, C4-2R cells (5,000 cells/well) were cultured in the media with enzalutamide (20 μmol/liter), simvastatin (1 μmol/liter), or both drugs. Growth assay was carried out for 5 days, with cell numbers being counted every day. Representative images were taken on day 5 to show the morphology of the cells in four groups. G, C4-2R cells were treated with simvastatin, enzalutamide, or a combination of the two drugs at the indicated concentrations for 48 h, followed by IB against cleaved PARP (C-PARP). H, quantification of relative band intensities of cleaved PARP from three independent experiments. The intensities of cleaved PARP bands were normalized to those of β-actin and then normalized to the first lane. The data are represented as means ± S.D., n = 3. I, 22RV1 cells were treated with simvastatin, enzalutamide, or a combination of the two drugs at the indicated concentrations for 48 h, followed by anti-cleaved PARP IB to measure apoptosis. J, LNCaP and C4-2 cells were treated with simvastatin (5 μmol/liter), enzalutamide (20 μmol/liter), or a combination of the two drugs for 48 h and harvested for anti-cleaved PARP IB. Ctrl, control.
Table 1.
Combination index analysis of enzalutamide combined with simvastatin
| C4–2BR | MR49F | |
|---|---|---|
| Enzalutamide (As)50 | 57.6 μm | 20.0 μm |
| Simvastatin (Bs)50 | 6.4 μm | 2.4 μm |
| Enzalutamide (Am)50 (combined with half (Bs)50 simvastatin) | 23.3 μm | 8.2 μm |
| CI | 0.9 | 0.91 |
Simvastatin treatment overcomes enzalutamide resistance in vivo
To investigate whether statins can overcome enzalutamide resistance in vivo, we used the 22RV1 xenograft model. As shown in Fig. 4 (A–C), 22RV1-derived tumors showed strong resistance to enzalutamide, but simvastatin alone partially slowed down tumor growth, and a combination of simvastatin and enzalutamide almost completely inhibited tumor growth. At the same time, there was no significant difference in mice body weight among all groups (Fig. 4D), indicating that the combination treatment does not have serious side effects. Histologically, the cells in control and enzalutamide groups were arranged compactly but a little more discretely upon simvastatin treatment. In striking contrast, only small and scattered cell groups were found in combination treatment group (Fig. 4E). Furthermore, immunostaining of Ki67 and cleaved caspase-3 confirmed that the combination treatment indeed reduced tumor cell proliferation significantly and led to more apoptosis (Fig. 4, F–I). In summary, these in vivo results, which are consistent with our in vitro data, support the notion that the tumor-killing effect of enzalutamide was potentiated by statin.
Figure 4.

Simvastatin treatment overcomes enzalutamide resistance in vivo. A–D, mice bearing 22RV1 tumors were treated with enzalutamide (Enza), simvastatin (SIM), or a combination of the two drugs (Combo) for 4 weeks as described under “Experimental procedures.” Tumor volumes were measured every 2 days (mean ± S.D.; n = 4 mice for each group). Mice body weights were measured before sacrifice, and fresh tumors were weighed immediately after sacrifice. **, p < 0.01 compared with enzalutamide or simvastatin monotherapy. E, representative images of hematoxylin and eosin staining on formaldehyde-fixed, paraffin-embedded 22RV1 xenograft tumor sections from groups with different treatments. F and H, representative images of anti-Ki67 and anti-cleaved caspase 3 immunofluorescent chemistry staining of tumor sections. G and I, quantification of Ki67 and cleaved caspase 3 staining. *, p < 0.05; **, p < 0.01. Ctrl, control.
Simvastatin decreases AR protein expression through enhancing protein degradation
Because PCa progression is AR-dependent and enzalutamide resistance can be induced by reactivation of AR (16), we asked whether AR signaling is affected by simvastatin. We found that simvastatin decreased AR protein level in a dose-dependent manner in C4-2R cells (Fig. 5A). To determine whether simvastatin can affect transcription levels of AR and even AR-V7, quantitative real-time PCR was performed. As shown in Fig. 5B, there was no significant difference in mRNA expression of AR or AR-V7 upon simvastatin treatment, suggesting that transcription of AR and AR-V7 is not affected by simvastatin. Next, cycloheximide (CHX), a protein translation inhibitor, was utilized to examine the effect of simvastatin on protein turnover of AR. Accordingly, after cycloheximide was added to the cells in the presence of different concentrations of simvastatin, C4-2R cells were harvested at different time points to follow AR degradation. As shown in Fig. 5C, simvastatin treatment clearly accelerated AR degradation compared with cells only treated with cycloheximide. Therefore, it is possible that simvastatin could induce AR degradation via the ubiquitin-proteasome system instead of down-regulating transcription. To confirm this hypothesis, the 26S proteasome inhibitor MG132 was used to ask whether it can reverse the simvastatin-induced AR degradation. As shown in Fig. 5D, MG132 treatment indeed partially rescued AR protein level from degradation induced by simvastatin.
Figure 5.

Simvastatin treatment suppresses the level of AR protein expression. A, C4-2R cells were treated with simvastatin (SIM) at the indicated concentrations for 48 h, followed by anti-AR IB. Quantification of relative AR band intensities from three independent experiments. AR bands were normalized to GAPDH and then normalized to the first lane. The data are represented as means ± S.D., n = 3. B, 22RV1 cells were treated with simvastatin at the indicated concentrations for 48 h and harvested for quantitative RT-PCR. C, C4-2R cells were treated with 50 μg/ml CHX and different concentrations of simvastatin and harvested at the indicated time points, followed by anti-AR IB. The data were plotted relative to AR level at time 0. D, C4-2R cells were treated with different concentrations of simvastatin for 48 h, further incubated with 5 μm MG132 for 8 h, and harvested for IB.
Enzalutamide and simvastatin decrease AR protein expression synergistically
Having established that simvastatin can partially enhance AR protein degradation, we then asked whether a combinational treatment of enzalutamide and simvastatin would affect the AR protein level synergistically. To investigate this possibility, C4-2R, 22RV1, and MR49F cells were treated with enzalutamide, different concentrations of simvastatin, or various combinations of the two drugs and harvested. As shown in Fig. 6 (A–C), AR protein levels were decreased by simvastatin treatment alone in a dose-dependent manner. Further, simvastatin plus enzalutamide led to maximum inhibition of AR (Fig. 6, A–C) and even AR-Vs in 22RV1 cells (Fig. 6B). To further confirm this, immunofluorescence staining was conducted. As shown in Fig. 6D, enzalutamide alone did not alter the AR protein levels in C4-2R cells. Although simvastatin alone partially decreased AR level compared with that of the control group, simvastatin plus enzalutamide almost completely abolished AR signal. We further showed that the reduced AR level in the co-treatment group was not due to a reduced AR mRNA level (Fig. 6E) but due to a shortened protein half-life (Fig. 6F). In addition to these, we aimed to confirm that decreased AR protein level is indeed responsible for apoptosis induced by enzalutamide plus simvastatin. Toward that end, MR49F, C4-2R, and 22RV1 cells were overexpressed with AR, followed by co-treatment with enzalutamide and simvastatin for 48 h. As shown in Fig. 6G, less apoptosis was observed in cells overexpressing AR compared with control cells, indicating that overexpression of AR can protect enzalutamide-resistant cells from apoptosis caused by enzalutamide plus simvastatin. Finally, to test whether the effects seen above are specific to HMGCR, we examined AR protein expression in cells (control or HMGCR-KD) after enzalutamide treatment. As shown in Fig. 6 (H and I), AR level decreases partially in HMGCR-KD cells but more significantly upon enzalutamide treatment. In summary, our results demonstrate that degradation of AR is induced in PCa cells upon treatment with simvastatin alone or enzalutamide plus simvastatin and that AR degradation is the mechanism responsible for the synergistic effect of stain plus enzalutamide.
Figure 6.

Combination of enzalutamide and simvastatin further decreases AR protein level. A, C4-2R cells were treated with 20 μm enzalutamide (Enza), the indicated concentrations of simvastatin (SIM), or various combinations of the two drugs (Combo) for 48 h and harvested for IB to measure AR and PSA expression. B, 22RV1 cells were treated with 20 μm enzalutamide, the indicated concentrations of simvastatin, or different combinations of the two drugs for 72 h and harvested for IB. C, MR49F cells were treated with 10 μm enzalutamide, the indicated concentrations of simvastatin, or different combinations of the two drugs for 48 h and harvested for IB. D, representative images of immunofluorescence staining for AR in C4-2R cells treated with 20 μm enzalutamide, 5 μm simvastatin, or a combination of the two drugs for 48 h. E, C4-2R cells were treated with enzalutamide (20 μmol/liter), simvastatin (5 μmol/liter), or a combination of the two drugs for 48 h and harvested for quantitative RT-PCR. F, C4-2R cells were treated with 50 μg/ml CHX in the presence of simvastatin (5 μmol/liter) or enzalutamide (20 μmol/liter) plus simvastatin (5 μmol/liter) and harvested at the indicated time points, followed by anti-AR IB. G, MR49F, C4-2R, and 22RV1 cells were transiently transfected with AR or pcDNA3.0, cultured in medium with the combination of 20 μm enzalutamide and 5 μm simvastatin for 48 h, and harvested for IB against AR and cleaved PARP (C-PARP). H, C4-2R cells (control or HMGCR-KD) were treated with 20 μm enzalutamide or DMSO for 48 h and harvested. I, quantification of relative AR band intensities from three independent experiments. AR bands were normalized to β-actin and then normalized to the first lane. The data are represented as means ± S.D., n = 3. Ctrl, control.
Gene expression of mTOR pathway is positively correlated with HMGCR and AR expression
The previous study in our lab showed that a positive feedback loop exists among mTOR pathway, AR signaling, and lipid biosynthesis pathway (17). Thus, we asked whether such an interaction is still active after antihormone therapy or even enzalutamide treatment. To explore this possibility, Pearson correlation analysis was performed to detect the gene expression interaction between HMGCR and mTOR, HMGCR, and AR, as well as AR and mTOR, by using the samples from 72 patients (described in the method). As shown in Fig. 7 (A–F), correlations of all three groups' gene expression were positive, but only the gene co-expression between AR and mTOR was significant with a correlation coefficient value of 0.4288 (Fig. 7C). Moreover, to explore whether mTOR pathway activation is associated with HMGCR and AR expression, GSEA analysis was performed with the same samples. As shown in Fig. 7 (G and H), mTOR pathway gene set was enriched in high HMGCR-expressing group, indicating that mTOR pathway is activated as HMGCR expression increases. Furthermore, GSEA analysis of AR expression profile showed that mTOR pathway-related gene set was positively enriched as well (Fig. 7, I and J). To validate the observation described above, additional experiments were performed by using of our cell models. As indicated, cleaved SREBP2, HMGCR, AR, and critical components of the mTOR pathway were all highly expressed in C4-2R cells compared with C4-2 cells (Fig. 7K). In addition, depletion of HMGCR led to down-regulation of levels of mTOR, phospho-mTOR, phospho-AKT and AR (Figs. 7L and 6I). Besides HMGCR expression level, we asked whether lower HMGCR activity could affect mTOR pathway as well. As shown in Fig. 7M, both the levels of phospho-AKT and phospho-S6 were decreased upon simvastatin treatment in a dose-dependent manner, suggesting that simvastatin is capable of inhibiting mTOR pathway. Finally, inhibition of AKT with BKM120 induced an apparent degradation of AR in C4-2R cells upon enzalutamide treatment (Fig. 7N), which also explains why a combination of enzalutamide and simvastatin reduces AR synergistically.
Figure 7.

Gene expression of mTOR pathway is positively correlated with HMGCR and AR expression. A and B, correlation between expression of HMGCR and mTOR in 72 patient samples. C and D, correlation between expression of AR and mTOR in 72 patient samples. E and F, correlation between expression of AR and HMGCR in 72 patient samples. G, GSEA confirms that mTOR pathway gene set is enriched in high HMGCR-expressing group. The enrichment plot shows the distribution of genes in the set that are correlated with HMGCR expression. H, the heat map shows where gene expression is high (red) or low (blue) for each gene of the mTOR pathway in the samples with different levels of HMGCR. I, GSEA confirms that mTOR pathway gene set is enriched in high AR-expressing group. The enrichment plot shows the distribution of genes in the set that are correlated with AR expression. J, the heat map shows where gene expression is high (red) or low (blue) for each gene of the mTOR pathway in the samples with different levels of AR. K, LNCaP, MR49F, C4-2, and C4-2R cells were cultured in RPMI 1640 media containing 10% FBS for 2 days and harvested for IB with antibodies against indicated proteins. L, the cell lines described in Fig. 2C were cultured in RPMI 1640 media containing 10% FBS for 2 days and harvested for IB with antibodies indicated. M, C4-2R cells were treated with enzalutamide and simvastatin at the indicated concentrations for 48 h, followed by IB. N, C4-2R cells were treated with enzalutamide and BKM120 at the indicated concentrations for 48 h, followed by IB. Ctrl, control.
Discussion
Enzalutamide has been recently approved as a drug for CRPC by the U.S. Food and Drug Administration, and it significantly improves the therapy for late-stage CRPC patients (1, 18, 19). However, drug resistance usually occurs, and patients will relapse with CRPC, which is incurable. In this study, we have identified that HMGCR, a key enzyme for synthesis of cholesterol, is overexpressed in enzalutamide-resistant cell lines including MR49F and C4-2R, suggesting that abnormal cholesterol biosynthesis is likely to be one contributing factor for enzalutamide resistance. We further demonstrate that knockdown of HMGCR resensitize C4-2R to enzalutamide and that overexpression of HMGCR confers C4-2 to be more resistant to enzalutamide. Next, simvastatin, an inhibitor of HMGCR, was used to overcome enzalutamide resistance both in vitro and in vivo. Mechanistically, we show that simvastatin down-regulates protein level of AR by promoting its degradation and that a combination of simvastatin and enzalutamide exerts a synergistic effect on AR protein turnover, and this process may be through inhibition of mTOR pathway whose activation is found positively associated with HMGCR and AR expression.
Increasing evidence shows that the lethal PCa is associated with deregulation of lipid or cholesterol biosynthesis (20–23) and that lipid biosynthesis induced by AR reactivation can induce resistance to androgen-deprivation therapy and contributes to CRPC progression (24). For enzalutamide resistance, cholesterol is capable of participating in intracrine androgen biosynthesis, conferring PCa cells with resistance to enzalutamide (7). Herein, we showed that expression of HMGCR, the first rate-limiting enzyme of cholesterol biosynthesis, was elevated in MR49F and C4-2R cells compared with their parental cell lines and that the activity of HMGCR was increased upon enzalutamide treatment, which means more cholesterol was synthesized to support cell survival. Therefore, we propose that aberrant expression of HMGCR is one of enzalutamide-resistant mechanisms.
Several studies have been conducted to investigate the effect of statins on PCa cell proliferation. For example, Sekine et al. (25) reported that simvastatin could suppress proliferation and induce apoptosis of PC3 cells. Hong et al. (26) showed that LNCaP cell proliferation could be inhibited by lovastatin. These findings are consistent with our observation that simvastatin can induce apoptosis of enzalutamide-resistant cells. Meanwhile, we aimed to investigate whether inhibition of HMGCR could overcome enzalutamide resistance. However, we are aware that the effect of combination of enzalutamide and statins on PCa cells was reported by Syvälä et al. (27) during the preparation of our manuscript. The group showed that combination of simvastatin and enzalutamide exerted additive growth inhibition on LNCaP and VCaP cells in vitro, indicating that statins had potential to increase the efficacy of enzalutamide. However, whether statin can overcome enzalutamide resistance was not tested in their study, because both LNCaP and VCaP are androgen-sensitive cell lines, and no castration-resistant or enzalutamide-resistant cell lines were examined in their study. Herein, we showed that simvastatin could restore enzalutamide's inhibitory effect on MR49F, C4-2R, and 22RV1 cells and that the combined treatment could also inhibit proliferation of 22RV1-derived tumor synergistically.
To explore the underlying mechanism responsible for the inhibitory effect of statins on PCa cell proliferation, we investigated the role of AR signaling. Previously, Syvälä et al. (27) revealed that AR level was decreased slightly by simvastatin in LNCaP cells, and Yokomizo et al. (15) found that mevastatin and simvastatin could down-regulate AR protein by proteolysis and decrease proliferation in RWPE-1, 22RV1, and LNCaP cells. These results are consistent with our finding that simvastatin led to slight AR protein degradation via the proteasome system without affecting mRNA transcription of AR. Furthermore, we found that combination of enzalutamide and simvastatin could induce more dramatic degradation of AR than simvastatin alone. Such degradation of AR was also observed in HMGCR-KD cells upon treatment with enzalutamide. In addition, we also showed that the protein level of AR-Vs was decreased by simvastatin either alone or in combination with enzalutamide in 22RV1 cells. Therefore, all of these data help to explain why statin treatment or HMGCR inhibition overcomes enzalutamide resistance, as it has been documented that formation of AR-Vs, AR mutation, and AR amplification could confer PCa cell resistance to enzalutamide (2, 6).
The proposed model described in our previous study (17) summarized how mTOR pathway, cholesterol biosynthesis, and AR signaling cooperated to drive PCa progression. In agreement, we found that positive correlations among HMGCR, AR, and the mTOR pathway exist in hormone therapy-resistant patient specimens, as well as in enzalutamide-resistant PCa cells. Therefore, the mTOR pathway is likely to play a critical role in the enzalutamide resistance, and it could be affected by HMGCR expression. In addition, we showed that simvastatin could inhibit mTOR pathway as well, consistent with previous studies (29). Considering that inhibition of AKT induced apparent degradation of AR in C4-2R cells upon enzalutamide treatment, it is likely that simvastatin induces AR degradation via inhibiting mTOR pathway.
In summary, our study shows that the aberrant expression of HMGCR is one of enzalutamide-resistant mechanisms. In addition, proliferation of enzalutamide-resistant cells is inhibited by simvastatin both alone and combined with enzalutamide in vitro and in vivo. Mechanistically, the combination of the two drugs induces maximum degradation of AR and AR-Vs, potentially through inhibition of mTOR pathway. Recently, it has been reported that statins could be used to delay progression of PCa in patients under ADT (30, 31). Therefore, the new combination strategy can be considered for clinical trials to overcome enzalutamide resistance in PCa.
Experimental procedures
Cell culture and drug
LNCaP, C4-2, 22RV1, MR49F, and C4-2R cells were used in the study. Although LNCaP cells are androgen-dependent, C4-2 cells were derived from LNCaP but are androgen-independent. MR49F cells were derived from LNCaP but are enzalutamide-resistant. C4-2R cells were derived from C4-2 but are enzalutamide-resistant. We ordered LNCaP and 22RV1 from ATCC. Although C4-2 cells were obtained from M. D. Anderson Cancer Center, MR49F and C4-2R cells were kindly provided by Dr. Amina Zoubeidi at the Vancouver Prostate Cancer Center and Dr. Allen Gao at University of California at Davis, respectively. LNCaP, C4-2, and 22RV1 cells were cultured in RPMI1640 medium supplemented with 10% (v/v) fetal bovine serum (FBS), 100 units/ml penicillin, and 100 units/ml streptomycin at 37 °C in a humidified incubator with 5% carbon dioxide. C4-2R and MR49F cells were maintained in previously described medium containing 20 and 10 μm enzalutamide, respectively. Enzalutamide and simvastatin were purchased from Medchem Express.
Antibodies
Antibodies against androgen receptor (5153S), cleaved PARP (9541L), p-AKT (S473) (4051S), AKT (4691S), p-S6 (S235/236) (2211S), p-S6 (S240/244) (5364S), S6 (2317S), p-4EBP1 (T37/46) (2855S), GAPDH (2118L), and cleaved caspase 3 (9661S) were purchased from Cell Signaling Technology. Antibody against HMGCR (ABS229) was ordered from Millipore. Antibody against SREBP-2 (sc-5603) was obtained from Santa Cruz Biotechnology.
Immunoblotting
Upon harvest, the cells were suspended with TBSN buffer (20 mmol/liter Tris-HCl, pH 8.0, 0.5% NP-40, 5 mmol/liter EGTA, 1.5 mmol/liter EDTA, 0.5 mmol/liter sodium vanadate, and 150 mmol/liter NaCl) with protease inhibitors and phosphatase inhibitors, sonicated and, then collected. Protein concentrations were determined by protein assay dye reagent from Bio-Rad. Equal amounts of protein from each sample were mixed with SDS loading buffer and separated by SDS-PAGE. After transferring to PVDF membranes, proteins were probed with appropriate first and second antibodies. All Western blotting were repeated at least three times, and protein bands were quantified by ImageJ and normalized to their respective GAPDH or β-actin.
Clonogenic assay
The cells were seeded with equal density in 6-well plate and treated with DMSO or different drugs with designated concentrations for 14 days. The medium was changed every 7 days. After the colonies were fixed by 10% formalin and stained with 5% crystal violet, colony numbers were determined by ImageJ.
Combination index
The equation CI = (Am)50/(As)50 + (Bm)50/(Bs)50 was used to calculate CI of enzalutamide and simvastatin (32). (As)50 is the concentration of enzalutamide that will exert 50% inhibitory effect by itself, and (Bs)50 is the concentration of simvastatin that will exert 50% inhibitory effect by itself. (Am)50 is the concentration of enzalutamide to achieve a 50% inhibitory effect in combination with simvastatin. (Bm)50 is the concentration of simvastatin that will produce a 50% inhibitory effect in combination with enzalutamide. Antagonism is indicated when CI > 1, CI = 1 indicates an additive effect, and CI < 1 means synergy (28).
Quantification of total cholesterol in cells
Total cholesterol was measured by a commercial kit (ab65359) following the manufacturer's instructions. Cholesterol was extracted from 1 × 10⁶ cells and dried at 50 °C before dissolved in supplied assay buffer. Optical density was measured in a 96-well plate reader in duplicate at 570 nm, and total cholesterol amount was calculated by standard curve.
HMGCR shRNA transduction
The kit (TL312393V) with HMGCR–human shRNA lentiviral particles was purchased from Origene. A mixed pool of particles was applied to knock down HMGCR. The selection was performed by using puromycin following the manufacturer's instructions.
Real-time quantitative RT-PCR
Total RNA was extracted using RNeasy mini kit (Qiagen) according to the manufacturer's instructions. The same amount of RNA was used for reverse transcription that was performed by iScript cDNA synthesis kit (Bio-Rad), followed by gene amplification using FastStart Universal SYBR Green (Roche Applied Science) and a Roche LightCycler 96 thermocycler (Roche Diagnostics Corp.). All individual reactions were performed in triplicate, and all genes were normalized to GAPDH or 18S RNA. Primers used for real-time PCR are: AR full length, 5′-AAGCCAGAGCTGTGCAGATGA-3′ (forward) and 5′-TGTCCTGCAGCCACTGGTTC-3′ (reverse); AR-V7, 5′-AACAGAAGTACCTGTGCGCC-3′ (forward) and 5′-TCAGGGTCTGGTCATTTTGA-3′ (reverse); 18S RNA, 5′-GAGAAGGCTGGGGCTCAT-3′ (forward) and 5′-TGCTGATGATCTTGAGGCTG-3′ (reverse); and GAPDH, 5′-GTAACCCGTTGAACCCCATT-3′ (forward) and 5′-CCATCCAATCGGTAGTAGCG-3′ (reverse).
In vivo tumorigenesis assay
22RV1 cells (2 × 10⁵/mouse) were mixed with Matrigel (1:1) and injected subcutaneously into to the right flank of nude mice. Tumor-bearing mice were randomized into four groups for indicated treatment as follows: for the first week, enzalutamide (25 mg/kg body weight) was gavaged, and simvastatin was intraperitoneally injected every 2 days; from the second week, both drugs were administered every day. Tumor size was measured by calipers every 2 days, and volumes were calculated using length × width2/2. The mouse experiments have been approved by the Purdue Animal Care and Use Committee.
Histology and immunofluorescent chemistry
Xenograft tumors were fixed in 10% neutral buffered formalin, paraffin-embedded, sectioned to 5 mm, and stained using conventional hematoxylin and eosin staining. Immunofluorescent chemistry staining was accomplished with the M.O.M.TM kit from Vector Laboratories.
Gene set enrichment analysis
For TCGA prostate adenocarcinoma patient data, the RNA-Seq information was collected from level 3 (for segmented or interpreted data, IllumninaHiSeq_RNASeqV2 of TCGA. For hormone-sensitive and -resistant for high Gleason score signature in TCGA PCa, cancer samples were divided into low-grade (Gleason scores of <8) group and high-grade (Gleason scores of ≥8) group. Samples with a high-grade Gleason score plus antihormone treatment were considered to be potentially resistant to antihormone therapy. To integrate patient demography and drug treatment annotation together, 72 of 497 cases with clinical antihormone treatment were selected as observed objectives. After 72 patients were separated into two groups based on the gene expression level of our target proteins, GSEA software was applied to detect the gene pathway enrichment variation between the groups we studied.
Statistical analysis
Standard two-tailed Student t tests were performed to analyze statistical significance of the results. A p value of less than 0.05 indicates statistical significance.
Author contributions
Y. K. and X. L. conceptualization; Y. K. resources; Y. K., L. C., and J. B. data curation; Y. K. and L. C. software; Y. K., L. C., F. M., E. F., and Y. B. formal analysis; Y. K. and X. L. validation; Y. K. visualization; Y. K., F. M., Z. Z., Y. Z., and X. L. methodology; Y. K. writing-original draft; Y. K. and X. L. project administration; L. C. investigation; Z. Z. and X. L. writing-review and editing; Y. Z., N. A., S. K., L. L., and X. L. supervision; X. L. funding acquisition.
Acknowledgment
The Purdue University Center for Cancer Research is supported by Grant P30 CA023168 from the National Institutes of Health.
This work was supported by National Institutes of Health Grants R01 CA157429 (to X. L.), R01 CA192894 (to X. L.), R01 CA196835 (to X. L.), R01 CA196634 (to X. L.), R01 AR059130 (to N. A.), and R01 CA176748 (to N. A.) and by funds from the Chinese Scholarship Council (to Y. K.). The authors declare that they have no conflicts of interest with the contents of this article. The content is solely the responsibility of the authors and does not necessarily represent the official views of the National Institutes of Health.
- PCa
- prostate cancer
- CRPC
- castration-resistant prostate cancer
- CI
- combination index
- HMGCR
- 3-hydroxy-3-methyl-glutaryl–CoA reductase
- AR
- androgen receptor
- ADT
- androgen-deprivation therapy
- AR-V
- AR splice variant
- PSA
- prostate-specific antigen
- RNA-Seq
- RNA sequencing
- KD
- knockdown
- IB
- immunoblotting
- PARP
- poly(ADP-ribose) polymerase
- CHX
- cycloheximide
- mTOR
- mammalian target of rapamycin
- GSEA
- gene set enrichment analysis
- FBS
- fetal bovine serum
- GAPDH
- glyceraldehyde 3-phosphate dehydrogenase
- SREBP
- sterol regulatory element–binding protein.
References
- 1. Rodriguez-Vida A., Galazi M., Rudman S., Chowdhury S., and Sternberg C. N. (2015) Enzalutamide for the treatment of metastatic castration-resistant prostate cancer. Drug Des. Devel. Ther. 9, 3325–3339 [DOI] [PMC free article] [PubMed] [Google Scholar]
- 2. Antonarakis E. S., Lu C., Wang H., Luber B., Nakazawa M., Roeser J. C., Chen Y., Mohammad T. A., Chen Y., Fedor H. L., Lotan T. L., Zheng Q., De Marzo A. M., Isaacs J. T., Isaacs W. B., et al. (2014) AR-V7 and resistance to enzalutamide and abiraterone in prostate cancer. New Engl. J. Med. 371, 1028–1038 10.1056/NEJMoa1315815 [DOI] [PMC free article] [PubMed] [Google Scholar]
- 3. Balbas M. D., Evans M. J., Hosfield D. J., Wongvipat J., Arora V. K., Watson P. A., Chen Y., Greene G. L., Shen Y., and Sawyers C. L. (2013) Overcoming mutation-based resistance to antiandrogens with rational drug design. eLife 2, e00499 10.7554/eLife.00499 [DOI] [PMC free article] [PubMed] [Google Scholar]
- 4. Cui Y., Nadiminty N., Liu C., Lou W., Schwartz C. T., and Gao A. C. (2014) Upregulation of glucose metabolism by NF-κB2/p52 mediates enzalutamide resistance in castration-resistant prostate cancer cells. Endocr. Relat. Cancer 21, 435–442 10.1530/ERC-14-0107 [DOI] [PMC free article] [PubMed] [Google Scholar]
- 5. Nguyen H. G., Yang J. C., Kung H. J., Shi X. B., Tilki D., Lara P. N. Jr., DeVere White R. W., Gao A. C., and Evans C. P. (2014) Targeting autophagy overcomes enzalutamide resistance in castration-resistant prostate cancer cells and improves therapeutic response in a xenograft model. Oncogene 33, 4521–4530 10.1038/onc.2014.25 [DOI] [PMC free article] [PubMed] [Google Scholar]
- 6. Prekovic S., van Royen M. E., Voet A. R., Geverts B., Houtman R., Melchers D., Zhang K. Y., Van den Broeck T., Smeets E., Spans L., Houtsmuller A. B., Joniau S., Claessens F., and Helsen C. (2016) The effect of F877L and T878A mutations on androgen receptor response to enzalutamide. Mol. Cancer Ther. 15, 1702–1712 10.1158/1535-7163.MCT-15-0892 [DOI] [PubMed] [Google Scholar]
- 7. Liu C., Lou W., Zhu Y., Yang J. C., Nadiminty N., Gaikwad N. W., Evans C. P., and Gao A. C. (2015) Intracrine androgens and AKR1C3 activation confer resistance to enzalutamide in prostate cancer. Cancer Res. 75, 1413–1422 10.1158/1538-7445.AM2015-1413,10.1158/0008-5472.CAN-14-3080 [DOI] [PMC free article] [PubMed] [Google Scholar]
- 8. Hager M. H., Solomon K. R., and Freeman M. R. (2006) The role of cholesterol in prostate cancer. Curr. Opin. Clin. Nutr. Metab. Care 9, 379–385 10.1097/01.mco.0000232896.66791.62 [DOI] [PubMed] [Google Scholar]
- 9. Mittal A., Sathian B., Chandrasekharan N., Lekhi A., and Yadav S. K. (2011) Role of hypercholesterolemia in prostate cancer: case control study from Manipal Teaching Hospital Pokhara, Nepal. Asian Pac. J. Cancer Prev. 12, 1905–1907 [PubMed] [Google Scholar]
- 10. Shafique K., McLoone P., Qureshi K., Leung H., Hart C., and Morrison D. S. (2012) Cholesterol and the risk of grade-specific prostate cancer incidence: evidence from two large prospective cohort studies with up to 37 years' follow up. BMC Cancer 12, 25 10.1186/1471-2407-12-25 [DOI] [PMC free article] [PubMed] [Google Scholar]
- 11. Zhong S., Zhang X., Chen L., Ma T., Tang J., and Zhao J. (2015) Statin use and mortality in cancer patients: systematic review and meta-analysis of observational studies. Cancer Treat. Rev. 41, 554–567 10.1016/j.ctrv.2015.04.005 [DOI] [PubMed] [Google Scholar]
- 12. Hamilton R. J., Goldberg K. C., Platz E. A., and Freedland S. J. (2008) The influence of statin medications on prostate-specific antigen levels. J. Natl. Cancer Inst. 100, 1511–1518 10.1093/jnci/djn362 [DOI] [PubMed] [Google Scholar]
- 13. Akduman B., Tandberg D. J., O'Donnell C. I., Hughes A., Moyad M. A., and Crawford E. D. (2010) Effect of statins on serum prostate-specific antigen levels. Urology 76, 1048–1051 10.1016/j.urology.2010.03.044 [DOI] [PubMed] [Google Scholar]
- 14. Yang L., Egger M., Plattner R., Klocker H., and Eder I. E. (2011) Lovastatin causes diminished PSA secretion by inhibiting AR expression and function in LNCaP prostate cancer cells. Urology 77, 1508.e1–7 [DOI] [PubMed] [Google Scholar]
- 15. Yokomizo A., Shiota M., Kashiwagi E., Kuroiwa K., Tatsugami K., Inokuchi J., Takeuchi A., and Naito S. (2011) Statins reduce the androgen sensitivity and cell proliferation by decreasing the androgen receptor protein in prostate cancer cells. Prostate 71, 298–304 10.1002/pros.21243 [DOI] [PubMed] [Google Scholar]
- 16. Claessens F., Helsen C., Prekovic S., Van den Broeck T., Spans L., Van Poppel H., and Joniau S. (2014) Emerging mechanisms of enzalutamide resistance in prostate cancer. Nat. Rev. Urol. 11, 712–716 10.1038/nrurol.2014.243 [DOI] [PubMed] [Google Scholar]
- 17. Zhang Z., Hou X., Shao C., Li J., Cheng J. X., Kuang S., Ahmad N., Ratliff T., and Liu X. (2014) Plk1 inhibition enhances the efficacy of androgen signaling blockade in castration-resistant prostate cancer. Cancer Res. 74, 6635–6647 10.1158/0008-5472.CAN-14-1916 [DOI] [PMC free article] [PubMed] [Google Scholar]
- 18. Shao C., Li Z., Ahmad N., and Liu X. (2017) Regulation of PTEN degradation and NEDD4–1 E3 ligase activity by Numb. Cell Cycle 16, 957–967 10.1080/15384101.2017.1310351 [DOI] [PMC free article] [PubMed] [Google Scholar]
- 19. Scher H. I., Beer T. M., Higano C. S., Anand A., Taplin M. E., Efstathiou E., Rathkopf D., Shelkey J., Yu E. Y., Alumkal J., Hung D., Hirmand M., Seely L., Morris M. J., Danila D. C., et al. (2010) Antitumour activity of MDV3100 in castration-resistant prostate cancer: a phase 1–2 study. Lancet 375, 1437–1446 10.1016/S0140-6736(10)60172-9 [DOI] [PMC free article] [PubMed] [Google Scholar]
- 20. Murtola T. J., Syvälä H., Pennanen P., Bläuer M., Solakivi T., Ylikomi T., and Tammela T. L. (2012) The importance of LDL and cholesterol metabolism for prostate epithelial cell. PLoS One 7, e39445 10.1371/journal.pone.0039445 [DOI] [PMC free article] [PubMed] [Google Scholar]
- 21. Yue S., Li J., Lee S. Y., Lee H. J., Shao T., Song B., Cheng L., Masterson T. A., Liu X., Ratliff T. L., and Cheng J. X. (2014) Cholesteryl ester accumulation induced by PTEN loss and PI3K/AKT activation. Cell Metab. 19, 393–406 10.1016/j.cmet.2014.01.019 [DOI] [PMC free article] [PubMed] [Google Scholar]
- 22. Lee B. H., Taylor M. G., Robinet P., Smith J. D., Schweitzer J., Sehayek E., Falzarano S. M., Magi-Galluzzi C., Klein E. A., and Ting A. H. (2013) Dysregulation of cholesterol homeostasis in human prostate cancer through loss of ABCA1. Cancer Res. 73, 1211–1218 10.1158/1538-7445.AM2013-1211,10.1158/0008-5472.CAN-12-3128 [DOI] [PMC free article] [PubMed] [Google Scholar]
- 23. Stopsack K. H., Gerke T. A., Andrén O., Andersson S. O., Giovannucci E. L., Mucci L. A., and Rider J. R. (2017) Cholesterol uptake and regulation in high-grade and lethal prostate cancers. Carcinogenesis 38, 806–811 10.1093/carcin/bgx058 [DOI] [PMC free article] [PubMed] [Google Scholar]
- 24. Han W., Gao S., Barrett D., Ahmed M., Han D., Macoska J. A., He H. H., and Cai C. (2018) Reactivation of androgen receptor-regulated lipid biosynthesis drives the progression of castration-resistant prostate cancer. Oncogene 37, 710–721 10.1038/onc.2017.385 [DOI] [PMC free article] [PubMed] [Google Scholar]
- 25. Sekine Y., Furuya Y., Nishii M., Koike H., Matsui H., and Suzuki K. (2008) Simvastatin inhibits the proliferation of human prostate cancer PC-3 cells via down-regulation of the insulin-like growth factor 1 receptor. Biochem. Biophys. Res. Commun. 372, 356–361 10.1016/j.bbrc.2008.05.043 [DOI] [PubMed] [Google Scholar]
- 26. Hong M. Y., Seeram N. P., Zhang Y., and Heber D. (2008) Chinese red yeast rice versus lovastatin effects on prostate cancer cells with and without androgen receptor overexpression. J. Med. Food 11, 657–666 10.1089/jmf.2007.0702 [DOI] [PubMed] [Google Scholar]
- 27. Syvälä H., Pennanen P., Bläuer M., Tammela T. L., and Murtola T. J. (2016) Additive inhibitory effects of simvastatin and enzalutamide on androgen-sensitive LNCaP and VCaP prostate cancer cells. Biochem. Biophys. Res. Commun. 481, 46–50 10.1016/j.bbrc.2016.11.021 [DOI] [PubMed] [Google Scholar]
- 28. Chou T. C., and Talalay P. (1984) Quantitative analysis of dose-effect relationships: the combined effects of multiple drugs or enzyme inhibitors. Adv. Enzyme Regul. 22, 27–55 10.1016/0065-2571(84)90007-4 [DOI] [PubMed] [Google Scholar]
- 29. Miraglia E., Högberg J., and Stenius U. (2012) Statins exhibit anticancer effects through modifications of the pAkt signaling pathway. Int. J. Oncol. 40, 867–875 [DOI] [PubMed] [Google Scholar]
- 30. Jung J., Lee C., Lee C., Kwon T., You D., Jeong I. G., Hong J. H., Ahn H., and Kim C. S. (2015) Effects of statin use on the response duration to androgen deprivation therapy in metastatic prostate cancer. Korean J. Urol. 56, 630–636 10.4111/kju.2015.56.9.630 [DOI] [PMC free article] [PubMed] [Google Scholar]
- 31. Harshman L. C., Wang X., Nakabayashi M., Xie W., Valenca L., Werner L., Yu Y., Kantoff A. M., Sweeney C. J., Mucci L. A., Pomerantz M., Lee G. S., and Kantoff P. W. (2015) Statin use at the time of initiation of androgen deprivation therapy and time to. JAMA Oncol. 1, 495–504 10.1001/jamaoncol.2015.0829 [DOI] [PMC free article] [PubMed] [Google Scholar]
- 32. Dai D., Holmes A. M., Nguyen T., Davies S., Theele D. P., Verschraegen C., and Leslie K. K. (2005) A potential synergistic anticancer effect of paclitaxel and amifostine on endometrial cancer. Cancer Res. 65, 9517–9524 10.1158/0008-5472.CAN-05-1613 [DOI] [PubMed] [Google Scholar]