Abstract
Mesangial matrix expansion is an important process in the initiation of chronic kidney disease, yet the genetic factors driving its development are unknown. Our previous studies have implicated Far2 as a candidate gene associated with differences in mesangial matrix expansion between mouse inbred strains. Consistent with the hypothesis that increased expression of Far2 leads to mesangial matrix expansion through increased production of platelet-activating factor precursors, we show that FAR2 is capable of mediating de novo platelet-activating factor synthesis in vitro and driven by the transcription factor NKX3.2. We demonstrate that knockdown of Far2 in mice delays the progression of mesangial matrix expansion with at least six months (equivalent to ~15 yr in human). Furthermore, we show that increased FAR2 expression in human patients is associated with diabetic nephropathy, lupus nephritis, and IgA nephropathy. Taken together, these results highlight FAR2’s role in the development of mesangial matrix expansion and chronic kidney disease.
Keywords: aging, kidney, mesangial matrix, mouse
INTRODUCTION
Decreased renal function is the main characteristic of chronic kidney disease (CKD) and ultimately leads to renal failure. One important process contributing to decreased renal function is mesangial matrix expansion (MME).
Mesangial cells are specialized cells in the glomeruli that provide structural support for the capillaries and regulate blood flow. They are the major contributor of the extracellular matrix in the glomeruli, which consists of fibronectin, type IV collagen, perlecan, laminin, and other proteins. There is a constant turnover of this extracellular matrix under normal conditions with a balance between production and degradation. However, some conditions (e.g., aging, diabetes, autoimmune disease such as lupus) will lead to an imbalance causing expansion, renal function decline, and inflammation (1). Identifying factors that drive this process is important as it allows us to better understand renal function decline and to identify more effective therapeutic targets.
We have previously identified the Far2 gene as one of these driving factors of MME in mice (18). This gene encodes the fatty acyl-CoA reductase 2, a reductase enzyme involved in the conversion of fatty acids to fatty alcohols (3). Genetic variation in Far2 is associated with Far2 expression levels and MME. This variation is a 9-base pair (bp) sequence that is located in the 5′-untranslated region (UTR) of the gene in all mouse inbred strains with MME, but absent in most inbred strain without MME. While this association is promising, it is still unclear how this variation leads to the observed changes in gene expression, what the role of Far2 is in MME, and whether this factor plays a role in human disease.
In this study, we address these questions and expand on the role of FAR2 in MME and kidney disease.
MATERIALS AND METHODS
Candidate transcription factor identification.
Far2 5′-UTR sequences from mouse strains C57BL/6 (containing the 9 bp sequence) and C3H/HeJ (lacking the 9 bp sequence) were analyzed for possible transcription factor binding sites with JASPAR CORE. Queries were restricted to transcription factors in mouse.
Electrophoretic mobility shift assay.
Gel mobility shift assays were performed with the Affymetrix Gel Shift Kit (Affymetrix). Nuclear extracts from SV40 mouse mesangial cells were isolated with the Affymetrix Nuclear Extraction Kit (Affymetrix) per manufacturer’s instructions. We incubated 4 μg of nuclear extract with 50 ng of biotin-labeled oligonucleotide probe (Integrated DNA Technologies) corresponding to the Far2 5′-UTR sequence with or without the 9 bp sequence at room temperature for 5 min with 1 μg poly d(I-C) and binding buffer. Binding reactions occurred in a thermal cycler at 15°C for 30 min. Samples were loaded onto a 6% DNA retardation gel (Invitrogen) and run for 55 min at 120 V at 4°C in 0.5× Tris-borate-EDTA (TBE) buffer. Nucleic acids were transferred with an electroblotting device to a positively charged nylon membrane in 0.5× TBE at 300 mA for 30 min. Membranes were then crosslinked with a Stratalinker UV Crosslinker, and the probe was detected with the Gel Shift Kit. Membranes were exposed to X-ray film and developed. The assay was repeated with purified human NKX3-2 protein (OriGene RC211285). A supershift assay was performed in a similar manner with the additional incubation of 1 mg anti-NKX3-2 (Abcam ab83288).
FAR2 pathway analysis.
A stable Far2-overexpressing mesangial cell line was established by transfecting MES13 cells with the pCMV6 plasmid (OriGene) containing the mouse Far2 cDNA clone NM_178797 with a Myc/DDK-tag (MR225671, OriGene) using 350 ng FuGENE and 100 ng of plasmid DNA. After transfection, cells were grown in selective media containing 125 μg/ml G418 for 3 wk. Single cell-derived clonal lines were then generated by flow-sorting, expanded, and characterized for Far2 mRNA with quantitative PCR and FAR2 protein expression by Western blot. Preservation of the mesangial phenotype was assessed by actin staining, measuring the response to angiotensin II, and soft agar colony formation. Platelet-activating factor (PAF) was measured with a commercial ELISA kit (Novatein Biosciences, cat. # NB-E20494). We incubated Far2-overexpressing mesangial cells with an equimolar mixture of 13C-palmitate and 12C-palmitate (100 μM each) for 24 h. Subsequently, the cells were washed with ice-cold PBS and flash-frozen in liquid nitrogen, and metabolites were extracted with methanol and chloroform. Samples were analyzed by liquid chromatography tandem mass spectrometry (LC/MS/MS) on an Agilent 1260 HPLC / 6530 Q-TOF mass spectrometer.
Animals.
B6N(Cg)-Far2tm2a(KOMP)Wtsi/2J mice were generated by the Knockout Mouse Phenotyping Program (KOMP2) at The Jackson Laboratory with C57BL/6N-derived embryonic stem cells provided by the International Knockout Mouse Consortium. Expression of Far2 was assessed by quantitative PCR on tissues with known Far2 expression (brain, eyelid) with primers that were designed to span an exon junction between exons 9 and 10 (forward primer 5′-CGGGTCCCAGCCATCATCTAT-3′, reverse primer 5′-CAGCCGGTTCATGAGCTTCAG-3′). All animals were housed at The Jackson Laboratory, which is approved by the American Association for Accreditation of Laboratory Animal Care. Animals were kept at a 12 h (6 AM–6 PM) light-dark cycle with a room temperature between 68 and 72°F and fed a standard rodent diet (5K52; LabDiet, St. Louis, MO). All comparisons were done with wild-type littermates of the same sex and age.
Renal histology and gene expression.
After euthanasia left kidneys were cut in half along the sagittal plane and placed in 4% paraformaldehyde in phosphate-buffered saline for 24 h at room temperature. The kidneys were embedded in paraffin, sectioned in 4–5 μm sections, stained with periodic acid-Schiff, and counterstained with hematoxylin with a Leica autostainer xl st5020. Hypertrophy, tubule-interstitial injury, and immune cell infiltration were assessed semiquantitative on blinded slides by two individuals.
To quantify mesangial matrix expansion, images were captured at ×40 and rotated freely to be in the same orientation. To obtain images containing glomeruli for analysis, we used a grid pattern over the kidney. We randomly defined a starting point on the upper left of the kidney with a field of view of 245 × 433 μm and then moved toward the right to a new view with 100% change of view. An alternating pattern of capture, skip, repeat was used until 50 glomeruli were fully captured within predetermined capture fields. Analysis of MME was then performed with Imagej (version 2.0.0-rc-43/1.50g). We defined regions of interest by manually outlining the capillary tuft and obtaining the area of the tuft. The image was then optically switched to HSB (hue, saturation, brightness). The saturation channel was thresholded for “pinkness,” and the percentage of stained material per glomeruli was calculated. This process was automated with a macroscript that can be found at https://github.com/TheJacksonLaboratory/MME. Saturation levels were batch dependent based on periodic acid-Schiff staining intensity. Each age cohort was stained as a batch, and the following settings were used: 6 mo saturation 90–255, 12 mo saturation 80–255, and 18 mo saturation 90–255.
Trichrome staining was performed on the same kidneys, and tissue fibrosis was quantified as previously described (13). For electron microscopy, small pieces of kidneys were fixed in 2.5% glutaraldehyde in PBS overnight at 4°C. After 3× PBS rinses, samples were then postfixed in 2% aqueous osmium tetroxide, rinsed in PBS, and then dehydrated with ethyl alcohol. Samples were then infiltrated and embedded with Embed 812 resin (Electron Microscopy Sciences, Hatfield, PA), and the blocks were polymerized in a 60°C oven for 48 h. We cut 90 nM sections on a Leica UC6 ultramicrotome, and sections were collected on 300 mesh copper grids. After staining with 1% aqueous uranyl acetate/Reynold’s lead citrate, we viewed grids on a JEOL JEM 1230 transmission electron microscope, and images were collected with an AMT 2K digital camera. NKX3.2 localization was performed by RNAScope following the protocol from Advanced Cell Diagnostics (Newark, CA) for their manual fluorescent assay on fresh frozen tissue sections. Images were taken with a Leica SP8 (Buffalo Grove, IL).
Tgfb1 expression was measured after reverse transcription of RNA with Qiagen Omniscript and a combination of oligoT and random primers. Real-time PCR was performed on a ViiA7 thermocycler (Applied Biosystems) using Applied Biosystems Power SYBR with the following primers: CAACATGTGGAACTCTACCAGAA and AGACAGCCACTCAGGCGTAT. We normalized expression with three “housekeeping” genes: Gapdh (TGGTGAAGGTCGGTGTGAAC and CAATGAAGGGGTCGTTGATGG), B2m (GTCTTTTCTGGTGCTTGTCTCA and GCGGGTGGAACTGTGTTAC), and Bact (GCTTCTTTGCAGCTCCTTCG and CCCACGATGGAGGGGAATAC).
Glomerular filtration rate and albuminuria.
For each time point (6, 12, and 18 mo), mice were weighed 1 wk before testing. A 5% FITC-inulin (Sigma, F3272) in 0.85% NaCl was prepared and dialyzed with a dialysis membrane (Spectrum Laboratories, MWCO 1KD 132636) for 24 h protected from light. The FITC-inulin solution was then filtered with a 0.2 μM syringe filter (VWR, 28145-477). Animals were anesthetized with isoflurane before a retro-orbital injection. FITC-inulin was injected at a dose of 3.74 μl × body weight (g) rounded to the nearest 10 μl. Serial blood samples were taken at precise time points (0, 3, 5, 7, 10, 15, 35, 56, and 75 min postinjection). Blood was collected from a nick in the tail for repeated tail tip bleeds; all blood was collected for a maximum duration of 1 min and a maximum quantity of 25 μl. For all samples, 5 μl of blood was aliquoted in triplicate into a 384-well plate and read on a fluorescent plate reader with emission at 484 nm and excitation at 535 nm (Molecular Devices, Spectramax i3). Triplicate readings were then taken and assessed for technical precision with a 10% coefficient of variation cut-off. Glomerular filtration rate (GFR) was calculated from two one compartment models each with y = A * exp(−B * x) + noise with the intersection being [log(a2) − log(a1)]/(k2 − k1) adapted from Hall et al. (7).
Spot urine was collected in the morning. Albumin and creatinine concentrations were measured on a Beckman AU680 Chemistry Analyzer. Actual mouse albumin concentrations were calculated by linear regression from a standard curve generated with mouse albumin standards (Kamiya Biomedical, Seattle, WA).
Patient characteristics and microarray expression.
Human renal biopsy specimens were procured through an international multicenter study, the European Renal cDNA Bank-Kroener-Fresenius (ERCB) biopsy bank. Renal biopsies were obtained as part of routine clinical care, and microdissected glomeruli were isolated from patients with diabetic nephropathy (n = 12), focal and/or segmental glomerulosclerosis (n = 24), IgA nephropathy (n = 27), membranous glomerulonephritis (n = 21), minimal change disease (n = 14), and lupus nephritis (n = 32) and profiled on Affymetrix microarrays. All biopsies were stratified by the reference pathologist of the ERCB according to their histological diagnoses. Histology reports, clinical data, and gene expression information were stored in a de-identified manner. A total of 452 microarrays from kidney biopsies were profiled, of which 130 patients were used for expression analysis. Demographic data of these 130 patients are provided in Table 1. Microdissection into glomerular compartments and Affymetrix-based gene expression profiling were performed as previously described (10). Affymetrix GeneChip Human Genome U133A 2.0 and U133 Plus 2.0 Arrays were used, and probe set annotation was performed with custom CDF version 19 from BrainArray (http://brainarray.mbni.med.umich.edu/Brainarray/Database/CustomCDF/genomic_curated_CDF.asp) (4). We restricted ourselves to the probe sets present on both platforms. Microarray data were batch corrected with ComBat (5, 9). Normalized expression files were uploaded on the Gene Expression Omnibus (GEO) website (2). Samples and median-centered gene expression values from earlier custom CDF annotations are also available in Nephroseq (https://www.nephroseq.org) and are available in GEO under accession number GSE47185 (11).
Table 1.
Demographics at time of biopsy of patients with CKD or healthy living donors for which FAR2 glomerular gene expression was assessed
| Disease Diagnosis or Living Donor Status | Samples, n | Sex | eGFR, ml/min/1.73 m2 | Age, yr |
|---|---|---|---|---|
| Diabetic nephropathy | 12 | 8 M/4 W | 52.9 ± 30.5 | 54.3 ± 11.0 |
| Focal segmental glomerulosclerosis | 24 | 12 M/12 W | 74.8 ± 34.0 | 45.1 ± 15.5 |
| IgA nephropathy | 27 | 19 M/8 W | 73.9 ± 37.1 | 35.9 ± 14.1 |
| Minimal change disease | 14 | 8 M/ 6 W | 97.5 ± 45.8 | 36.8 ± 17.7 |
| Membranous glomerulonephropathy | 21 | 12 M/9 W | 84.8 ± 40.2 | 53.3 ± 17.9 |
| Lupus nephritis | 32 | 7 M/25 W | 63.7 ± 29.4 | 34.7 ± 13.3 |
| Healthy living donors | 31 | 16 M/15 W | 106.7 ± 29.4 | 48.0 ± 11.6 |
Values are reported as means ± SD for estimated glomerular filtration rate (eGFR) and age. CKD, chronic kidney disease; M, man; W, woman.
Statistics.
Statistical analysis by a two-tailed Student’s t-test was performed with JMP (version 11), and values are expressed as means ± SE. Differences were considered statistically significant at P < 0.05. Mesangial matrix expansion data was analyzed by a linear mixed-effect model (lme4 package, https://github.com/lme4/lme4/) in R.
Study approval.
All animal studies were approved by The Jackson Laboratory's Institutional Animal Care and Use Committee. Biopsies were obtained from patients after informed consent and with approval of the local ethics committees.
RESULTS
Far2 expression differences in the mouse are caused by variation in an NKX3.2 transcription factor binding site.
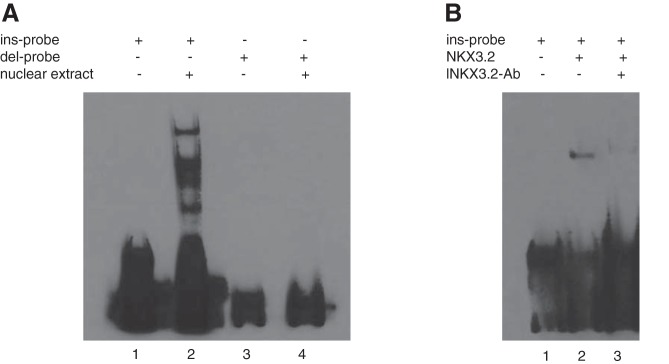
Based on our previous work we wanted to know the function of the 9 bp sequence in the 5′-UTR of Far2. Using an electrophoretic mobility shift assay (EMSA) we show that an oligonucleotide probe containing the 5′-UTR sequence binds a protein or proteins present in mouse mesangial cell nuclear extract when the 9 bp sequence is part of the probe sequence, but not when the 9 bp sequence is absent (Fig. 1A).
Fig. 1.
The 9 bp sequence in the 5′-untranslated region (UTR) of Far2 binds NKX3-2. A: electrophoretic mobility shift assay (EMSA) performed with nuclear extract from mouse mesangial cells incubated with biotin-labeled oligonucleotide probes corresponding to the Far2 5′-UTR sequences with (ins-probe) and without (del-probe) the 9 bp sequence (lanes 2 and 4, respectively). B: EMSA performed with purified NKX3-2 protein (lane 2). A supershift assay was performed with an antibody against NKX3-2 (lane 3).
Using JASPAR CORE, a database containing a curated, nonredundant set of profiles derived from published collections of experimentally defined transcription factor binding sites for eukaryotes (17), we compared the 5′-UTR sequence of C57BL/6J (containing the 9 bp sequence) with the sequence of C3H/HeJ (lacking the 9 bp sequence) and predicted that the 9 bp sequence is part of an NKX3.2 transcription factor binding site. We confirmed this by repeating the EMSA with purified NKX3.2. This leads to a shift with a single band at the same height as the main band of the incubation with the complete extract (Fig. 1B). Incubation with purified NKX3.2 and an antibody against NKX3.2 leads to a supershift. Therefore, the previously described differences in Far2 gene expression between mouse inbred strains is most likely caused by differential binding of the NKX3.2 transcription factor. Although the NKX3.2 antibody worked in the gel shift assay with purified NKX3.2 protein, it was not specific enough for localization in the kidney by immunohistochemistry. We therefore used an RNAScope probe for localization of the mRNA and show expression in most of the kidney, including mesangial cells (Fig. 2).
Fig. 2.
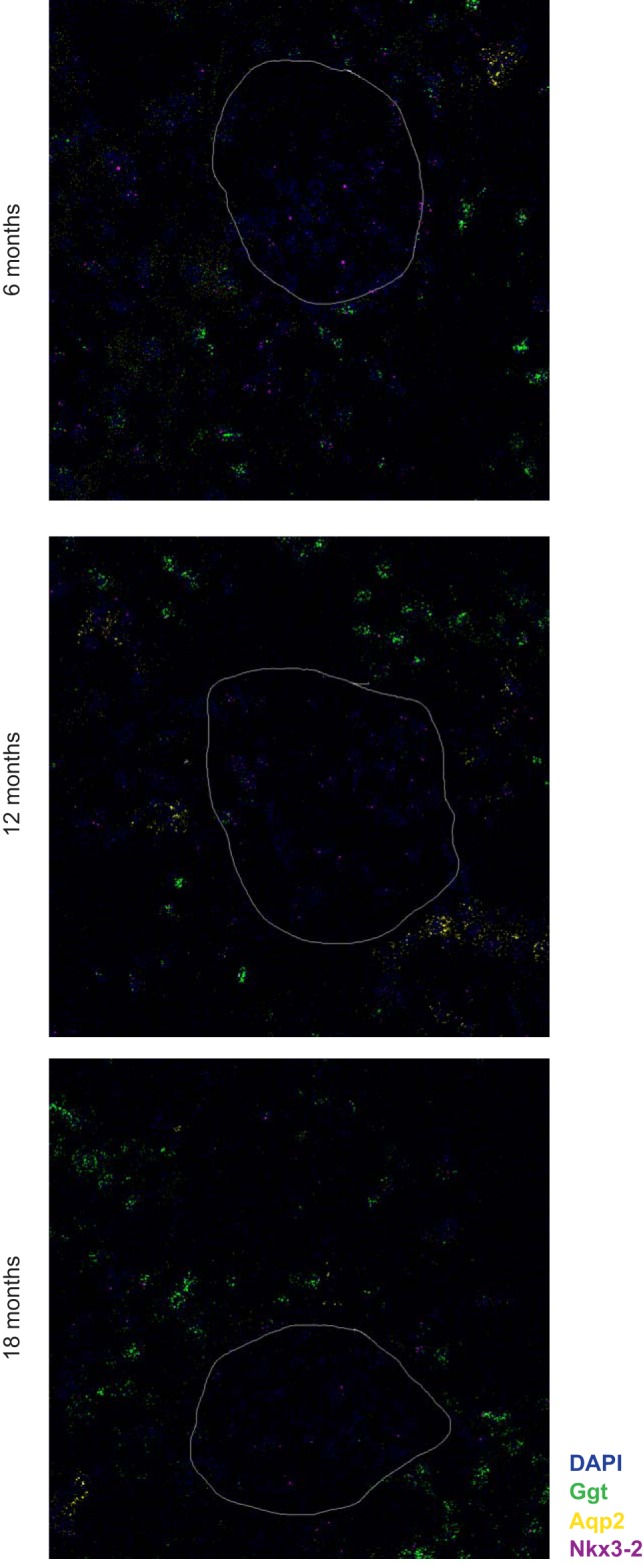
Localization of Nkx3-2 expression in the kidney by RNAScope probes. Representative images from 6, 12, and 18 mo old animals show Nkx3-2 expression (magenta) in most cells of the kidney including all cells in the glomerulus. In addition to probes for Nkx3-2, we used probes to identify the proximal tubule (Ggt, green) and the collecting duct (Aqp2, yellow). The white line indicates the outline of the glomerulus.
FAR2 is an enzyme in the PAF pathway.
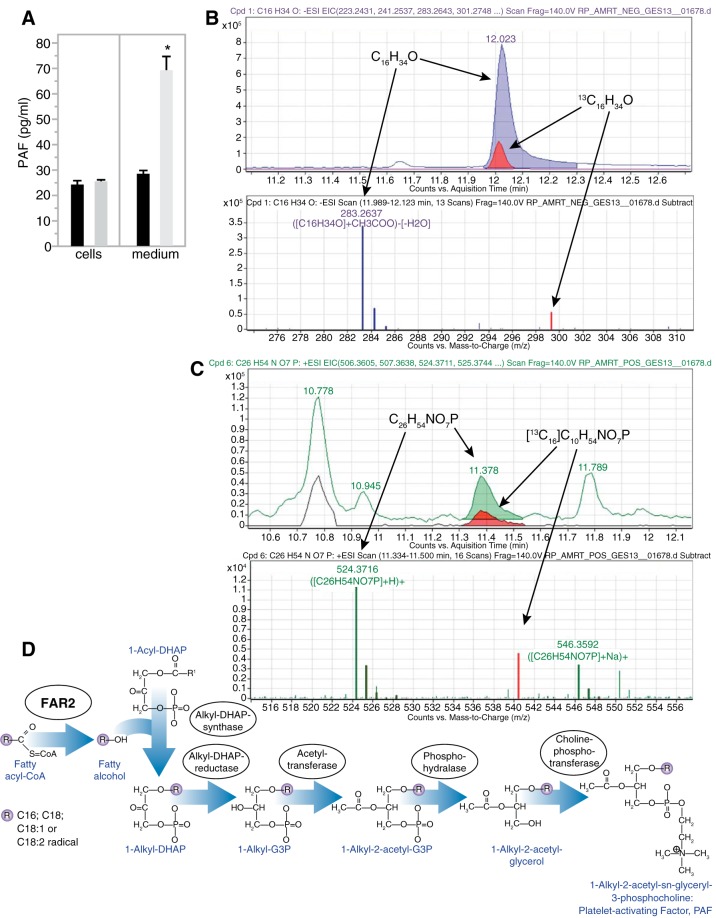
To determine the pathway through which FAR2 affects MME, we established a stable Far2-overexpressing mesangial cell line by transfecting MES13 cells with a plasmid containing a Myc/DDK-tagged mouse Far2 cDNA clone. To verify that integration of the plasmid did not dedifferentiate or transdifferentiate our cell line, we confirmed the preservation of various mesangial phenotypes (data not shown). We hypothesized that FAR2 is involved in PAF production. Comparison of PAF production between the overexpressing cell line and cells not containing the transgene showed a nearly threefold increase of PAF in the media (P = 0.0141), while PAF concentrations in the cells were not different (Fig. 3A). We hypothesized that increased FAR2 would lead to a higher conversion of palmitoyl-CoA to hexadecanol that is used for the de novo synthesis of PAF (Fig. 3B). After incubation with 13C-palmitate and subsequent detection by LC/MS/MS, we were able to detect 13C-labeled hexadecanol (Fig. 3C) and PAF (Fig. 3D), showing that the FAR2 enzyme is part of the PAF pathway.
Fig. 3.
Far2 is an enzyme involved in de novo platelet-activating factor (PAF) production. A: PAF concentration measured in both culture media and cell lysates between Far2-overexpressing (gray, n = 3) and wild-type (black, n = 3) mesangial cells. Labeled fatty alcohol (hexadecanol) (B) and PAF (C) were detected through mass spectrometry after a mixture of 13C- and 12C-palmitate was added to Far2-overexpressing cells. D: proposed pathway highlighting the role of FAR2 in de novo synthesis of PAF.
Reducing FAR2 expression in the mouse leads to a delay in MME.
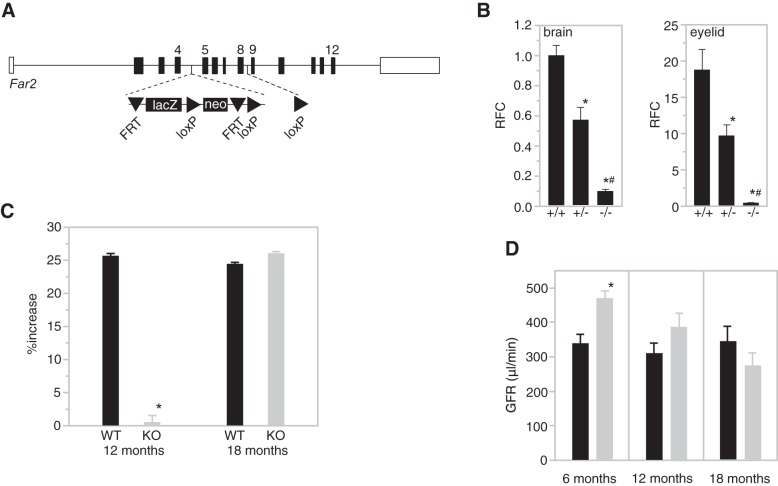
MME is most likely determined by multiple genes, each contributing a small amount of the variation within a population. To determine the contribution of Far2 on MME in vivo we generated mice from embryonic stem (ES) cells containing a gene trap cassette between exons 4 and 5 of the gene (Fig. 4A), which led to a 95% reduction in mRNA expression (Fig. 4B).
Fig. 4.
Generation and characterization of B6N(Cg)-Far2tm2a(KOMP)Wtsi/2J. A: a simplified scheme showing the wild-type Far2 allele and knock-in allele Far2tm2a(KOMP)Wtsi. The lacZ and neomycin expression cassette was inserted between exon 4 and exon 5 and is flanked by FRT (Flippase Recognition Target) sites. Exons 5–8 are flanked by loxP sites. B: quantitative PCR for Far2 on brain and eyelid of wild-type (+/+), heterozygous (+/−), and homozygous (−/−) knockout mice (n = 3/genotype) levels were calculated as relative fold change (RFC) compared with wild type. *P < 0.01 compared with +/+; #P < 0.01 compared with +/−. C: quantification of mesangial matrix expansion (MME) in knockout mice vs. wild-type mice at 12 and 18 mo of age relative to 6 mo measurements. MME is reported as percentage of the glomerular area occupied by matrix for 50 glomeruli per mouse and 10 mice per group. P = 1.27 × 10⁻⁶. D: glomerular filtration rate (GFR) data in knockout mice (gray) vs. wild-type mice (black) at 6, 12, and 18 mo of age. n = 10 per group. *P = 0.0118.
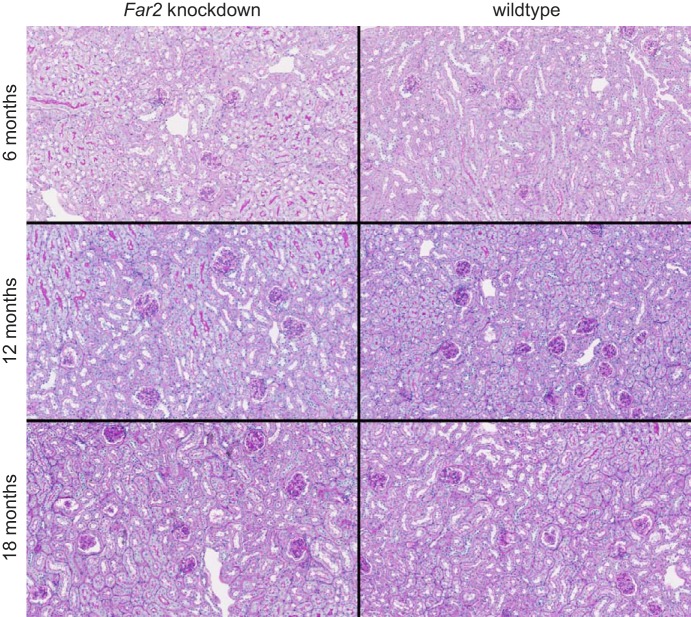
MME was compared between knockdown and wild-type mice at 6, 12, and 18 mo of age. Quantification of mesangial matrix at 6 mo showed equally low MME between knockdown and wild-type mice (72 vs. 66% total glomerular area occupied by matrix, Fig. 5) with no significant difference between the two groups. However, as shown in Fig. 4C, at 12 mo, wild-type mice had increased MME relative to 6 mo measurements (~25%), while knockdown mice showed no increase. At 18 mo, the knockdown mice showed the same high MME (89%) as the wild-type mice (~25% increase relative to 6 mo measurements). Representative images of wild-type and knockdown kidneys for all three ages are shown in Fig. 6). While this confirms our hypothesis that MME is not completely driven by the expression of Far2, knockdown leads to a significant delay of its development by at least 6 mo.
Fig. 5.
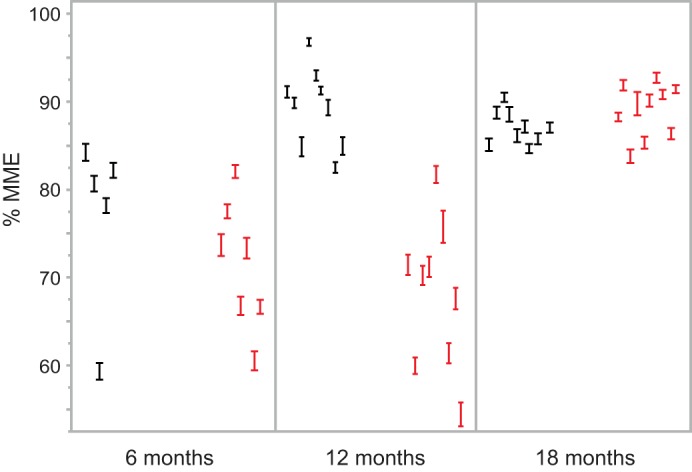
MME data from the individual animals in the study. For each animal the %MME (average ± SE) of 50 glomeruli is shown at the 3 ages for wild-type (black) and Far2 knockdown (red) animals.
Fig. 6.
PAS staining of Far2 knockdown and wild-type kidneys at 6, 12, and 18 mo of age. These images are representative for each of the cohorts and show increased MME in wild-type animals at 12 mo compared with 6 mo (and similar compared with 18 mo), while there is no increase in MME in the knockdown animals at 12 mo compared with 6 mo of age.
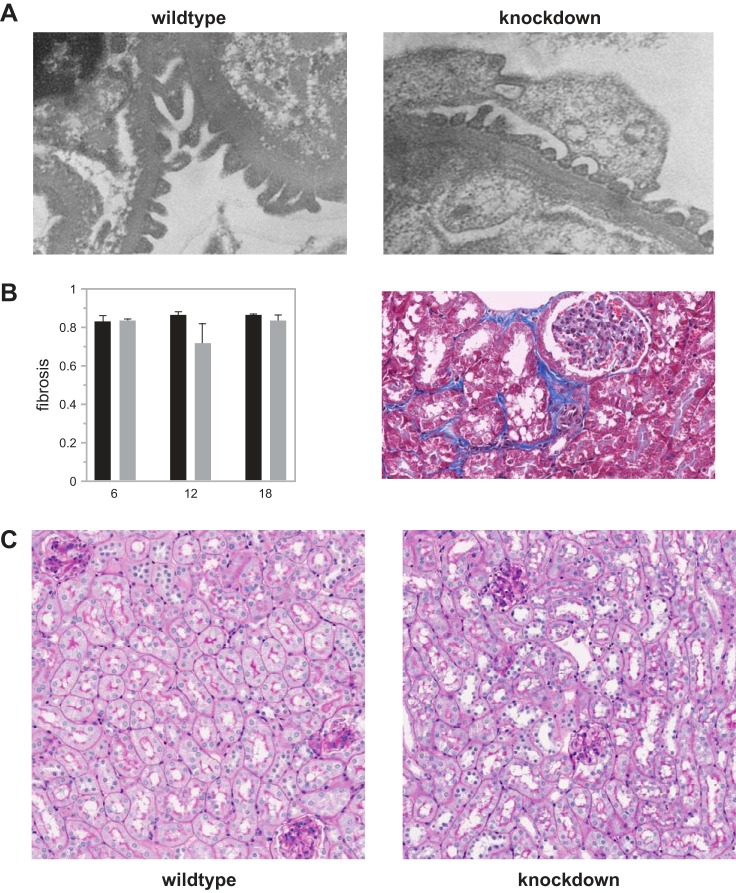
In addition to MME, we looked for differences in other histological phenotypes in the kidneys of wild-type and knockdown animals. We did not observe any differences in tubule-interstitial injury, podocyte effacement, renal fibrosis, or immune cell infiltration (Fig. 7). We measured Tgfb1 with real-time PCR in all 12 mo kidney samples and did not find a significant difference between wild-type and knockdown animals (data not shown).
Fig. 7.
Comparison between wild-type and Far2 knockdown animals for podocyte effacement (A), renal fibrosis (B), tubulo-interstitial damage, and immune cell infiltration (C). For podocyte effacement, tubulo-interstitial damage, and immune cell infiltration slides from 10 animals per group and 3 time points were scored independently by two people, and representative pictures from 12 mo old animals are shown. For renal fibrosis we quantified the fibrosis in all animals as described in materials and methods.
A significant difference (P = 0.0118) was observed for GFR at 6 mo, with higher GFR (481 ± 64 μl/min) in the knockdown animals compared with wild-type animals (381 ± 79 μl/min, Fig. 4D). This difference decreases with age and at 18 mo, when there is no difference in MME between wild-type and knockdown, there is also no difference in GFR. Albumin-to-creatinine ratios (ACR) were in the normal range between 7 and 85 mg/g with a mean of 32 mg/g with no differences between the three time points. There was no correlated with either MME or GFR.
Increased FAR2 expression is associated with human CKD.
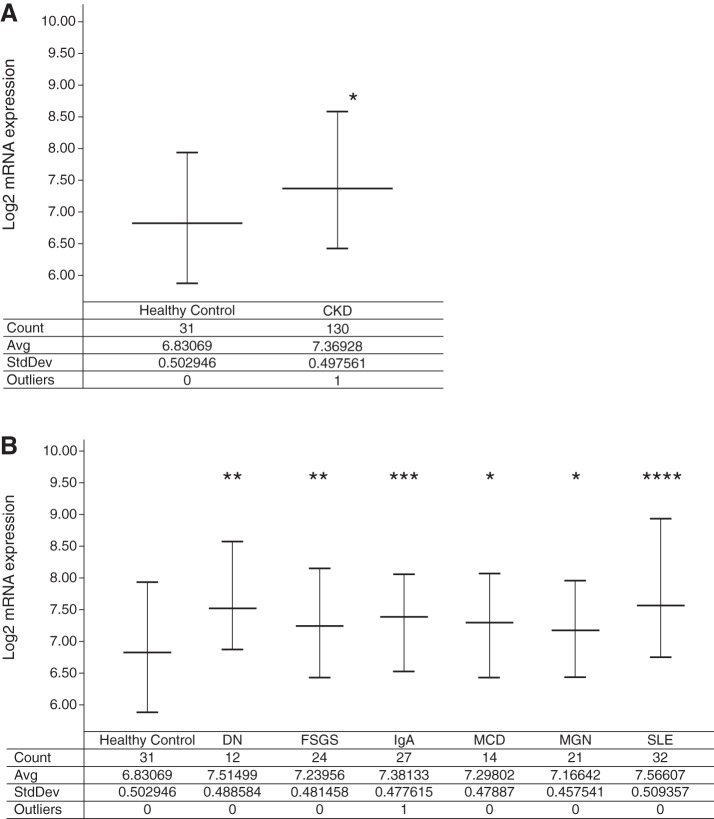
After establishing the effect of Far2 on MME in the mouse kidney we asked whether the human ortholog is relevant in human kidney disease. We analyzed the expression of FAR2 in CKD samples from the European Renal cDNA Bank (20). Renal biopsies were obtained as part of routine clinical care, and microdissected glomeruli were isolated from patients with various forms of kidney disease and profiled on Affymetrix microarrays. In comparison to 31 healthy living donors, FAR2 expression was significantly elevated in renal disease (1.45-fold, P < 0.00001) (Fig. 8A), and this finding was more prominent in males (1.55-fold, P < 0.0001, n = 66 CKD vs. n = 16 living donors) than in females (1.37-fold, P = 0.01, n = 64 CKD vs. n = 15 living donors). FAR2 expression was significantly elevated (P < 0.05) in all disease subsets investigated; however, the largest fold-change increases were observed in lupus nephritis (1.67-fold, P < 0.00001) and diabetic nephropathy (1.60-fold, P < 0.005) (Fig. 8B), which are associated with MME (16). FAR2 expression also displayed a modest negative correlation with GFR (P < 0.0005, r = −0.29) across the samples described above with corresponding GFR data (n = 155).
Fig. 8.
FAR2 expression in human patients. A: FAR2 is upregulated in the glomeruli isolated from chronic kidney disease (CKD) patients relative to healthy living donor samples. B: FAR2 is upregulated in the glomeruli isolated from diabetic nephropathy (DN), focal segmental glomerulosclerosis (FSGS), IgA nephropathy (IgA), minimal change disease (MCD), membranous glomerulonephropathy (MGN), and systemic lupus erythematosus nephritis (SLE). Significant P values are denoted by *P < 0.05, **P < 0.005, ***P < 0.0005, and ****P < 0.00001 relative to healthy living donor by a one-tailed Student’s t-test on nonlog-transformed expression data.
DISCUSSION
Our previous work associated a 9 bp insertion/deletion in the 5′-UTR of the Far2 gene with differences in MME between inbred mouse strains, showing that the presence of this insertion is responsible for an increase in expression (18).
Although we demonstrated that this specific 9 bp sequence affects Far2 expression, the mechanism through which this occurs was unknown. An obvious possibility is that it affects gene expression through the binding of a transcription factor. Here we confirm this using an EMSA in which a labeled probe containing the 9 bp sequence shows a shift after incubation with mesangial cell nuclear extract, while this shift is not observed using a similar probe lacking the 9 bp. A comparison between the two 5′-UTR sequences using the JASPAR CORE database predicted that the 9 bp sequence is part of an NKX3.2 transcription factor binding site. Performing the gel shift with purified NKX3.2 protein and purified NKX3.2 protein with an antibody against NKX3.2 confirmed this. The presence of multiple bands in the incubation of the complete extract (compared with the single band in the incubation with purified NKX3.2) is likely due to the formation of a transcriptional complex. This is consistent with previous studies that report NKX3.2 binding to DNA as part of a complex (14). Although NKX3.2 is mostly known as a transcriptional suppressor, it has been shown that it can function as a transcriptional activator (12). Interestingly, it has recently been shown that NKX3.2 can be regulated through phosphatidylinositol-3-kinase (PI3K) - Rac1 signaling (15), a pathway that has been implicated in mesangial cell matrix protein expression (8).
We hypothesized that a possible mechanism for MME, driven by increased Far2 expression, is through the increase of fatty alcohols that are produced by the Far2 encoded fatty acyl alcohol reductase 2, which can be used as precursors for PAF. This molecule has been shown to induce MME (19). We showed by transient transfection of a mouse mesangial cell line using a vector containing the Far2 cDNA that increased Far2 expression leads to an increase in PAF in the media. We confirmed this result by generating a cell line with constitutive overexpression of Far2 and adding 13C-labeled palmitate to the media of these cells. This leads to the incorporation of 13C into PAF.
We confirmed the association between Far2 expression and MME in vivo by testing the development of MME in a mouse strain developed using ES cells from the KOMP consortium. Leakage of the splice acceptor in similar constructs with other target genes has been observed and warranted close examination of Far2 expression in this strain. Kidneys of our newly developed strain did not show any detectable Far2 expression by Western blot (data not shown). However, Far2 in the kidney is expressed at a very low level. Hence, there might be expression that is below our detection range. When performing quantitative PCR on tissues with high Far2 expression (brain and eyelid) we detect expression levels that are 5% of that in wild-type animals. Therefore, we cannot be certain that this strain is a complete knockout for Far2 in the kidney. However, studying a hypomorph model with low expression instead of a complete knockout may be more desirable as human FAR2 knockouts have not been reported and our model with decreased expression would mimic the human situation more closely. Comparison between our strain and wild-type animals suggests that knockdown of Far2 does not prevent MME, as we do not see a difference when mice are aged to 18 mo. This result is not surprising as MME is likely to be determined by multiple factors and different pathways. Inhibiting only one of these factors would not completely prevent MME. However, we do measure a significant delay in the development. Although it is difficult to directly compare age between mouse and human, a 6 mo difference in this phase of the life of the mouse is equivalent to delaying MME from a 45 yr old to a 60 yr old human (6).
To determine whether the human ortholog for Far2 plays a role in kidney disease we compared FAR2 expression in kidneys from CKD patients and healthy controls and observe a significant increase in CKD patients. When looking at specific diagnoses we especially see an increase in patients with diabetic nephropathy and lupus nephritis in which MME plays an important role in the initiation of the disease. The 5′-UTR of several human FAR2 transcripts (ENST00000536681 and ENST00000182377) have predicted NKX3.2 binding sites. Although not within the NKX3.2 binding motif, both sites contain SNPs (rs554833676 and rs527566632, respectively) that are within several base pairs of the motif and might affect binding.
In conclusion, we show that FAR2 is part of a pathway involved in mesangial matrix regulation and increased expression of the gene is a driver of MME, possibly through an increase of PAF. The importance of FAR2 in human kidney disease is suggested by the increase in renal FAR2 expression that we see in CKD patients. Differences in human FAR2 expression, like in mice, might also be partly driven by variation in the NKX3.2 binding site. Inhibition of this pathway could be a potential therapy and this is supported by our data in Far2 knockdown mice. Although knockdown of Far2 does not prevent MME, it delays it by at least 6 mo, a period that is equivalent to ~15 yr in human. Delaying progression of CKD and renal failure (and thereby dialysis or transplantation) for such a period in the human population would have a significant impact on patient outcomes and quality of life. It is likely that FAR2 is not the only driver of MME and that it is a complex genetic trait. This is suggested by the fact that not all mouse inbred strains with the 9 bp sequence develop MME and the failure of decreasing MME significantly in the MRL strain when deleting the 9 bp sequence. Efforts are underway to identify these additional genes.
GRANTS
This work was funded by AG-038070 from the National Institute on Aging and National Cancer Institute Cancer Core Grant CA-034196 to The Jackson Laboratory.
DISCLOSURES
No conflicts of interest, financial or otherwise, are declared by the authors.
AUTHOR CONTRIBUTIONS
G.B., S.E., S.M.S., Y.T., A.R., and H.S.S. performed experiments; G.B., S.E., S.M.S., Y.T., A.R., and H.S.S. analyzed data; G.B. drafted manuscript; G.B., S.E., S.M.S., Y.T., A.R., H.S.S., M.K., and R.K. approved final version of manuscript; S.E., S.M.S., Y.T., A.R., H.S.S., M.K., and R.K. interpreted results of experiments; Y.T., A.R., and R.K. prepared figures; M.K. and R.K. edited and revised manuscript; R.K. conceived and designed research.
REFERENCES
- 1.Abrass CK, Adcox MJ, Raugi GJ. Aging-associated changes in renal extracellular matrix. Am J Pathol 146: 742–752, 1995. [PMC free article] [PubMed] [Google Scholar]
- 2.Barrett T, Wilhite SE, Ledoux P, Evangelista C, Kim IF, Tomashevsky M, Marshall KA, Phillippy KH, Sherman PM, Holko M, Yefanov A, Lee H, Zhang N, Robertson CL, Serova N, Davis S, Soboleva A. NCBI GEO: archive for functional genomics data sets–update. Nucleic Acids Res 41, D1: D991–D995, 2013. doi: 10.1093/nar/gks1193. [DOI] [PMC free article] [PubMed] [Google Scholar]
- 3.Cheng JB, Russell DW. Mammalian wax biosynthesis. I. Identification of two fatty acyl-Coenzyme A reductases with different substrate specificities and tissue distributions. J Biol Chem 279: 37789–37797, 2004. doi: 10.1074/jbc.M406225200. [DOI] [PMC free article] [PubMed] [Google Scholar]
- 4.Dai M, Wang P, Boyd AD, Kostov G, Athey B, Jones EG, Bunney WE, Myers RM, Speed TP, Akil H, Watson SJ, Meng F. Evolving gene/transcript definitions significantly alter the interpretation of GeneChip data. Nucleic Acids Res 33: e175, 2005. doi: 10.1093/nar/gni179. [DOI] [PMC free article] [PubMed] [Google Scholar]
- 5.Edgar R, Domrachev M, Lash AE. Gene Expression Omnibus: NCBI gene expression and hybridization array data repository. Nucleic Acids Res 30: 207–210, 2002. doi: 10.1093/nar/30.1.207. [DOI] [PMC free article] [PubMed] [Google Scholar]
- 6.Flurkey K, Currer JM, Harrison DE. Mouse models in aging research. In: The Mouse in Biomedical Research (2nd Ed.), edited by Fox JG, Barthold SW, Davisson MT, Newcomer CE, Quimby FW, Smith AL. New York: Elsevier, 2007, vol. 3, p. 637–672. [Google Scholar]
- 7.Hall JE, Guyton AC, Farr BM. A single-injection method for measuring glomerular filtration rate. Am J Physiol Renal Physiol 232: F72–F76, 1977. doi: 10.1152/ajprenal.1977.232.1.F72. [DOI] [PubMed] [Google Scholar]
- 8.Hubchak SC, Sparks EE, Hayashida T, Schnaper HW. Rac1 promotes TGF-beta-stimulated mesangial cell type I collagen expression through a PI3K/Akt-dependent mechanism. Am J Physiol Renal Physiol 297: F1316–F1323, 2009. doi: 10.1152/ajprenal.00345.2009. [DOI] [PMC free article] [PubMed] [Google Scholar]
- 9.Johnson WE, Li C, Rabinovic A. Adjusting batch effects in microarray expression data using empirical Bayes methods. Biostatistics 8: 118–127, 2007. doi: 10.1093/biostatistics/kxj037. [DOI] [PubMed] [Google Scholar]
- 10.Ju W, Eichinger F, Bitzer M, Oh J, McWeeney S, Berthier CC, Shedden K, Cohen CD, Henger A, Krick S, Kopp JB, Stoeckert CJ Jr, Dikman S, Schröppel B, Thomas DB, Schlöndorff D, Kretzler M, Böttinger EP. Renal gene and protein expression signatures for prediction of kidney disease progression. Am J Pathol 174: 2073–2085, 2009. doi: 10.2353/ajpath.2009.080888. [DOI] [PMC free article] [PubMed] [Google Scholar]
- 11.Ju W, Greene CS, Eichinger F, Nair V, Hodgin JB, Bitzer M, Lee Y-S, Zhu Q, Kehata M, Li M, Jiang S, Rastaldi MP, Cohen CD, Troyanskaya OG, Kretzler M. Defining cell-type specificity at the transcriptional level in human disease. Genome Res 23: 1862–1873, 2013. doi: 10.1101/gr.155697.113. [DOI] [PMC free article] [PubMed] [Google Scholar]
- 12.Kawato Y, Hirao M, Ebina K, Shi K, Hashimoto J, Honjo Y, Yoshikawa H, Myoui A. Nkx3.2 promotes primary chondrogenic differentiation by upregulating Col2a1 transcription. PLoS One 7: e34703, 2012. doi: 10.1371/journal.pone.0034703. [DOI] [PMC free article] [PubMed] [Google Scholar]
- 13.Kennedy DJ, Vetteth S, Periyasamy SM, Kanj M, Fedorova L, Khouri S, Kahaleh MB, Xie Z, Malhotra D, Kolodkin NI, Lakatta EG, Fedorova OV, Bagrov AY, Shapiro JI. Central role for the cardiotonic steroid marinobufagenin in the pathogenesis of experimental uremic cardiomyopathy. Hypertension 47: 488–495, 2006. doi: 10.1161/01.HYP.0000202594.82271.92. [DOI] [PubMed] [Google Scholar]
- 14.Kim D-W, Lassar AB. Smad-dependent recruitment of a histone deacetylase/Sin3A complex modulates the bone morphogenetic protein-dependent transcriptional repressor activity of Nkx3.2. Mol Cell Biol 23: 8704–8717, 2003. doi: 10.1128/MCB.23.23.8704-8717.2003. [DOI] [PMC free article] [PubMed] [Google Scholar]
- 15.Kim J-A, Im S, Cantley LC, Kim D-W. Suppression of Nkx3.2 by phosphatidylinositol-3-kinase signaling regulates cartilage development by modulating chondrocyte hypertrophy. Cell Signal 27: 2389–2400, 2015. doi: 10.1016/j.cellsig.2015.09.004. [DOI] [PMC free article] [PubMed] [Google Scholar]
- 16.Kurogi Y. Mesangial cell proliferation inhibitors for the treatment of proliferative glomerular disease. Med Res Rev 23: 15–31, 2003. doi: 10.1002/med.10028. [DOI] [PubMed] [Google Scholar]
- 17.Mathelier A, Fornes O, Arenillas DJ, Chen C-Y, Denay G, Lee J, Shi W, Shyr C, Tan G, Worsley-Hunt R, Zhang AW, Parcy F, Lenhard B, Sandelin A, Wasserman WW. JASPAR 2016: a major expansion and update of the open-access database of transcription factor binding profiles. Nucleic Acids Res 44, D1: D110–D115, 2016. doi: 10.1093/nar/gkv1176. [DOI] [PMC free article] [PubMed] [Google Scholar]
- 18.Noordmans GA, Caputo CR, Huang Y, Sheehan SM, Bulthuis M, Heeringa P, Hillebrands J-L, van Goor H, Korstanje R. Genetic analysis of mesangial matrix expansion in aging mice and identification of Far2 as a candidate gene. J Am Soc Nephrol 24: 1995–2001, 2013. doi: 10.1681/ASN.2012080838. [DOI] [PMC free article] [PubMed] [Google Scholar]
- 19.Reznichenko A, Korstanje R. The role of platelet-activating factor in mesangial pathophysiology. Am J Pathol 185: 888–896, 2015. doi: 10.1016/j.ajpath.2014.11.025. [DOI] [PMC free article] [PubMed] [Google Scholar]
- 20.Yasuda Y, Cohen CD, Henger A, Kretzler M; European Renal cDNA Bank (ERCB) Consortium . Gene expression profiling analysis in nephrology: towards molecular definition of renal disease. Clin Exp Nephrol 10: 91–98, 2006. doi: 10.1007/s10157-006-0421-z. [DOI] [PubMed] [Google Scholar]


