Abstract
Objective
We tested the hypothesis that the maximally treated intracerebral hemorrhage (max-ICH) score is superior to the ICH score for characterizing mortality and functional outcome prognosis in patients with ICH, particularly those who receive maximal treatment.
Methods
Patients presenting with spontaneous ICH were enrolled in a prospective observational study that collected demographic and clinical data. Mortality and functional outcomes were measured by using the modified Rankin Scale at 3 months. The ICH score and max-ICH score incorporate measures of symptom severity, age, hematoma volume, hematoma location, and intraventricular hemorrhage, with the max-ICH score also including a term for oral anticoagulation and having 16 score categories vs 11 for the ICH score. We compared the area under the receiver operating characteristic curve (AUC) for the ICH score and max-ICH score for both mortality and poor functional outcome, defined as modified Rankin Scale scores 4–6.
Results
We analyzed outcomes for 372 patients, including 71 patients (19%) in whom care limitation/withdrawal of life support was instituted. Both the ICH score and max-ICH score showed good prognostic performance for 3-month mortality and poor functional outcomes in the full group as well as the subgroup with maximal treatment (i.e., no care limitations; AUC range 0.80–0.86), with no significant difference in AUC between the scores for either endpoint in either group.
Conclusions
External validation with direct comparison of the ICH score and max-ICH score shows that their prognostic performance is not meaningfully different. Alternatives to simple scores are likely needed to improve prognostic estimates for patient care decisions.
Accurate prognostication is essential for guiding the care of patients with intracerebral hemorrhage (ICH), but prognostication models for ICH outcome have proven unreliable. One issue is the inability of common prognostic scores to account for the effects of early complications, which strongly influence outcomes.1 Separately, “self-fulfilling prophesies” based on initial impressions may lead to care limitations in cases with severe initial symptoms, perhaps inappropriately.2 Providing full intensive treatment, i.e., “maximal treatment,” and avoiding new do-not-resuscitate orders during the first 5 days after ICH has been found to reduce observed mortality compared to predictions based on historical controls using the ICH score.3 A new prognostic score for patients with ICH, the max-ICH score, has recently been proposed as superior to the ICH score, particularly for patients who receive maximal treatment and whose risk of poor outcomes may be inflated by ICH score prognosis.4 Expert consensus stipulates that unvalidated models should not be used in clinical practice because derivation studies typically overestimate the accuracy of newly fitted models, and recommends external validation of newly derived models (a type 4 analysis by the Transparent Reporting of a Multivariable Prediction Model for Individual Prognosis or Diagnosis [TRIPOD] Statement rubric).5–7 Moreover, at least 10 prognostic scores for ICH outcome have been proposed, with several, including the ICH functional outcome score (ICH-FOS) and Essen-ICH score, showing superior performance to the ICH score, but none have displaced the ICH score in routine use.8 Thus, we sought to confirm the hypothesis that the max-ICH score is meaningfully superior to the ICH score for characterizing mortality and functional outcome prognosis in patients with ICH, particularly those who receive maximal treatment, by external validation.
Methods
Patients presenting to Northwestern Memorial Hospital with spontaneous ICH between January 2010 and March 2017 were prospectively enrolled in an observational study, as previously reported in detail.1 Briefly, all patients were diagnosed by a board-certified neurointensivist. Patients with ICH attributed to trauma, hemorrhagic conversion of ischemic stroke, structural lesions, or vascular malformations were excluded. All patients were admitted to and managed in a neuro-intensive care unit. The Glasgow Coma Scale (GCS) score and NIH Stroke Scale (NIHSS) score were prospectively recorded at the time of initial evaluation by a trained neurologist and/or neurosurgeon. Demographic information, medical history, medication history, standardized clinical instruments (GCS, pre-ICH modified Rankin Scale [mRS]), pretreatment blood pressure, laboratory data, imaging data including hematoma volumes using Analyze software (Mayo Clinic, Rochester, MN) by a semiautomated process, medical management variables, surgical interventions, and medical complications were prospectively recorded, along with the mRS score at 3 months obtained by a validated interview, as we have recently reported in detail.1
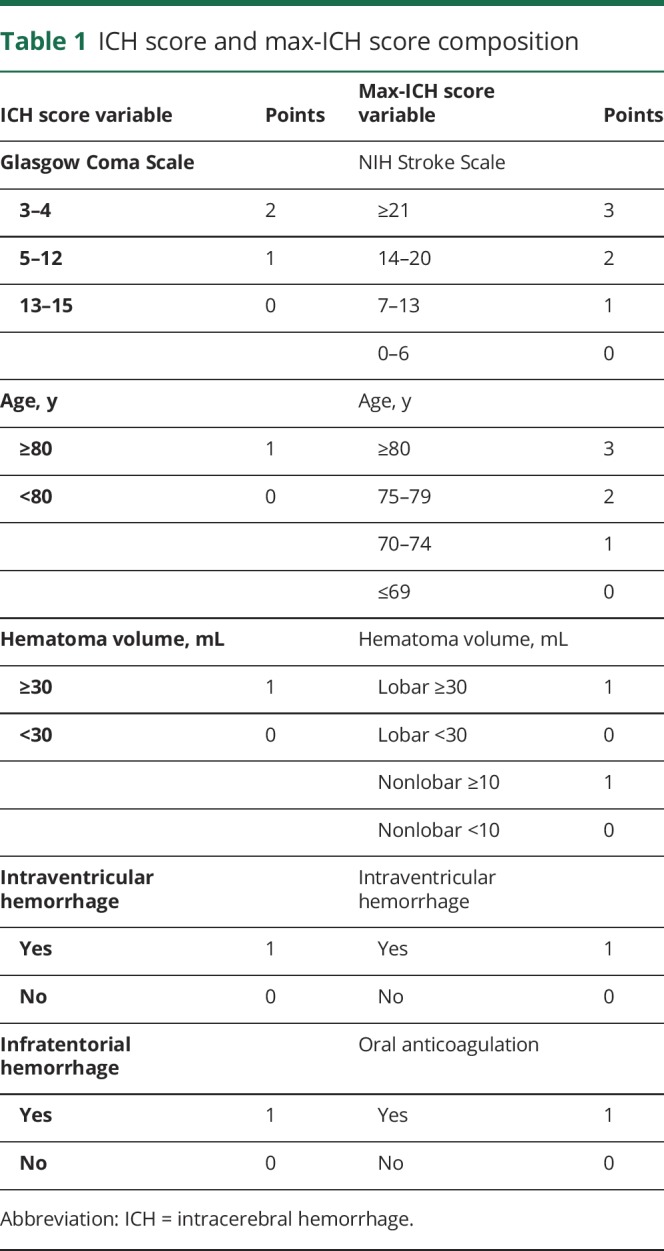
Maximal treatment was defined as the absence of early care limitations within the intensive care stay, including withdrawal of life support or palliative withholding of life-sustaining treatments in favor of comfort-based end-of-life care, which was recorded contemporaneously in this prospective group. The ICH score and max-ICH score were calculated as specified in prior studies (table 1).4,9 Both incorporate measures of clinical symptom severity, patient age, hematoma volume, hematoma location, and presence of intraventricular hemorrhage, with the max-ICH score also including a term for oral anticoagulation and having 16 score categories vs 11 for the ICH score. We constructed receiver operating characteristic (ROC) curves for mortality and poor functional outcome, defined as mRS scores 4–6, at 3 months. We assessed the predictive accuracy of the prognostic scores by calculating the area under the curve (AUC) of the ROC curves using the nonparametric method in the full group of patients with ICH as well as the “maximally treated” patients, identical to the methods of the derivation study.4 The differences in the AUC of the ROC curves for the ICH score and max-ICH score were compared for significance as described by Hanley and McNeil, identical to the method used in the max-ICH score derivation study.4
Table 1.
ICH score and max-ICH score composition
Standard protocol approvals, registrations, and patient consents
The study was approved by the institutional review board. Written informed consent was obtained from the patient or their legally authorized representative. The institutional review board approved a waiver of consent for patients who died during initial hospitalization, or who were incapacitated and for whom a legal representative could not be located.
Data availability
Anonymized data not published within this article will be shared by request from any qualified investigator for the purpose of replicating the results.
Results
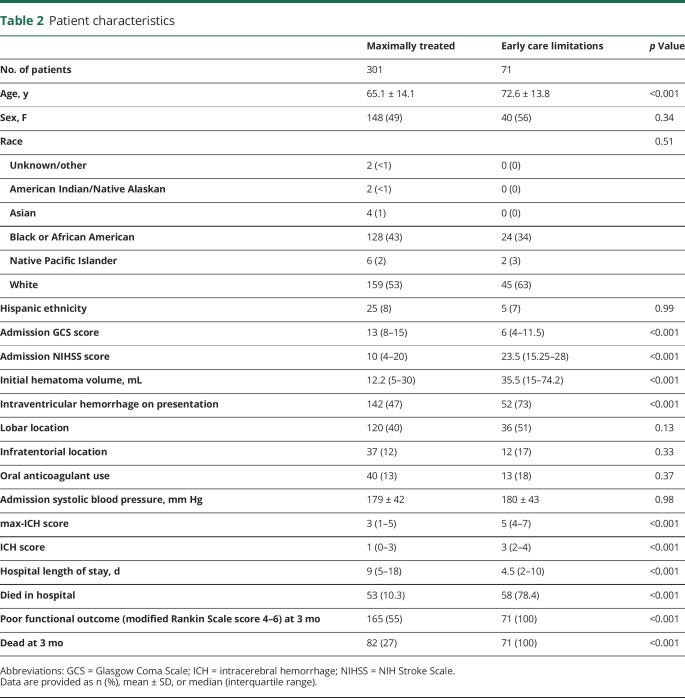
Among 558 patients, we were unable to obtain 3-month follow-up in 186, yielding 372 patients (mean 67 ± 14 years old, 51% female, 55% white) with requisite data for analysis. There was no difference in initial clinical severity by ICH score between surviving patients lost to follow-up and those in whom follow-up was obtained either in the full cohort (p = 0.28) or the maximally treated group (p = 0.51) or in patient age (p = 0.35 and p = 0.24, respectively). Consent was not obtained in 4% of eligible patients presenting to our medical center. There were 71 patients (19%) in whom early care limitation/withdrawal of life support was instituted, with the remaining 301 patients receiving maximal treatment. The demographic and clinical characteristics of the patients are summarized in table 2. We prospectively recorded transfer status and found no association between outcome and transfer status either on univariate tests or in a model that corrects for ICH score (transfer status p = 0.992).
Table 2.
Patient characteristics
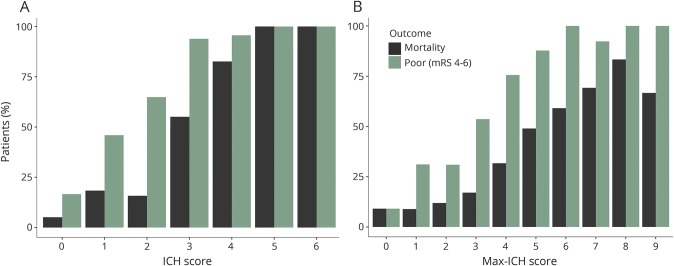
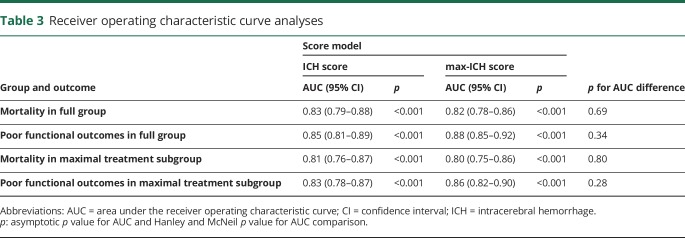
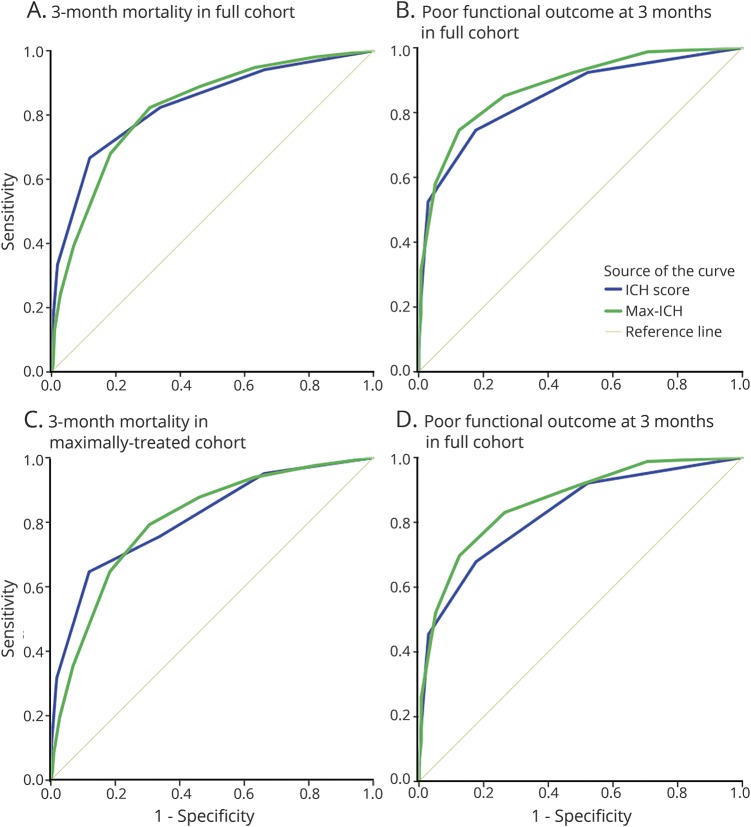
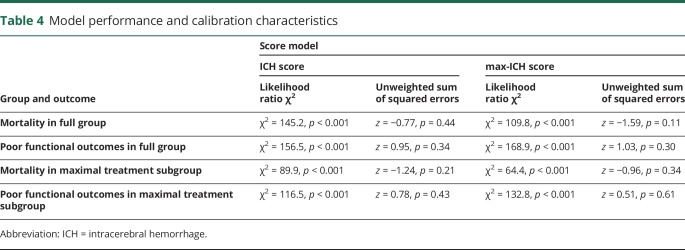
Figure 1 shows observed mortality and poor outcome rates for each rank of the ICH score and max-ICH score in the maximally treated group. The Spearman correlation coefficient for the ICH score and max-ICH score in the full group was 0.81 (p < 0.0001) and 0.79 (p < 0.0001) in the maximally treated subgroup. In the full group, both the ICH score and max-ICH score showed good prognostic performance (all ROC AUC >0.8 with asymptotic p values <0.001) for 3-month mortality and poor functional outcomes with no significant difference in AUC between the 2 scores. Similarly, in the maximally treated subgroup, the ICH score and max-ICH score showed good prognostic performance (all ROC AUC >0.8, 95% confidence intervals ranged ±0.03–0.05, all p < 0.001) for mortality and poor functional outcomes with no significant difference in AUC between the 2 scores. The ROC analyses are summarized in table 3 and shown graphically in figure 2. The overall predictive performance of the models was confirmed by the likelihood ratio χ2 test (all p < 0.001) with no significant issues with model calibration detected (unweighted sum of squared errors test for goodness of fit all nonsignificant; table 4).
Figure 1. Mortality and poor outcome by ICH score and max-ICH score rank.
Observed mortality (black) and poor outcome (green) rates are shown for the ICH score (A) and max-ICH score (B) for each score rank in the maximally treated group. ICH = intracerebral hemorrhage; mRS = modified Rankin Scale.
Table 3.
Receiver operating characteristic curve analyses
Figure 2. ROC curves for ICH score and max-ICH score for 3-month mortality and poor outcome.
ROC curves are shown for the ICH score and max-ICH score for prediction of mortality and poor functional outcomes at 3 months in the full group (n = 372, panels A and B) and the maximal treatment subgroup (n = 301, panels C and D). ICH = intracerebral hemorrhage; ROC = receiver operating characteristic.
Table 4.
Model performance and calibration characteristics
Discussion
In this observational study of patients with spontaneous ICH selected by the same criteria as the max-ICH derivation study, we found that the ICH score and max-ICH score are both good predictors of 3-month mortality and functional outcomes, but the performance of the max-ICH score is not demonstrably superior to the ICH score in either the full group of patients or in patients who receive maximal treatment. The similar performance of the 2 scores is likely explained by their similar composition. The ICH score and max-ICH score comprise a strongly correlated clinical severity score (GCS and NIHSS, respectively) along with terms to adjust for hematoma volume and location, age, and intraventricular hemorrhage, with the only distinct variable being oral anticoagulation exposure in the max-ICH score.4,9 The size of this validation set is approximately the size of the derivation and validation sample sizes of the ICH score combined, and well within the recommended ideal size (minimum n = 100, ideal n ≥ 200) for a prognostic score validation sample.7 Any nonidentical scores can be shown to have different accuracies given a sufficiently large sample. The conclusion here is not that the null hypothesis has been proven, but that, based on the confidence intervals of our AUC point estimates, we infer that any observable difference in predictive performance between these 2 scores is small and unlikely to be clinically meaningful.
External validation of prognostic scores is imperative and often neglected, although performance in derivation cohorts usually exaggerates a model’s predictive accuracy due to overfitting, unique characteristics of the derivation cohort, and other factors.5,10 Although many thousands of papers are published per year reporting new prognostic scores or clinical prediction rules (e.g., 15,662 in 2005), a very small number undergo validation and are found sufficiently superior to enter clinical use and influence physician behavior or patient outcomes.11 For example, the publication of the ICH-FOS score, which included large derivation and validation samples, compared its performance to 8 other published ICH severity scales, and despite reporting modestly superior accuracy of the ICH-FOS and Essen-ICH scores compared to the ICH score, a shift to their use has not been observed.8 Other studies comparing the ICH score to other novel or modified scores have yielded similarly findings.12,13 Most recently, in fact, 7 ICH prognostic scores including the max-ICH score were compared for prediction of functional outcomes and death in a registry of 2,851 Chinese patients (or 2,581 patients per the abstract) representing a mixture of maximally treated and nonmaximally treated patients.14 There was no difference between the accuracy of the ICH score and max-ICH score for predicting death (AUC 0.81 for both scores, p = 0.85), but the max-ICH score was found to be inferior to both the ICH-FOS and Essen-ICH scores (AUC 0.83, p < 0.001, and AUC 0.83, p = 0.005, respectively). For functional outcomes, while the performance of the max-ICH score was superior to the ICH score (AUC 0.83 vs 0.77, p = 0.003), it was similar to ICH-FOS (AUC 0.85, p = 0.36) and inferior to Essen-ICH (AUC 0.84, p < 0.001). There was no separate analysis of maximally treated patients.14 The results of this validation study suggest that the superior performance of the max-ICH score compared to the ICH score in the max-ICH derivation study may be associated with relative overfitting.
While several severity metrics have been proposed to assess patients with ICH, the ICH score has been formally externally validated, is the most widely used risk adjustment score in clinical ICH research, and is now the standardized core measure (CSTK-03) required to be collected for every ICH admission to comprehensive stroke centers accredited by the Joint Commission.9 Replacing the well-entrenched ICH score would require a compellingly improved system, and marginal improvements in prognostication based on initial findings may be an unfruitful pathway. At least 10 ICH severity scales have been derived and published without any emerging as sufficiently superior to the ICH score to supplant it. Only so much about the future is truly knowable at the time of admission, which limits the performance of prognostic scores based on admission data, yet other approaches may be useful. Delayed reassessment is a promising alternative. The majority of neurologic changes, both improvement and deterioration, occur early, and early reassessment can capture and incorporate those useful data to yield a more informative prognostic picture.1 Moreover, a prospective study has confirmed that delaying goals of care decision making in ICH reduces overall mortality.3 Finally, experienced practitioners discern prognosis better than simple prognostic scores in patients with ICH, incorporating knowledge about comorbidities and other factors not considered in score formulas.15,16
The characteristics of the study participants are similar to the derivation study. Although noncategorical variables cannot be statistically compared, patients were generally near 70 years old, and about 5 years older in the care limitations group. ICH scores were 3 and 1 in the early care limitation and maximally treated groups here compared to 4 and 1 in the derivation study, and NIHSS scores were 23.5 and 10 in the current study vs 29 and 11 in the original. Large differences in intraventricular hemorrhage and hematoma volume were present between the care limitation and maximal care groups in both studies, as expected.
Although this study conforms to recommendations of the TRIPOD Statement, there are limitations because of differences between the derivation study and this study. Maximal treatment was defined in the max-ICH score derivation study by excluding patients with care limitations instituted within the first 24 hours, as determined retrospectively. We excluded patients with care limitations occurring anytime within their intensive care stay as prospectively recorded in our database. The inclusion of patients with later intensive care unit care limitations may account for some of the difference in prognostic score performance between the original study and this validation study. Our broader definition of care limitations may capture more instances of self-fulfilling poor outcome due to later care withdrawal and nonmaximal treatment, but the influence of different definitions of maximal treatment is not known. Moreover, it remains possible that customary care practices and ethnographic factors differ between North American and European centers in that the effects of early care limitations differ in groups like the German derivation sample of the max-ICH score in such a way that the max-ICH score may demonstrate superiority. Similarly, this is a single-center study in which some institutional practices may not generalize. We were unable to obtain functional outcomes in approximately one-third of patients treated in our center. The initial clinical severity and ages were not different between the analyzed patients and patients missing follow-up data, either in the maximally treated or full groups. Because the components of these 2 scores are similar, a pattern of missing data influencing one much greater than the other is unlikely, but we cannot exclude the possibility that a biased pattern of missing data influenced our results. There were differences in the way functional outcomes were measured. The max-ICH derivation study used 12-month mRS as the primary outcome measure, which they primarily obtained by responses on a mailed questionnaire, and used a propensity score matching technique to estimate theoretical outcomes that may have been observed in patients who had early care limitations.4 This study used 3-month mRS as the primary outcome. We may have missed measuring late improvements in some patients. Other studies have shown that functional improvements after ICH happen mostly within the first 3 months, and that improvements between 3 and 12 months are too slight to measure by mRS.17,18 Not having measured late improvements in functional outcomes would affect the results of this study if the max-ICH score were uniquely more sensitive to predicting late changes between 3 and 12 months. Moreover, we used a structured interview technique to ascertain the mRS score, which has been validated as reliable.1 Finally, the sample size of the maximally treated subgroup (301 patients) is not large enough to validate a small difference between the ICH score and max-ICH score. A much larger cohort of maximally treated patients with ICH could be used to confirm a small magnitude of superiority of one prognostic scoring system over others, just as the Essen-ICH score was confirmed to be modestly superior to the max-ICH score and ICH score in unselected patients.8,14 Citing the 10 related publications, the summary of this topic in the American Heart Association Guidelines for the Management of Spontaneous Intracerebral Hemorrhage appears to have held true over time: “Numerous grading scales exist specifically for ICH. Although the optimal severity scale is not yet clear, the most widely used and externally validated is the ICH score. These severity scales should not be used as a singular indicator of prognosis.”19
Glossary
- AUC
area under the receiver operating characteristic curve
- FOS
functional outcome score
- GCS
Glasgow Coma Scale
- ICH
intracerebral hemorrhage
- mRS
modified Rankin Scale
- NIHSS
NIH Stroke Scale
- ROC
receiver operating characteristic
- TRIPOD
Transparent Reporting of a Multivariable Prediction Model for Individual Prognosis or Diagnosis
Author contributions
Dr. Schmidt: interpretation of the data and revising the manuscript for intellectual content. Dr. Liotta: acquisition of data, interpretation of the data, and revising the manuscript for intellectual content. Dr. Prabhakaran: interpretation of the data and revising the manuscript for intellectual content. Dr. Naidech: design of the study, acquisition of data, interpretation of the data, and revising the manuscript for intellectual content. Dr. Maas: design and conceptualization of the study, acquisition of data, analysis and interpretation of the data, drafting the manuscript, and revising the manuscript for intellectual content.
Study funding
Dr. Schmidt receives support as a fellow of the BIH Charité Clinician Scientist Program funded by Charité – Universitätsmedizin Berlin and the Berlin Institute of Health. Dr. Liotta receives support from National Center for Advancing Translational Sciences grant KL2TR001424 and NIH grant L30 NS098427. Dr. Naidech receives support from Agency for Healthcare Research and Quality grant K18 HS023437. Dr. Maas receives support from NIH grants K23 NS092975 and L30 NS080176. Research reported in this publication was supported, in part, by the NIH's National Center for Advancing Translational Sciences grant UL1 TR000150. The content is solely the responsibility of the authors and does not necessarily represent the official views of the NIH or the Agency for Healthcare Research and Quality.
Disclosure
The authors report no disclosures relevant to the manuscript. Go to Neurology.org/N for full disclosures.
References
- 1.Maas MB, Francis BA, Sangha RS, Lizza BD, Liotta EM, Naidech AM. Refining prognosis for intracerebral hemorrhage by early reassessment. Cerebrovasc Dis 2017;43:110–116. [DOI] [PMC free article] [PubMed] [Google Scholar]
- 2.Zahuranec DB, Brown DL, Lisabeth LD, et al. Early care limitations independently predict mortality after intracerebral hemorrhage. Neurology 2007;68:1651–1657. [DOI] [PubMed] [Google Scholar]
- 3.Morgenstern LB, Zahuranec DB, Sanchez BN, et al. Full medical support for intracerebral hemorrhage. Neurology 2015;84:1739–1744. [DOI] [PMC free article] [PubMed] [Google Scholar]
- 4.Sembill JA, Gerner ST, Volbers B, et al. Severity assessment in maximally treated ICH patients: the max-ICH score. Neurology 2017;89:423–431. [DOI] [PubMed] [Google Scholar]
- 5.Altman DG, Vergouwe Y, Royston P, Moons KG. Prognosis and prognostic research: validating a prognostic model. BMJ 2009;338:b605. [DOI] [PubMed] [Google Scholar]
- 6.Collins GS, Reitsma JB, Altman DG, Moons KG. Transparent Reporting of a Multivariable Prediction Model for Individual Prognosis or Diagnosis (TRIPOD): the TRIPOD Statement. BMJ 2015;350:g7594. [DOI] [PubMed] [Google Scholar]
- 7.Collins GS, Ogundimu EO, Altman DG. Sample size considerations for the external validation of a multivariable prognostic model: a resampling study. Stat Med 2016;35:214–226. [DOI] [PMC free article] [PubMed] [Google Scholar]
- 8.Ji R, Shen H, Pan Y, et al. A novel risk score to predict 1-year functional outcome after intracerebral hemorrhage and comparison with existing scores. Crit Care 2013;17:R275. [DOI] [PMC free article] [PubMed] [Google Scholar]
- 9.Clarke JL, Johnston SC, Farrant M, Bernstein R, Tong D, Hemphill JC III. External validation of the ICH score. Neurocrit Care 2004;1:53–60. [DOI] [PubMed] [Google Scholar]
- 10.Hemingway H, Riley RD, Altman DG. Ten steps towards improving prognosis research. BMJ 2009;339:b4184. [DOI] [PubMed] [Google Scholar]
- 11.Toll DB, Janssen KJ, Vergouwe Y, Moons KG. Validation, updating and impact of clinical prediction rules: a review. J Clin Epidemiol 2008;61:1085–1094. [DOI] [PubMed] [Google Scholar]
- 12.Godoy DA, Pinero G, Di Napoli M. Predicting mortality in spontaneous intracerebral hemorrhage: can modification to original score improve the prediction? Stroke 2006;37:1038–1044. [DOI] [PubMed] [Google Scholar]
- 13.Parry-Jones AR, Abid KA, Di Napoli M, et al. Accuracy and clinical usefulness of intracerebral hemorrhage grading scores: a direct comparison in a UK population. Stroke 2013;44:1840–1845. [DOI] [PubMed] [Google Scholar]
- 14.Suo Y, Chen WQ, Pan YS, et al. The max-intracerebral hemorrhage score predicts long-term outcome of intracerebral hemorrhage. CNS Neurosci Ther Epub 2018 Mar 12. [DOI] [PMC free article] [PubMed]
- 15.Hwang DY, Dell CA, Sparks MJ, et al. Clinician judgment vs formal scales for predicting intracerebral hemorrhage outcomes. Neurology 2016;86:126–133. [DOI] [PMC free article] [PubMed] [Google Scholar]
- 16.Hwang DY, Chu SY, Dell CA, et al. Factors considered by clinicians when prognosticating intracerebral hemorrhage outcomes. Neurocrit Care 2017;27:316–325. [DOI] [PubMed] [Google Scholar]
- 17.Sreekrishnan A, Leasure AC, Shi FD, et al. Functional improvement among intracerebral hemorrhage (ICH) survivors up to 12 months post-injury. Neurocrit Care 2017;27:326–333. [DOI] [PMC free article] [PubMed] [Google Scholar]
- 18.Hemphill JC III, Farrant M, Neill TA Jr. Prospective validation of the ICH score for 12-month functional outcome. Neurology 2009;73:1088–1094. [DOI] [PMC free article] [PubMed] [Google Scholar]
- 19.Hemphill JC III, Greenberg SM, Anderson CS, et al. Guidelines for the management of spontaneous intracerebral hemorrhage: a guideline for healthcare professionals from the American Heart Association/American Stroke Association. Stroke 2015;46:2032–2060. [DOI] [PubMed] [Google Scholar]
Associated Data
This section collects any data citations, data availability statements, or supplementary materials included in this article.
Data Availability Statement
Anonymized data not published within this article will be shared by request from any qualified investigator for the purpose of replicating the results.


