Figure 2.
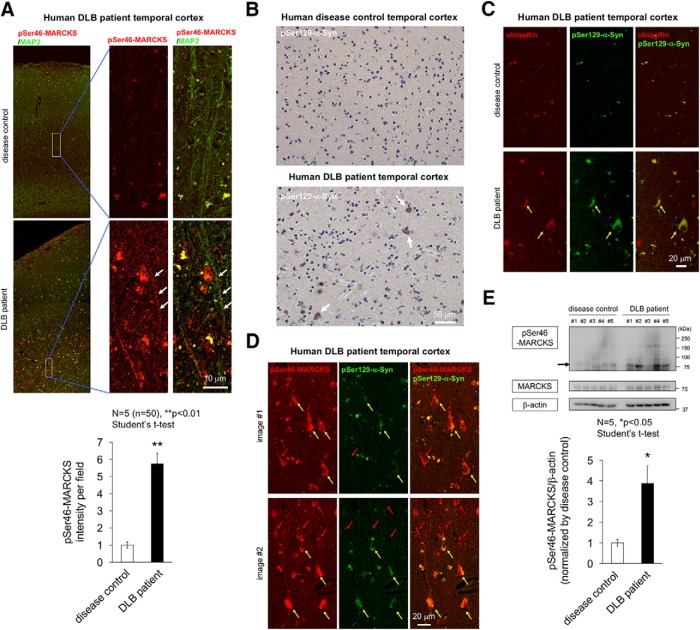
Immunohistochemistry of human DLB brains. A, Costaining of pSer46-MARCKS with MAP2. Low and high magnification of temporal lobes from non-neurologic disease control patients (5 females) and human DLB patients (5 females). Images were acquired on an Olympus FV1200 IX83 confocal microscopy. All bar graphs indicate averages and SEM. In each patient, quantitative analyses of signal intensities (mean pixel intensities) were performed in 10 visual fields (100 × 100 μm) randomly selected from the corresponding area. Statistical analyses were performed with Student’s t test; **, p < 0.01. B, Staining of pSer129-α-Syn revealed multiple cytoplasmic inclusions (Lewy bodies) in the same patient group. C, Costaining of ubiquitin with pSer129-α-Syn. D, Costaining of pSer46-MARCKS with pSer129-α-Syn. E, Western blotting analysis of temporal lobes from non-DLB control patients and DLB patients with antibody against pSer46-MARCKS, total MARCKS, and β-actin. Graph shows the quantitative result of pSer46-MARCKS from 5 patients and 5 non-neurologic disease controls. The band intensity was normalized against β-actin. Statistical analyses were performed with Student’s t test; *, p < 0.05.

