Figure 5.
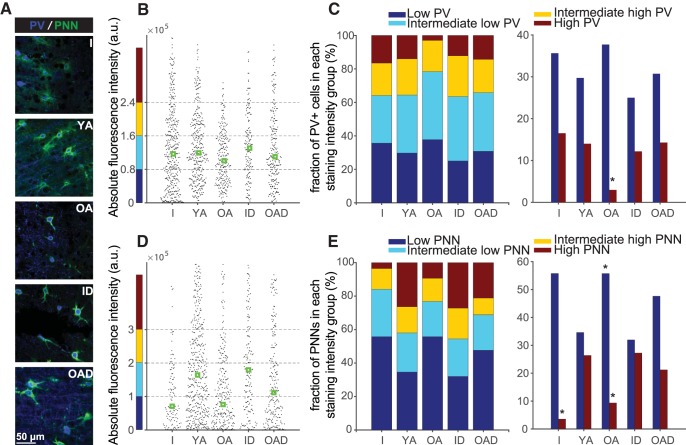
Impact of age on structural inhibitory elements in the auditory cortex. A, High-power microphotographs of representative sections immunolabeled for perineuronal nets (PNN) and parvalbumin (PV) from immature (I), young adult (YA), old adult, immature + diazepam treatment (IA), and old adult + diazepam treatment (OAD) rats. B, D, Group fluorescence optical density for (B) PV and (D) PNN staining for each age group (all cortical layers; green boxes represent median values). C, E, Distribution of (C) PV cell and (E) PNN intensity staining for each age group. Fig. 5-1 compares A1 GABA concentration between YA and OA rats. Cell count per field for different neuronal types and age groups are detailed in Fig. 5-2. Fig. 5-3 shows representative micrographs of PV- and SST-positive cells. A summary of the cumulative distribution of staining intensity and interindividual variability for all groups is provided in Fig. 5-4. Number of hemispheres examined: I = 12, YA = 12, OA = 12, ID = 6, OAD = 6; total cell count per group: I = 418, YA = 343, OA = 236, ID = 156, OAD = 231. Values shown are mean ± SEM. *p < 0.05 relative to YA; Kruskal–Wallis test, corrected for multiple comparisons using Tukey–Kramer test.

