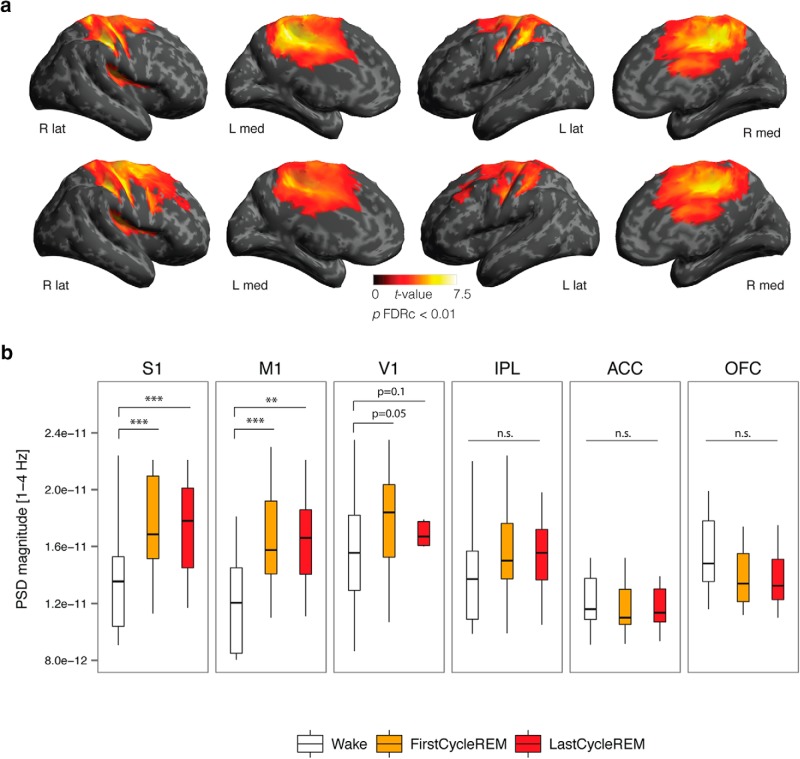
Figure 3.
A, Source topography of increased δ power [1–4 H] in the first (top row) and last (bottom row) cycle of REM sleep contrasted with wake; t values are plotted for all vertices (two-tailed, paired t test) exhibiting significant differences between states (p < 0.05) after correcting for multiple comparisons using topological FDR cluster correction (height threshold: p < 0.01). B, Compared to wake, increased δ power was observed in primary sensory (S1), primary motor (M1), and primary visual (V1) cortices, but was not significantly increased in IPL, ACC, or OFC associative regions. The bottom and top of the boxes show the 25th and 75th percentiles (the lower and upper quartiles), respectively; the inner band shows the median; and the whiskers show the upper and lower quartiles ±1.5× the interquartile range (IQR). Asterisks indicate significant differences between states (*p < 0.05, **p < 0.01, ***p < 0.001; one-tailed paired t test).

