

Summary
TCR signaling strength generally correlates with peptide-MHC binding affinity; however, exceptions exist. We find high-affinity, yet non-stimulatory interactions occur with high frequency in the human T cell repertoire. Here, we studied human TCRs that are refractory to activation by pMHC ligands despite robust binding. Analysis of 3D affinity, 2D dwell-time, and crystal structures of stimulatory versus non-stimulatory TCR-pMHC interactions failed to account for their different signaling outcomes. Using yeast pMHC display, we identified peptide agonists of a formerly non-responsive TCR. Single-molecule force measurements demonstrated the emergence of catch-bonds in the activating TCR-pMHC interactions, correlating with exclusion of CD45 from the TCR-APC synapse. Molecular dynamics simulations of TCR-pMHC disengagement distinguished agonist from non-agonist ligands based on the acquisition of catch bonds within the TCR-pMHC interface. The isolation of catch bonds as a parameter mediating the coupling of TCR binding and signaling has important implications for TCR and antigen engineering for immunotherapy.
Keywords: TCR, MHC, Ligand discrimination, Catch bond, Signaling, Structure, CD45, Molecular dynamics
In brief
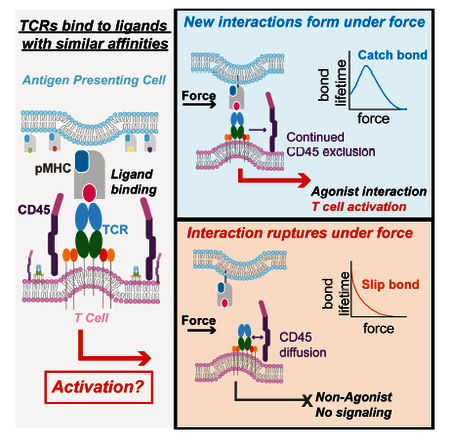
While stimulatory and non-stimulatory ligands can bind to T cell receptors with similar affinity, only the stimulatory ligands form catch bonds that strengthen under force and serve as a check to couple activation and signaling.
Introduction
Adaptive immune responses are initiated by T cell receptor (TCR) recognition of peptides presented by major histocompatibility molecules (pMHC). TCR engagement with an agonist pMHC leads to phosphorylation of CD3 immunoreceptor tyrosine-based activation motifs (ITAMs), initiating a cascade of downstream signaling that results in T cell activation (Chakraborty and Weiss, 2014). Despite the low 3D affinity (KD~1–100 M) of the TCR-pMHC interaction, the potency of the T cell response has been shown to generally reflect the strength, or duration, of a particular interaction (Allison et al., 2016; Gottschalk et al., 2012; Govern et al., 2010). Studies using altered peptide ligands (APLs) found that TCR signaling is strongly correlated with TCR-pMHC 2D binding affinity, kinetics, and 2D confinement time (Aleksic et al., 2010; Huang et al., 2010; Huppa et al., 2010; Klammt et al., 2015). However, the 3D affinities of strong and weak agonist ligands for a single T cell clone can be similar, and at times, overlapping (Degano et al., 2000; Stone et al., 2009), or even uncorrelated (Kalergis et al., 2001; Kersh et al., 1998; Zehn et al., 2009). The molecular parameters underlying these discrepancies have remained elusive.
TCR signaling is influenced by parameters beyond the affinity of TCR for pMHC (Adams et al., 2011; Kim et al., 2009; Su et al., 2016). For example, force-dependent interactions are a characteristic of agonist pMHC ligands (Hong et al., 2015; Kim et al., 2012; Liu et al., 2014). TCRs form catch bonds with agonist ligands, during which the bond lifetime of the interaction extends under force (Hong et al., 2015; Liu et al., 2014; Liu et al., 2016). Exclusion of the phosphatase CD45 from membrane contacts initiates TCR signaling independent of pMHC ligands (Chang et al., 2016). Several studies have described T cell clones that engaged with pMHC yet were unresponsive when simulated by the isolating peptide (Adams et al., 2011; Bentzen et al., 2016; Moon et al., 2007; Rubio-Godoy et al., 2001; Yu et al., 2015).
The existence of binding but non-activating pMHC ligands presents a unique opportunity to probe the TCR triggering processes with regard to TCR-pMHC structure, conformational changes, the role of biophysical interaction parameters, and the role of CD45 segregation. We sought to study examples of naturally occurring non-agonist TCR-pMHC interactions in order to isolate properties responsible for this discrepant observation. We found that non-agonist TCR-pMHC interactions occur often in vivo. Using complementary methodologies, we examined two TCRs specific for HLA B35-HIV(Pol448–456), one of which exhibited impaired signaling despite exhibiting a robust binding interaction (Ueno et al., 2004). Selections on a pMHC yeast display library identified stimulatory peptide ligands for the signaling-refractive TCR that differed by as little as a methylene group. Detailed biophysical characterization of agonist and non-agonist interactions of the same TCR revealed two parameters that correlated with potent signaling: formation of catch bonds and segregation of CD45. We used steered molecular dynamics based on crystal structures of the agonist and non-agonist complexes to develop a molecular model of TCR-pMHC catch bond formation. Catch bonds represent a net gain of molecular interactions under force – revealing an additional level of dynamic diversity built-in as a proofreading mechanism to link TCR recognition and subsequent activation. Collectively, our study revealed a triggering mechanism by which TCR ligation and activation can be decoupled to regulate TCR ligand discrimination.
Results
Observation of T cells that engage pMHC yet are not activated
Several studies have described T cell clones which bind to fluorescently labeled class I and class II pMHC-tetramers, yet are unresponsive to peptide stimulation (Bentzen et al., 2016; Moon et al., 2007; Su et al., 2013). We therefore explored the prevalence of this phenomenon in the human T cell repertoire. T cells were stained with fluorescent pMHC tetramers, sorted to single cells, and expanded non-specifically ex vivo. To confirm specificity, these clones were re-stained with the pMHC tetramer and stimulated with the specific peptide to assess responsiveness (Figure 1A). We identified both responsive and non-responsive T cell clones isolated with HLA DR4-HIV(Gag164–183) fluorescent-tetramers. We compared a pMHC-responsive clone, TCR6 (Figures 1 B–E; top panels), to a non-responsive clone, TCR11 (Figures 1B–E; bottom panels). While both clones bound their cognate pMHC-tetramer (Figure 1B), only TCR6 proliferated, secreted cytokines, and down-regulated TCR in response to pMHC. TCR11 failed to mount a response (Figure 1 C–E). Both T cell clones down-regulated TCR and proliferated in response to non-specific TCR stimulation (Figure 1E, Figure S1). We confirmed that the nonstimulatory response was TCR-mediated by transducing TCR6 or 11 into a TCR αβ-deficient cell line. Both T cell lines robustly secreted IL-2 in response to anti-CD3 (OKT3) stimulation; however, there was a substantial difference in IL-2 secretion upon stimulation with DR4-HIV(Gag164–183) (Figure S2).
Figure 1. Observation of non-agonist interactions in vivo.

(A) Schematic depiction of the experimental approach used to identify non-agonist interactions. (B) Tetramer staining of T cell clones with DR4-HIV(Gag164–183) and DR4-HA (background control) (C) CFSE dilution of T cell clones stimulated with cognate antigen HIV (blue) and an irrelevant HA peptide (gray) (D) IL-2 and IFN production in response to HIV(Gag164–183). (E) TCR downregulation in response to HIV stimulation (red), CD3-CD28 beads (blue), PHA (gray). (B-E) TCR6 (Top), TCR11 (Bottom). (F) Representative HLA-A2-HCV(NS3) tetramer staining and (G) functional response by CD107a in T cell clones. (H) HLA A2-HY tetramer staining, and (I) functional response by CD107a. (F-I) Staining or stimulation with irrelevant pre-proinsulin (PPI) peptide represented in gray. (J) Summary of frequency of non-stimulatory clones from (Yu et al., 2015). (K) B35-HIV(Pol448–456) tetramer staining (100 nM) of transduced cell lines expressing TCR55 (orange), TCR589 (blue), or untransduced (gray). (L) IL-2 secretion by TCR55 (orange) or TCR589 (blue) transduced T cells. Representative data (n=3) is shown as mean±SD of technical triplicates. See also Figure S1.
We surveyed T cell clones initially isolated via pMHC tetramer binding using HLA A2*01 restricted Hepatitis C Virus (HCV) NS3 variant peptides (KLVALGINAV, L5N, and L5M), as well as the HY self-antigen (FIDSYICQV) (Yu et al., 2015) (Figure 1F–I, Figure S1). While most of the clones in the data sets were capable of activation, a fraction (ranging from 15–72%) were tetramer-positive yet did not produce an antigen-specific response (Figure 1J, Figure S1). Taken together, these data indicated that pMHC binding does not uniformly predict T cell activity.
We set out to interrogate the molecular basis of this phenomenon. We focused on a pair of HLA B35-HIV(Pol448–456) specific TCRs, one of which (TCR55) appeared to have decoupled TCR-pMHC binding and signaling (Ueno et al., 2004). When we transduced responder (TCR589) or impaired-responder (TCR55) TCRs into a TCR αβ deficient cell line, both T cell lines were stained by the B35-HIV(Pol448–456) fluorescent tetramers, as previously reported (Figure 1K) (Ueno et al., 2004). The TCR589-transduced cell line showed dose-dependent secretion of IL-2 in response to peptide-pulsed APCs, while the TCR55-transduced cell lines failed to secrete detectable IL-2 for all peptide concentrations tested (Figure 1L). When the TCR55 and TCR589 cell lines were stimulated non-specifically with OKT3; both T cell lines responded similarly (Figure S1).
Non-stimulatory interaction parameters are similar to agonist interactions
TCR55 and TCR589 bound to B35-HIV(Pol448–456) with a 17 μM and 4 μM 3D KD (Figure 2B), respectively, as determined by surface plasmon resonance (SPR). TCR589 had a slower koff (0.71 s−1) than TCR55, whose koff exceeded the limit of detection (Figure 2 B,E). Both 3D KD values and kinetic rate constants were within typical range of 3D binding affinities and kinetics measured for agonist peptides (Stone et al., 2009). We also measured the 3D affinity of the DR4-HIV(Gag164–183) specific TCRs. Surprisingly, the non-stimulatory TCR11 bound with a higher 3D affinity (1 μM KD) than the stimulatory TCR6 (10 μM KD) (Figure S2).
Figure 2. Interrogating the biophysical parameters of non-agonist interactions.

(A) Schematic depiction of TCR-pMHC interaction. (B) SPR traces of TCR589 (blue; left) TCR55 (orange; middle) and equilibrium analysis (right) bound to B35-HIV(Pol448–456). (C) Representative images of B35-HIV(Pol448–456) (cyan) accumulation under cells expressing TCR55 (top), TCR589 (middle) or a null ligand (bottom). (D) The measured dwell time distributions for B35-HIV(Pol448–456) binding to TCR55 (orange) and TCR589 (blue); data shown as mean ± SEM of hundreds of measurements; See Movie S1. (E) Table of 3D and 2D measurements. (F) Structural overview and (G) footprint of the CDRs of TCR55 (orange, and tan), TCR589 (aqua, and cyan), bound to B35-HIV(Pol448–456) (gray and mint). (H) CDR interactions with HIV(Pol448–456) peptide; Van der Waals interactions shown in black, salt bridges in blue and hydrogen bonds in red. See also Figure S3, Tables S1, S2, Movie S1.
We sought to determine if TCR55 on cells engaged pMHC molecules in the context of lipid bilayers. We imaged the B35-HIV(Pol448–456)-TCR55 and TCR589 interactions in hybrid live cell–supported lipid bilayer junctions to assess possible differences in the interaction dwell times. The supported membrane was functionalized with fluorescently labeled B35-HIV(Pol448–456) (Figure S3) and ICAM1. Using TIRF microcopy, pMHC molecules were unambiguously resolved in complex with cell-surface expressed TCRs (Figures 2C, Movie S1). TCR55 and TCR589 bound to B35-HIV(Pol448–456) with similar mean dwell times of 10.1 ± 2.0 sec and 8.7 ± 2.1 sec, respectively (Figures 2D,E), comparable to the dwell-times previously reported for 5cc7-I-Ek (MCC) and AND-I-Ek (MCC) (O’Donoghue et al., 2013).
Structural analysis of agonist versus non-agonist interactions
To identify potential structural differences in the TCR B35-HIV(Pol448–456) interaction, we determined the crystal structures of TCR589 and TCR55 in complex with B35-HIV(Pol448–456) (Figures 2 F–H, Table S1). The structure of TCR55 complexed with B35-HIV(Pol448–456) was also reported recently (Shi et al., 2017). Although TCR55 is translated 8 Å toward the B35α1 helix compared to TCR589, the overall docking geometries of TCR589 and TCR55 are similar and unremarkable (Figure 2G, Figure S3). We see no substantial differences in the conformations of the constant regions that would indicate differential allostery correlating with signaling. TCR55 and TCR589 do not share Va, Vb, or CDR3 sequences and therefore exhibited distinct binding chemistries to B35-HIV(Pol448–456) (Figure S3; Figure 2H). TCR589 makes the majority of its contact with the Pol448–456 peptide through its CDR3 loops (Table S2). While TCR55 makes key salt-bridges with Pol448–456, the majority of the binding interface is from CDR1/2α interactions with the B35α1 helix and CDR3b interactions with the B35α2 helix (Figure 2G,H, Figure S3, Table S2).
TCR55 exhibits impaired T cell signaling
To interrogate the functional capacity of these two T cell clones, we traced the activation defect within the signaling cascade. The HIV(Pol448–456) peptide was applied to the B35-expressing cell line KG-1 and SKW3 T cells transduced with TCRs were probed for the surface-expressed activation marker CD69. The TCR589-expressing cell line showed dose-dependent upregulation of CD69; however, the TCR55-expressing cells failed to upregulate CD69, consistent with the IL-2 secretion-defective phenotype observed before (Figure 3A, Figure 1L). While both TCRs showed robust ERK1/2 phosphorylation (pERK) in response to OKT3 stimuli, only the TCR589 responded to the HIV(Pol448–456) peptide (Figure 3B,C; Figure S3).
Figure 3. Characterization of impaired TCR55 signaling.

(A) CD69 upregulation of SKW3 cells expressing TCR55 (orange) or TCR589 (blue); representative experiment (n=3); data shown as mean ± SD of technical triplicates. (B) pERK signaling of T cell lines expressing TCR55 or TCR589 stimulated with 100 M B35-HIV(Pol448-456). (C) Representative dose response (n=3) of pERK signaling; data shown as mean ± SD of technical triplicates (D) Representative wide-field pseudo-colored images of two types of intracellular Ca2+ signaling for TCR55 (top) and TCR589 (bottom); scale bar represents 5 μm. (E) Representative single cell Fluo-4 fluorescence traces (left; top and bottom), temporal dynamics and quantification (right); data shown as mean ± SEM for n=3. (F) Maximum projection TIRF images of T cells expressing either TCR55 (top), or 589 (bottom) of Zap70 clustering when stimulated with B35-HIV(Pol448–456) functionalized SLBs and quantification; Total: TCR55 0/141 cells, TCR589 (215/239); data shown as mean ± SD for n=2 independent experiments (right). Related to Figure S3, Movie S2.
We assessed early stages of TCR triggering by examining calcium signaling dynamics. We imaged TCR55- or TCR589-expressing cells labeled with Fluo-4 and activated by coverslips coated with B35-HIV(Pol448–456) monomers, or OKT3. Both T cell clones responded to OKT3 stimulation (Figure S3), however only 12% ± 3% TCR55 expressing cells fluxed calcium in response to B35-HIV(Pol448–456) stimulation, as compared to 51% ± 4% of TCR589 expressing T cells (Figure 3D,E). Furthermore, the TCR589-expressing cells exhibited a substantial and rapid increase in calcium followed by a decay, classified as a type-α calcium response and indicative of successful TCR triggering (Liu et al., 2014). In contrast, TCR55-expressing cells showed a type-β calcium signal, characterized by intracellular calcium either remaining at baseline or increasing only slightly (Figure 3D,E; Figure S3). These results are consistent with calcium signaling observed for the DR4-HIV(Gag) TCRs, in which 70% ± 2% of TCR6-expressing cells were triggered compared to 31% ± 8% of TCR11-expressing cells when stimulated with DR4-HIV(Gag) (Figure S2).
Upon TCR triggering, ZAP70 is recruited to phosphorylated ITAMs. We used spinning disc TIRF microscopy to observe ZAP70 recruitment in non-agonist and agonist TCR-pMHC interactions. TCR55- and TCR589-expressing cell lines were lentivirally transduced to express ZAP70-GFP in order to visualize intracellular ZAP70 localization (James and Vale, 2012). Cells were examined while in contact with supported lipid bilayers (SLBs) functionalized with B35-HIV(Pol448–456) and ICAM1. TCR589-expressing cells exhibited canonical ZAP70 recruitment: ZAP70 clusters centripetally moved towards the center of the cell (Figure 3F; bottom, Movie S2). The TCR55-expressing cells exhibited a uniform distribution of ZAP70 throughout the cytoplasm upon interaction with the SLB (Figure 3F; top, Movie S2). The non-agonist signaling defect thus occurred at a membrane-proximal stage.
TCR55 recognizes multiple peptides related to HIV(Pol448–456)
We took a gain-of-function approach to isolate the source of the signaling defect. We developed a HLA B35 yeast display library to identify agonist ligands for TCR55 that would allow us to directly compare TCR55 in both “off” and “on” states (Figure S4). The B35 peptide library was designed as a 9-mer (the length of Pol448–456) in which P1 and P3–P8 were randomized using NNK codons, and the anchor residues, P2 and P9, encoded known B35 anchors (Figure 4A). We generated a pool of approximately 2×10⁸ unique transformants on which we performed selections with multimerized TCR55 (Figure 4B). After iterative rounds of selections, we obtained yeast clones bearing pMHC molecules that bound to TCR55 (Figure 4B). Each round of the selected pool was deep-sequenced to recover the identities of enriched peptides (Figure 4C,D; Figure S4).
Figure 4. Design and selection of HLA-B35 yeast display library.

(A) Design of HLA B35–9mer peptide library and selection scheme (B) cMyc tag enrichment for each round of selection (left) and post-4th round tetramer staining of cMyc+ population. (C) Comparison of total number of peptides and prevalence of 10 most abundant peptides for each round of selection. (D) Heatmap of amino acid frequency for TCR55. The sequence of HIV(Pol448–456) is represented by outlined boxes. TCR facing residues positions are shown in aqua, anchor positions in orange. Related to Figure S4.
TCR55 recognized a peptide sequence kernel resembling the HIV(Pol448–456) peptide (Figure 4D). The TCR-facing residues, P1 and P5, were essentially invariant, presenting valine and glutamic acid respectively (Figure 4D). The selection of P5-Glu reflected its observed structural importance in TCR55’s ability to bind to B35-HIV(Pol448–456) (Figure 2). Additionally, at P6, an MHC facing residue, aspartic acid was highly preferred over the wild-type glutamic acid (Figure 4D). For the remaining TCR facing residues, P4 and P8, there were no significant preferences. The selection data revealed 9-mer peptides composed of a P1V, P5E, and P6D readily bound to TCR55. Using Hamming distance-based clustering, we identified one primary family of peptides (differing by 1–4 amino acids) that encompassed the most enriched ligands (Figure S4).
3D affinity is poorly correlated with TCR signaling outcome
We synthesized 50 peptides derived from the library and tested their stimulatory potential on T cell lines transduced with TCR55. We found a wide range of potencies of the peptides discovered by the B35 library, ranging from full agonism to partial agonism to no detectable signaling (Figure 5 A-C, Figure S5). The peptides that elicited these disparate signaling outcomes were remarkably similar in sequence. We chose a set of 15 peptides that displayed varied signaling capacity to further examine the relationship between 3D affinity and potency. TCR55 bound to the various pMHCs of interest with a range of KD’s from 0.5 μM to >80 μM (Figure 5D). All ligands showed immeasurably fast, box-like kinetics similar to the TCR55-HIV(Pol448–456) interaction (see Mendeley Data).
Figure 5. Tuning TCR signaling potency with engineered ligands.

(A-C) CD69 upregulation on SKW3 T cells expressing TCR55 when stimulated with (A) agonists partial agonists (B) or non agonists (C); Representative data (n=3) is shown as mean ± SD (n=3). (D) 3D equilibrium KD vs EC50 of CD69 upregulation. r2 shown includes only peptides for which the EC50 could be determined. Related to Figure S5, see also Mendeley Data.
The compilation of the 3D affinity and potency data indicated that, with the exception of the highest-affinity pMHC ligands, the affinity of a given ligand for TCR55 was not predictive of T cell activation. While very high-affinity (<2 μM) ligands elicited uniformly potent activation of TCR55 (Figure 5D; salmon background, Figure S5), intermediate- and low-affinity ligands (5 to >80 μM; aqua background, Figure S5) exhibited highly variable signaling responses (Figure 5D, and Figure S5, see Mendeley Data). We found minimal correlation between EC50 and KD for the set of pMHCs for which an EC50 could be calculated (r2= 0.098). Ligands with similar EC50 exhibited affinities spanning two orders of magnitude. Within that range, we found agonist peptides (e.g. pSQL) that were of similar affinity to HIV(Pol448–456) (Figure 5D, and Figure S5).
TCR55 has virtually identical structure bound to an agonist pMHC ligand
A high-potency agonist ligand, Pep20, had two conservative substitutions relative to the HIV peptide that converted the peptide from a non-agonist to a potent agonist: P1-Ile to Val and P6-Glu to Asp. P1 makes scant contact with TCR55 in the initial crystal structure (Figure 2) and P6 is an MHC-buried residue. These mutations rescued Zap70 clustering, ERK-phosphorylation, CD69 upregulation (Figure 5A, Figure S6, Mendeley Data), and increased the 3D affinity to be 500 nM (Figure S5). Using this strong agonist, we assessed if HIV(Pol448–456) could be an antagonist peptide. Pep20-induced activation was not influenced by the presence HIV(Pol448–456), suggesting it is not an antagonist (Figure S6) (Bertoletti et al., 1994). Additionally, the 2D dwell time of TCR55 in complex with B35-Pep20 showed a longer half-life of 11 ± 1.2 sec (Figure S6; see Mendeley Data) compared to the dwell time of 8.7 ± 2.1 seconds for TCR55-B35-HIV(Pol448–456) (Figure 2).
We determined the crystal structure of TCR55 in complex with B35-Pep20 at 1.8 Å and found no significant differences in the structure of TCR55, or in the docking footprint of the pMHC-TCR complex compared to the non-agonist complex (Figure 6A,B). The principal differences between the TCR55 B35-HIV(Pol448–456) and TCR B35-Pep20 complexes involve the MHC-facing P6 position of the peptide that is inserted into the B35 C-pocket, hydrogen bonding to Arg97. In the B35-Pep20 the P6-Asp, which has one less methelyne group, forms an additional hydrogen bond to B35-Tyr74 (Figure S6).
Figure 6. Agonist interactions form catch bonds and exclude CD45.

(A) Superimposition of TCR55 binding to B35-HIV(Pol448–456) (orange and tan) and B35-Pep20 (magenta and pink). (B) Overlay of TCR55 CDR footprint binding to Pep20 (marine) and HIV(Pol448–456) (teal). (C) Representative TIRF images of GUVs functionalized with TCR589 (upper left) or TCR55 (upper right, lower left and right) interacting with SLBs functionalized with B35-HIV(Pol448–456) (upper left and right), B35-Pep20 (lower left) or B35-pSQL (lower right; CD45 shown in cyan, pMHC magenta). (D) Percent of GUVs partitioning CD45 from pMHC (n=3 independent experiments); data shown as mean ± SEM (n= from 15 to 50 GUVs per condition). (E) Schematic of BFP assay and diagram of slip and catch bond curves. (F) Bond lifetime vs force curves for B35-HIV(Pol448–456) binding to TCR589 (aqua) or (G) TCR55 (orange). (H) Bond lifetime vs force curves for TCR55 binding to B35-Pep20 (pink) or (I) B35-pSQL (green). (F-I) Data shown as mean ± SEM of hundreds of individual bond lifetime measurements. Related to Figure S6, Table S1 and S2; see also Mendeley data.
Strength of TCR signaling correlates with ability to exclude CD45
The kinetic segregation hypothesis posits that exclusion of the phosphatase CD45 from the early T cell-APC contacts facilitates TCR triggering (Davis and van der Merwe, 2006). We therefore compared CD45 exclusion by functionally diverse ligands in a cell-free system using giant unilamellar vesicles (GUVs) to eliminate effects of signaling in live cells (e.g. actin reorganization) (Carbone et al., 2017). GUVs functionalized with TCR and CD45, to mimic the T cell membrane, were incubated with SLBs functionalized with a pMHC of interest (Figure S6). Fluorescent fabs were used to spatially resolve the CD45 molecules’ location. Using TIRF microscopy, we interrogated CD45 exclusion of the agonist interaction TCR589-HIV(Pol448–456), and two agonist interactions for TCR55 induced by ligands identified from the yeast display library: the high-affinity Pep20, and pSQL (KD=12.5 μM)- a ligand of similar affinity to HIV(Pol448–456). TCR589-HIV(Pol448–456), TCR55-Pep20, and TCR55-pSQL excluded CD45 with varying degrees of efficiency (92%, 89%, and 65% respectively), whereas for TCR55-HIV(Pol448–456) only 10% of GUVs excluded CD45 (Figure 6C, D). Thus, we observed that the extent of CD45 segregation correlated with the ability to induce robust signaling.
Non-agonist pMHC ligands form slip bonds with TCR55
The functional potency of TCR-pMHC interactions has been shown to correlate with catch bond formation, whereby force prolongs the bond lifetime (Hong et al., 2015; Liu et al., 2014; Liu et al., 2016). We analyzed the in situ 2D affinity of stimulatory and non-stimulatory TCR-pMHC interactions using a single molecule adhesion frequency assay (Figure S6). To eliminate the contribution of co-receptor binding, we used a CD8−/− T cell line to measure 2D affinities. Both TCR589- and TCR55- B35-HIV(Pol448–456) interactions have 2D affinities consistent with other agonist TCR-pMHC interactions; however, TCR589-B35-HIV(Pol448–456) has a comparatively higher 2D affinity (Figure S6) (Adams et al., 2011; Hong et al., 2015; Huang et al., 2010; Liu et al., 2014).
We next measured the single molecule bond lifetime of TCR-pMHC interactions under conditions of force using a Biomembrane Force Probe (BFP) bond lifetime assay (Figure 6E). A range of forces was applied via a pMHC engaged with TCRs expressed in a CD8+ cell line. The bond lifetime of the agonist interaction of TCR589 with B35-HIV(Pol448–456) increased in response to increasing force, reaching a maximum at 10.7 pN, followed by a steady decrease thereafter, suggestive of a catch bond (Figure 6F). In contrast, the bond lifetime of TCR55 to B35-HIV(Pol448–456) decreased monotonically under force, characteristic of a slip bond (Figure 6G). We extended this approach to the high affinity Pep20 and affinity-matched agonist pSQL (Figure 5D, Figure S5). Similar to the agonist interaction of TCR589- B35-HIV(Pol448–456), the bond lifetimes of TCR55 with agonist pMHCs increased under force, indicating the formation of catch bonds, with peak bond lifetimes for Pep20 and pSQL occurring at 13.6 pN and 6.58 pN, respectively (Figure 6H, I). These results showed that discrimination of affinity-matched agonist and non-agonist peptides recognized by the same TCR correlated with catch bond formation for the former, and slip bonds for the latter.
We additionally applied the BFP assay to the TCR6- and TCR11- DR4-HIV(Gag164–183) interactions. Again, the agonist TCR6-DR4-HIV(Gag164–183) lifetimes increased under force, forming a catch bond, whereas the high affinity non-stimulatory TCR11-DR4-HIV(Gag164–183) bond lifetime decreased under force, forming a slip bond (Figure S2).
Molecular dynamics simulation of TCR-pMHC catch bond formation
To investigate the molecular basis of catch or slip bond formation during TCR-pMHC disengagement we created a dynamic molecular model to explore the differences between the TCR55-B35-Pep20, HIV, and pSQL antigens using molecular dynamics (MD) simulations. We first determined free energy minima by enhanced conformational sampling, then sheared the center of mass of TCR Vαβ in six directions relative to the MHC (see Mendeley Data; methods details). For shear in the ±x and ±y directions, the critical shear force was ~40 kcal/(mol·Å). We observed multiple catch bonds for the two agonists (Pep20 and pSQL) in all 4 directions, but no catch bonds for the non-agonist (HIV) in any direction (Figure 7D). For tension or compression in the ±z directions (Figure S7), no bonds broke under forces up to the critical shear stress in the ±x and ±y directions, and the critical tensile force was ~50 kcal/(mol·Å), suggesting that the applied force will resolve in the ±x and ±y directions.
Figure 7. Dynamic model of TCR-pMHC catch bond formation.

(A) Bond distance vs. shearing distance plots for the four catch bonds of TCR55-B35(Pep20) (left) or slip bonds of TCR55-B35(HIV) (right) under force in the +x direction. Horizontal gray dashed lines show the equilibrium distance for the bond. Vertical gray dashed lines correspond to the snapshots shown in (B). (B) Snapshots throughout the simulation of TCR55-B35(Pep20) (left) or TCR55-B35(HIV) (right) where, under force, new interactions are formed or initial interactions are ruptured. (C) Schematic of the evolution of TCR55 and Pep20 (left), HIV (middle) SQL (right) interactions under force. Newly formed interactions are highlighted in a box. (D) Summary of the number catch bonds formed by TCR55 dissociating from Pep20, HIV, or SQL in the ±x and ±y directions. Related to Figure S7 and Movies S3–S5; see also Mendeley Data.
To examine in detail catch bond versus slip bond formation, we highlight TCR dissociation in the +x shear direction, where catch bonds were formed for both Pep20 and pSQL (Figures 7A–C, Figure S7, and Movies S3–5). Catch bond 1 (red) represented a reorganization of interactions between CDR2α-Glu55 and the B35α2 helix. At x=23 Å Glu55 broke with Arg157 and formed a ‘rescue’ salt-bridge with Arg151. For catch bond 2 (blue), Glu52 formed a new salt-bridge with B35-Arg79 (x=23 Å) while maintaining its interaction with Arg75 until x=32.3 Å. Catch bond 3 (green), formed an additional salt bridge between CDR3β-Arg96 and P5-Glu at x=21 Å - adding to the initial interaction of CDR3β-Arg94 and P5-Glu. The original bond was maintained until x=35 Å, and the new salt bridge breaks at x=38.5 Å. Catch bond 4 (purple), represents interactions that were not present in the starting structure. A hydrogen bond between CDR1α-Ser31 and P4-Thr was formed immediately upon shearing and was replaced by the CDR1α-Trp30 and P4-Thr hydrogen bond at x=19 Å. Both bonds broke at x=26.5 Å but were regained at x=31 Å and lifted the N-terminus of the peptide. The water-bridged hydrogen bond between CDR1α-Trp30 and P4-Thr was maintained even at x=50 Å (Figure 7A,B, Figure S7, Movie S3).
MD simulations of TCR55 dissociation from B35-HIV yielded four molecular slip bonds, in which the original interactions ruptured during the shearing process and no new interactions were formed (Figures 7A,B, S7, Mendeley Data, and Movie S4). For slip bond 4, a short-lived hydrogen bond between CDR1α-Trp30 and P4-Thr existed in the range x=22–25 Å. The dissociation trajectory can be described as slip bond 1 breaking first at x=20 Å, followed by the formation of the transient hydrogen bond. At x=26 Å slip bond 3 broke and lastly slip bond 4 broke at x=27.5 Å.
Simulations of TCR55 dissociation from the affinity-matched agonist SQL peptide revealed the formation of three catch bonds (Figures 7C, Figures S7, and Movie S5). Three of these catch bonds were similar to catch bonds 1–3 of the Pep20 system, while catch bond 4 was absent.
We found two instances where conservative mutations between Pep20 and HIV led to differences in dissociation dynamics relevant to their distinct signaling capacities (Figure S7). First, TCR interactions with P4 caused the N-terminus of the peptide to lift up from B35 during dissociation. The lifting was initially blocked by the B35α1- Arg75 interaction (Figure S7). For HIV, P1-Ile posed a steric constraint and limited the N-terminal lift, thus preventing catch bond 4 formation. In Pep20, the less bulky P1-Val allowed peptide lifting and permitted catch bond 4 (Figure S7). Second, P6 in Pep20 and HIV forms a salt bridge with Arg97 on the β-sheet floor of B35. As TCR55 was sheared, the P6-mediated salt bridge anchored the central residues while the N-terminus of the peptide lifted. For Pep20, this bond length remained ~12.3 Å, acting as a stiff spring (Figure S7). However, during the shearing process, the bond ruptured and allowed for CDR3 -Arg96 to orient to support catch bond formation (Figure S7, Figure 7B; Catch bond 3). For HIV, the extra methylene group in P6-Glu reduced the strength of the anchoring bond, and sterically prevented catch bond 3 formation. The MD simulations highlight how subtle changes to the TCR-pMHC interface can lead to dramatic differences in signaling outcomes.
Discussion
Here we have taken an unconventional approach to dissecting TCR triggering mechanisms by studying TCRs that engage pMHC ligands, but do not initiate productive signaling. We hypothesized that a systematic comparison of signaling versus non-signaling pMHCs could allow us to isolate a basis for this discordance. We used a pMHC library to isolate peptides in which signaling outcome was altered by minimal changes in peptide sequence which, crucially, did not significantly alter binding affinity. Our study isolates catch bond formation and CD45 exclusion as principal emergent properties differentiating stimulatory from non-stimulatory TCR-pMHC interactions. Perturbations of TCR-pMHC interface chemistry as a result of peptide substitutions, alterations in docking geometry, or TCR CDR mutations can dramatically impact the coupling of binding to signaling (Adams et al., 2011; Degano et al., 2000; Kalergis et al., 2001). Catch bond formation, the origins of which are rooted in the structural chemistry and energetic landscape of the TCR-pMHC interface, appears to determine signaling upon TCR-pMHC engagement, and likely explains anomalous relationships between TCR-pMHC binding strength and signaling. Catch bonds may play a role in explaining alloreactivity to MHC molecules with minor polymorphisms (Luz, 2002).
Reconciling intrinsic and extrinsic models of TCR triggering
APLs are often designed to abrogate TCR binding, limiting the ability to probe the biophysical basis of TCR signaling (Aleksic et al., 2010; Ding et al., 1999; Evavold and Allen, 1991; Holler and Kranz, 2003; Johanns et al., 2010; Sloan-Lancaster and Allen, 1996). Numerous studies have argued that parameters intrinsic to the TCR can account for T cell signaling potency. These include (1) affinity, kinetics, 2D confinement time, and 2D on-rate (Aleksic et al., 2010; Huang et al., 2010; Huppa et al., 2010) and (2) structural influences such as conformational change, docking geometry, and complex stability (Adams et al., 2011; Beddoe et al., 2009; Das et al., 2015; Kim et al., 2009; Krogsgaard et al., 2003; Minguet et al., 2007; Natarajan et al., 2017). Our initial efforts focused on a systematic comparison of intrinsic TCR-pMHC parameters between functionally disparate interactions. We measured 2D binding using two different methods. By TIRF microscopy, TCR589 and TCR55 exhibited similar dwell times to B35-HIV(Pol448–456). However, by BFP, TCR589 showed a higher 2D affinity compared to TCR55. It is possible that an additional class of faster interactions exist that could not be resolved from stochastic events and therefore were unmeasured by TIRF microscopy. Furthermore, crystal structures showed that non-agonist interactions bound with similar docking geometries to agonist complexes, ruling out TCR-pMHC topology alone as the explanation for signaling differences. This is consistent with prior studies showing permissiveness in docking topologies compatible with signaling (Beringer et al., 2015). Nevertheless, since TCR-pMHC docking geometry determines the interface chemistry, which in turn influences whether a given interaction will form catch or slip bonds, these structural parameters are linked, providing a potential mechanism for how TCR-pMHC topology could influence signaling outcome (Adams et al., 2011).
A challenge to ‘intrinsic’ models of TCR triggering is that T cells can be triggered independently of TCR-pMHC binding, solely by exclusion of the phosphatase CD45 (Chang et al., 2016; Davis and van der Merwe, 2006). The kinetic segregation model, which we refer to as an ‘extrinsic’ model, postulates that the exclusion of CD45 from the region of the TCR-pMHC interaction promotes a shift in the equilibrium between the co-receptor bound kinase LCK and phosphatase CD45, favoring the phosphorylated state of the ITAMs of the TCR. Additionally, studies using anti-CD3 antibodies under varying amounts of force (Hu and Butte, 2016) and immobilized on materials with differential stiffness properties (Judokusumo et al., 2012; Saitakis et al., 2017) have tuned signaling potency based on mechanical force alone.
Our data is consistent with a model that reconciles intrinsic and extrinsic models of TCR triggering: TCR-pMHC interactions at the membrane interface are prolonged by the formation of catch bonds, allowing for prolonged local CD45 segregation and potentiating subsequent downstream activation. Alternatively, catch bond formation could cause a peptide-specific increase in TCR-pMHC dwell time in areas from which CD45 is segregated (Figure S6). The presumed low number of agonist pMHC supports the latter. Importantly, it has been suggested that thermal fluctuations in membrane shape can lead to substantial changes in force on a given TCR-pMHC interaction (Pullen and Abel, 2017; Schmid et al., 2016). This could contribute to a sharp threshold for ligand discrimination by disrupting weak, non-agonist, TCR-pMHC interactions or, in the case of agonists, promote catch-bond formation leading to a peptide-specific increase in TCR-MHC dwell-time. Catch bonds, or ‘flex bonds’, can compensate for the apparently fast 3D Koff, characteristic of many physiological interactions, and thus contribute to a higher probability in receptor signaling (Kim et al., 2010; Liu et al., 2014; Luca et al., 2017).
Molecular dynamics modeling of catch bond formation
Extension of bond lifetime under force has been experimentally shown for TCR-pMHC interactions, but the details of this process are poorly understood (Hong et al., 2015; Liu et al., 2014). The TCR-pMHC catch bond formation mechanism, as elucidated by MD simulations, differs from other receptor-ligand catch bond interactions: there was no external trigger or gross conformational change (Lou and Zhu, 2007; Manibog et al., 2014; Sauer et al., 2016). We reveal a dynamic mechanism for TCR specificity and cross-reactivity that is rooted in the structure of the TCR-pMHC interface and illustrate how TCRs can be sensitive to minimal changes in the peptide. The simulations also highlight a surprising finding: peptide residues buried in the MHC groove can play an important role in modulating T cell activation by acting as molecular springs that modulate catch bond behavior. Interestingly, the same pMHC can be an agonist or non-agonist for different TCRs. While our data point to a TCR-dependent parameter, it is difficult to assign causality to either the TCR or the peptide-MHC. Instead, the formation of a catch or slip bond is a collective property of the entire TCR-pMHC interface (Evavold and Allen, 1991; Hawse et al., 2014).
Role of non-agonist interactions in vivo
Classically, T cell clones specific for a pMHC have been identified by activation assays. By circumventing the requirement for activation using tetramer selections, we isolated TCRs that bind to a ligand but do not activate T cell signaling. Single-cell tetramer sorting assays have previously observed a number of similar non-agonist TCR-pMHC interactions in vivo (Moon et al., 2007; Yu et al., 2015). These non-responsive T cell clones were previously thought to be a consequence of anergic or senescent T cells, but may in fact be inherent to the molecular interaction between the pMHC and the TCR. Tetramer sorting may not identify functionally relevant T cell clones, as some fraction of these are likely non-agonist interactions (Martinez et al., 2016; Moon et al., 2007).
Viruses could exploit these non-agonistic modes of recognition as a strategy for immune evasion (Ploegh, 1998). Many of the previously reported non-agonist interactions were observed for viral antigens, including HIV, Hepatitis-C Virus, and Epstein Barr Virus. Conservative mutations may allow viruses to manipulate TCR recognition and blunt a particular clonal T cell response – implying a functional selection of viral mutations to increase fitness. The observation that TCR binding can be uncoupled from signaling suggests new strategies for immunotherapy engineering: identification of non-agonists for potentially pathogenic T cell clones in the context of autoimmune disease could be a novel approach to treatment. It may also be possible to enhance the potency of TCRs to self-antigens in the context of adoptive cell therapy through catch-bond engineering rather than affinity maturation, which can lead to off-target toxicity (Linette et al., 2013).
STAR Methods
Contact for reagent and resource sharing
Further information and requests for resources and reagents should be directed to the Lead Contact, K. Christopher Garcia (kcgarcia@stanford.edu).
Experimental Model and Subject Details
Human Subjects
PBMCs were obtained from the Stanford Blood Bank. Cells in deidentified leukoreduction chambers from healthy platelet donors were processed as soon as possible and no later than 18 hr after plateletpheresis.
For isolation of T cell clones specific for HCV variants, PBMCs from 4 healthy male (ages: 53, 58, 40, 54) and 1 healthy female (age: 53) HLA A*02+ donors were used. For isolation of HY specific T cell clones PBMCs from 3 healthy male donors (ages: 32, 28, 54) and 3 healthy female HLA A*02+ (ages: 22, 21, 53) donors were used (Yu et al., 2015). For isolation of DR4-HIV specific clones, PBMCs from 4 healthy HLA-DR4+ donors (3 M, 1 F ages 37–58) were used (Su et al., 2013.) Blood sample collection and processing was conducted in accordance with the rules and regulations of the Stanford institutional review board.
Cell Lines
Cell lines were kept in a humidified incubator at 37 °C with 5% CO2 unless otherwise denoted. Primary human T cells were cultured in RPMI (ThermoFisher), 10% heat inactivated FCS, 2% heat inactivated human AB serum, 100 U/ml penicillin G, 100 ug/ml streptomycin, 2 mM glutamine. IL-2 (Peprotech) was added to a final concentration of 100 U/ml. Primary T cell clones were isolated from donors mentioned in the human subjects section. Work done with blood samples was conducted in accordance with the rules and regulations of the Stanford institutional review board.
SKW3 (derived from male with T cell leukemia), Jurkat b−/− (derived from a male with acute T cell leukemia) and 58−/− (an XY murine T cell hybridoma derived from the BW5147 murine thymoma). T cell lines were cultured in RPMI + glutamax (Invitrogen) supplemented with 10% FBS supplemented with 5 mM HEPES pH 8.0 (ThermoFisher), and 50 U/ml penicillin and streptomycin (ThermoFisher). KG-1 cells are HLA B35*01 expressing cells derived from a male with acute myelogenous leukemia. KG-1 cells were used as antigen presenting cells and were cultured in IMDM (ThermoFisher) + 10% FBS and 50 U/ml penicillin and streptomycin (ThermoFisher). SKW3 were purchased from DSMZ and KG-1 cells were purchased from ATCC. 58−/− and Jurkat b−/− cells were a gift from Mark Davis (Stanford). Validation of T cell lines was performed by staining with known markers pre- and post- transfection.
HEK 293T Phoenix cells (female derived kidney cell line) were grown in DMEM complete media (ThermoFisher) supplemented with 10% FBS, 2mM L-glutamine, and 50 U/ml of penicillin and streptomycin.
The JY cell line is a male derived EBV-immortalized B cell line cultured in RPMI complete containing 10% FBS, 2 mM glutamine, and 50 U/mL penicillin and streptomycin.
EBY100 yeast cells were grown in sterile filtered YPD Media containing 5 g yeast extract, 10 g peptone, and 10 g dextrose in deionized water. Transformed yeast were grown in SDCAA containing 20 g dextrose, 6.7 g Difco yeast nitrogen base, 5 g Bacto casamino acids, 14.7 g sodium citrate, and 4.29 g of citric acid monohydrate per liter of media, or SGCAA where Galactose replaces dextrose. EBY100 cells are grown at 30° C when cultured in SDCAA, or at 20° C when cultured in SGCAA at atmospheric CO2.
High Five cells were grown in Insect X-press media (Lonza) with final concentration 10 mg/L of gentamicin sulfate (ThermoFisher) at 27 °C at atmos pheric CO2. SF9 cells are grown in SF900-III serum-free media (ThermoFishser) with 10% FBS and final concentration 10 mg/L of gentamicin sulfate at 27 °C at atmospheric CO 2.
BL21 were cultured at 37 °C at atmospheric CO 2 in Terrific Broth Media (Research Products International), supplemented with 6 mls of glycerol per 1.5 L of media. 1mM IPTG was added in order to induce expression of the protein of interest.
DH5α were cultured in LB (Sigma) supplemented with either 100 ug/ml carbenicillin or 50 ug/ml of kanamycin.
The cell lines were validated by staining for known cell surface markers. The parental SKW3, 58−/−, and Jurkat b−/− cell lines do not have surface expressed TCR and were validated by surface staining with anti-TCR antibody (clone IP26) or tetramers. After transduction, TCR expression was confirmed by staining with specific fluorescent pMHC tetramers and anti-TCR antibodies. Bacterial, insect, and Phoenix 293 cells were not validated by cell surface marker staining, but were monitored daily for morphological integrity under brightfield microscopy.
Methods Details
Tetramer enrichment and T cell cloning
LRS chambers containing PBMCs (Stanford Blood Center) from platelet donors were processed within 24 hr. T cells were concentrated by negative depletion with RosetteSep (StemCell Technologies). Red blood cells (RBCs) were lysed with ACK buffer, filtered through 70 m mesh, and resuspended in flow cytometry buffer (PBS with 2% FCS, 0.5 mM EDTA) at 5 × 10⁶/ml. Cells were incubated 1 hr at room temperature in 20 nM pMHC tetramers (PE or PE-Cy conjugate), anti-CD8 antibody (Biolegend), anti-CD32 (BD Biosciences), anti-CD16 (Biolegend), and 50 M biotin. After washing, cells were incubated with anti-PE Microbeads (Miltenyi) and tetramer enriched using LS columns (Miltenyi). After enrichment, the column fraction and an aliquot of the flow through were stained for 30 min on ice with a viability stain (either propidium iodide or Aqua Live/Dead Stain (Invitrogen)) and an additional antibody mixture either with anti-CD4 and anti-CD8.
Tetramer enriched cells were single cell sorted into a round bottom 96-well plate containing 100 μl media (RPMI, 10% heat inactivated FCS, 2% heat inactivated human AB serum, 100 U/ml penicillin G, 100 ug/ml streptomycin, 2 mM glutamine) with a BD Aria cell sorter. Feeder cells were prepared from PBMCs from 2–3 random HLA buffy coats irradiated with 4000 rads in a cesium-137 irradiator. JY cells (Sigma-Aldrich) were irradiated with 12000 rads. 100 l containing 75,000 PBMCs, 7,500 JY cells, and 160,000 anti-CD3/anti-CD28 beads (Dynal/Invitrogen) were added to each well after sorting. IL-2 (Peprotech) was added to a final concentration of 100 U/ml. Cells were kept in a humidified incubator at 37 °C with 5% CO2. IL-2 and media were changed as needed, and the cells were reanalyzed for tetramer staining by flow cytometry. Re-stimulation of T cell clones was performed with PHA (Gibco), IL-2 (100 U/ml), and irradiated mixed PBMCs and JY cells at 750,000 cells/ml and 75,000 cells/ml, respectively.
Primary T cell signaling
Cell proliferation was performed by labeling cells with 5 M CFSE (Invitrogen) for 5 minutes at room temperature and co-cultured for 4–5 days with peptides (10 g/ml) pulsed on peripheral monocyte derived dendritic cells, or non-specific stimuli (PHA or anti-CD3/CD28 beads). Plates were spun down at 500 g and washed once with 1x PBS+0.1%BSA, and 0.5 mM EDTA. Cells were stained with tetramers, anti-CD16 (Biolegend), and anti-CD32 (BD Biosciences) for 1 hour at room temperature, followed by staining with the following antibody cocktail for another 10 minutes: anti-CD11b (Biolegend), anti-CD19 (Biolegend), anti CD4 (Biolegend), and anti-CD8 (Biolegend). Assay was read via flow cytometry. For cytokine analysis, T cell clones were stimulated with peptide pulsed on PBMCs obtained from the Stanford Blood Center for 10–12 hours at 37 °C in the presence of protein transport inhibitor (GolgiStop, GolgiPlug, BD). Plates were spun down at 1500 rpm and assayed for intracellular cytokine production by staining cells with anti-IL-2 (Biolegend) and anti-IFN-g (eBiosciences) and co-stained with the antibody cocktail mixture described above.
CD107 mobilization assay was performed as described in (Yu et al., 2015). Briefly, T cell clones were cultured with peptide pulsed T2 (HLA A*02+ APC; ATCC) cells in a 1:1 ratio. 50,000–100,000 of each cell type were mixed in 50 l of media in the presence of CD107a antibody (BD Biosciences), peptide, 10 mM monensin. The plate was centrifuged at 300 g for 1 minute to pellet cells and the plate was placed into an incubator at 37 °C for 4.5 hours. After incubation the plate was spun at 500 g to pellet cells and remove supernatant. Cells were washed once with 1x PBS+0.1%BSA, and 0.5 mM EDTA. Cells were stained with tetramers and/or CD3 (BD Biosciences) and CD8 (Biolegend).
Retroviral transduction of TCRs
TCR α and β chains were cloned separately into retroviral pMSCV vectors. Plasmid DNA sequence integrity were verified by automated fluorescent dideoxy (Sanger) sequencing (Sequetech). 1 × 10⁶ Phoenix (293) cells were plated in 3.5 mls of DMEM complete media (10% FBS, 10 mM HEPES, Pen-strep, L-glutamate) in a 6-well plate. In a cryo-vial (Fisher). 18μl of unsupplemented DMEM (Thermo Fisher) was mixed with 18μl of FuGENE (Promega) was incubated at room temperature for 5 minutes. 5.5 g of DNA from either TCRα, TCRβ, or CD3 vectors was mixed with 1.1 μ g of pCL-10A (Novus Biolgicals) and added to DMEM-FuGENE mixture and left to incubate for 30 minutes at room temperature. Transfection mixtures for TCR, TCR, or CD3 encoding plasmids were added to separate wells of Phoenix cells and left overnight at 37 °C. Media was changed the following day and transferred to 32 °C incubator. The next morning, supernatants were harvested and collected, and replaced with fresh complete DMEM. Supernatant was kept at 4 °C. The next day supernatants were harvested, collected and combined (TCRα, TCRβ, and CD3). Supernatants containing virus was filtered through an 0.45 m filter and concentrated using a 100 kDa spin filter (Amicon) until 0.5–1 ml. Concentrated virus was buffer exchanged into RPMI complete using 100 kDA filter and again concentrated to 0.5 – 1 ml. Concentrated virus was added to 2 × 10⁶ either SKW3, 58−/− Jurkat b-,/- cells in 12 well plates. Plates containing cells and virus were spun at 2500 rpm for 2 hrs at 32 °C. After centrifugation plates were returned to 37 °C incubator. TCR expression was checked by antibody and tetramer staining via flow cytometry after 5 days. TCR+ CD3+ population was sorted for further use.
IL-2 elisa
58−/− transduced T cells were rested overnight in RPMI complete. KG-1 antigen presenting cells (APCs) were pulled with desired concentration of peptide for 2 hours or overnight at 37 °C. For stimulation of TCR6 and TCR1158−/− transduced T cells, plates were coated with desired concentration of recombinant DR4-HIV monomer at 4 °C overnight. APCs were washed once to remove excess peptide. T cells and APCs were mixed at a ratio of 1:1 and incubated at 37 °C for 24 hrs. Secreted IL-2 was measured using the Ready-Set-Go mouse IL-2 Elisa Kit (EBioscience) as recommended by the manufacturer. Briefly, 96-well flat bottom plates (Corning Costar; 9018) were coated with 100 μl of capture antibody diluted in supplied 1x coating buffer, sealed, and set at 4 °C overnight. Wells were aspirated and washed three times with 200 μl of PBST (1x PBS + 0.05% Tween −20). Plates were then blocked with 200 l of 1x ELISA/ELISASPOT diluent and incubated at RT for 1 hour. The plate was washed 1x with PBST. 100 μl of sample was added to desired wells as well as a standard curve of IL-2 (prepared as recommended by eBioscience). Plates were sealed and incubated for 3 hours at room temperature shaking at 200 rpm. The samples were pipetted off and the plates were washed 5 times with 200 l of 1xPBST. 100 l of diluted detection antibody was added to each well and plates were incubated for 1 hour. Samples were pipetted off and the plates were washed 5 times with 1xPBST. 100 μl of diluted Avidin-HRP was added to each well, and the plate was incubated at room temperature for 30 minutes. The plate was washed 7 times with 1xPBST. 100 μl of 1xTMB solution was added to the plates. Plates were incubated for 15 minutes at room temperature. Reaction was quenched with 100 μl of 1 M H3PO4 and the plate was read at 450 nm and 570 nm on Spectra Max Paradigm (Molecular Devices). Antibodies were diluted in 1x diluent as recommended by specific kit. Assay was performed in biological and technical triplicates.
CD69 upregulation
SKW3 T cells were rested overnight in RPMI complete. KG-1 antigen presenting cells were pulled with desired concentration of peptide for 2–3 hours incubated at 37 °C. KG-1 cells were washed to remove excess peptide and re-suspended with rested SKW3 T cells. Cells were co-cultured for 14 hours. Cells were stained with anti-CD3 (UCHT-1, BD Biosciences) (1:100) and anti-hCD69 (1:100) (Biolegend) for 1 hour at 4 °C d egrees in PBSA (PBS+0.5% BSA). Cells were washed once and analyzed via flow cytometry on an Accuri (BD Biosciences). Assay was performed in biological and technical triplicates. EC50 was determined in Prism.
Phospho-Flow Cytometry
SKW3 T cells were rested overnight in RPMI complete. KG-1 antigen presenting cells were pulled with desired concentration of peptide for 2 hours. KG-1 cells were washed and re-suspended with SKW cells. Cells were mixed 1:1 with 125,000 cells of each cell line per well. Cells were co-cultured for 15 minutes at 37 °C. Cel ls were immediately fixed with 4% PFA (Sigma) and centrifuged at 1500 rpm for 15 minutes. Cells were re-suspended in 100 l of Cytofix (BD 554655) and were left at 37° C for 30 minutes. Cells were washed with PBS+2% FBS, and permablized in ice cold methanol or Perm Buffer III (BD) on ice for 30 minutes. Cells were transferred to deep well blocks, and were washed 3x with PBS+2% FBS. Samples were stained with a 1:50 dilution of anti-pERK1/2 (Cell Signaling # 4780S), and 1:100 of Anti-CD3 (UCHT-1-APC, BD Biosciences) for 1 hour at room temperature shaking. Cells were washed once and analyzed via flow cytometry on an BD Accuri. Assay was performed in biological and technical triplicates.
Calcium Imaging
pMHC, Anti-CD3 (clone OKT3), or Bovine IgG were plated on FluoroDish (World Precision Instruments FD3510–100) at the indicated concentrations in 1xHBS overnight at 4 °C. Fluo4 was dissolved in DMSO to 4 mM and divided into 0.5 l aliquots. On day of imaging, T cells were rested for 2 hours in fresh RPMI complete. Just before imaging, 1×10⁶ cells were centrifuged at 2000 rpm for 90 seconds and re-suspended in 200 μl of HBS pH 7.2. 200 μl of 2.5 mM probenecid (dissolved in HBS) was added to one 0.5 μl aliquot of 4 mM Fluo-4. Cells were mixed with the Fluo4-probenecid solution and 200 l of RPMI (non-supplemented). Cells were incubated in the dark for 20–30 minutes at room temperature. Cells were centrifuged at 2000 rpm for 90 seconds and re-suspended in 200 μl of 2.5 mM probenecid/HBS. FluoroDishes containing ligand were washed once with 250 μl of HBS. 100 μl of cells were pipetted on the Fluorodish and imaged at 488 nm excitation with a frame rate of 500 ms. Movies were taken with a Zeiss Axio Observer 7 and Photometrics Prime camera. Assay was performed in biological triplicates. Movies were analyzed using a modified version of Calquo (https://www.nano-immunology.org/software.html) to detect single-cell landing events on the prepared coverslip surfaces, and to record fluorescence intensities over time at the coverslip surface. Briefly, for each cell, stable changes in fluorescence intensity above background levels were indicative of the cell ‘landing’ and calcium responses associated with SKW T-cell signaling (>1.5 fold fluorescence intensity above ‘landing’ intensity). For each cell, the time lapse between ‘landing’ and ‘signaling’ was also determined. All cells were individually analyzed and the fraction of signaling cells was determined from the total number of cells detected after landing, provided that cells landed before frame 480, in order to allow 3 minutes for signaling to occur.
Electroformation of GUVs
Lipids were mixed in chloroform (Electron Microscopy Sciences, 12550) in a glass vials (Thermo Scientific, C4010–1, C4010–60A) using Hamilton syringes (Hamilton, 1701, 1705, 1710). Separate syringes were used for fluorescent and non-fluorescent lipids. The total lipid concentration should be between 2 mg/ml and 10 mg/ml. For this study, GUV composition was 94.9% POPC (Avanti, 850457), 5% DGS-NTA (Avanti, 790404), 0.1% Atto 390-DOPE (AttoTec, AD390–161) (total [lipid] ~3mM). An Ohmmeter (Neoteck, NT8233D) was used to identify the conductive side of the ITO-coated slide (Sigma Aldrich, 636908). Using a Hamilton syringe, 10 μl of lipid solution was spread in each of three spots on the conductive surface of a slide that was kept warm on 37 °C heat block. The lipid contai ning ITO-coated slide was immediately placed into a vacuum desiccator (Thermo Scientific, 53110250) and allowed to dry for at least 1 hour.
U-shaped Silicone gaskets cut from silicone sheet, (McMaster-Carr, 9010K12) were cleaned with soap and water then rinsed with acetone and ddH2O, and dried with a Kimwipe. The gaskets were pressed onto to the conductive side of the ITO-coated slide, directly around the dried lipid films. Conductive copper tape (StewMac, 0036) was affixed to the conductive side of ITO-coated slide with the gaskets and dried lipid film and to a second ITO-coated slide, at the corners. The second ITO-coated slide was pressed on top of the gaskets, with the conductive surface facing the gaskets, so that the two ITO-coated slides form a capacitor-like configuration. Two binder clips were used to fix the slide chamber. The gaskets were then filled with appropriate volume of 370 mM sucrose solution (~200 uL). The chambers were then carefully sealed using modeling clay (Sculpey, 301209), while avoiding introducing bubbles.
The ITO-coated slides were connected to a function generator (B&K Precision, 4012A) via wires with alligator clips and the copper tapes. The chamber was then placed into a 60 °C oven. An alternating voltage (1–4 V, 10 Hz) was applied for 3 hours, during which GUVs formed within the slide chamber. The optimal voltage for forming GUVs was empirically determined. Greater than 5V voltage should not be used as it could damage the ITO slides.
After the 3-hour formation, the GUV chamber was removed from the oven, and carefully disassembled. The modeling clay was removed and GUV solution was withdrawn using a P200 pipette with a blunt tip. GUVs were stored at room temperature and imaged within one week. For more information see (Schmid et al., 2016).
Reconstitution of membrane interfaces
Prior to protein functionalization, SLBs were incubated with 0.6 μg/mL Cy2-Streptavidin (Jackson ImmunoResearch, 016-220-084) for 10 minutes then washed 6 times with ½ total well volume of phosphate buffered saline pH 7.4. GUVs and SLBs were then separately incubated for one hour. CD45 RABC was added to GUVs at a final concentration of 20 nM, and TCR55 was added to GUVs at a final concentration of 5 nM. The indicated pMHC (HIV, Pep20, SQL,) was added to the supported lipid bilayer at a final concentration of 10 nM. Proteins were diluted in reaction buffer (50 mM HEPES, 150 mM NaCl, 1 mM TCEP, 1 mg/mL bovine serum albumen, pH 7.4) and then mixed 2:1 with GUVs, or added to supported lipid bilayers. SLBs were washed 6 times with ½ total well volume resulting in a final concentration of ~1% input protein remaining. The GUVs were not washed but were diluted 10-fold into the imaging well with the supported lipid bilayer after a 1 hour incubation. GUVs were allowed to settle for 30–60 min prior to imaging. SLB fluidity was assessed by visualizing diffusion of unbound GUV proteins that associate with the supported lipid bilayer (e.g. TCR, CD45). If >25% of fluorescent molecules on the SLB were not diffusive, the experiment was repeated with a more fluid bilayer.
Preparation of SLBs for Zap70 imaging
Small unilamellar vesicles (SUVs) were prepared from a mixture of 97.3% POPC (Avanti), 2% DGS-NGA-Ni (Avanti), 0.5% PEG5000-PE (Avanti), and 0.2% Biotinyl Cap PE (Avanti). The lipid mixture in chloroform was evaporated under argon and further dried under vacuum. The mixture was then rehydrated with phosphate buffered saline pH 7.4 and cycled between −80 °C and 37 °C 20 times, and then centrifuged for 45 min at 35,000 RCF. SUVs made by this method were stored at 4 °C and used within two weeks of fo rmation. Supported lipid bilayers were formed in freshly plasma cleaned custom PDMS chambers on RCA cleaned glass coverslips. 100 μL of SUV solution containing 0.5 to 1 mg/ml lipid was added to the coverslips and incubated for 30 min. Unadsorbed vesicles were removed and bilayers were blocked by washing three times with reaction buffer (50 mM HEPES, 150 mM NaCl, 1 mM TCEP, 1 mg/mL bovine serum albumen, pH 7.4), and incubating for 20 min. Percent of cells that clustered was calculated by manual scoring of cells that were randomly selected, the error reported is the standard deviation for 2 pooled biological duplicates. Total number of cells reported in figure legend.
TIRF microscopy setup for Zap70 imaging
Imaging was performed on a Nikon TI-E microscope equipped with a Nikon 100x Plan Apo 1.49 NA oil immersion objective, and four laser lines (405, 488, 561, 640 nm), a Hamamatsu Flash 4.0 and μ Manager software (https://micro-manager.org/). A polarizing filter was placed in the excitation laser path to polarize the light perpendicular to the plane of incidence. Angle of illumination was controlled with a Nikon TIRF motorized positioner.
Dwell time imaging chamber and SLBs
Single unilamellar vesicles (SUVs) were formed by tip sonication of a solution composed of 98 mol % 1,2-dioleoyl-sn-glycero-3-phosphocholine (DOPC) and 2 mol % 1,2-dioleoyl-sn-glycero-3-[(N-(5-amino-1-carboxypentyl) iminodiacetic acid) succinyl] (nickel salt) (Ni2+-NTA-DOGS) (Avanti) in Mill-Q water (EMD Millipore). Prior to experiments, No. 1.5 round coverslips with 25 mm diameter were ultrasonicated for 30 min in 50:50 isopropyl alcohol:water, rinsed thoroughly in Milli-Q water (EMD Millipore), etched for 5 min in piranha solution (3:1 sulfuric acid:hydrogen peroxide), and again rinsed thoroughly in Milli-Q water. The coverslips were used in the assembly of Attofluor chambers. SUVs were then deposited onto the coverslip with a 1:1 mixture of 1 mg/mL lipids and 1x Tris-buffered saline (TBS; 19.98 mM Tris, 136 mM NaCl, pH 7.4; Mediatech Inc.,). Bilayers were allowed to form for at least 30 min. The bilayers were rinsed with TBS, incubated for 5 min with 100 mM NiCl2 in TBS, rinsed with TBS, and then rinsed with a T cell imaging buffer composed of 1 mM CaCl2, 2 mM MgCl2, 20 mM HEPES, 137 mM NaCl, 5 mM KCl, 0.7 mM Na2HPO4, 6 mM d-glucose, and 1% w/vol bovine serum albumin. The Atto647-B35-HIV(Pol)-His10 protein described below was incubated with the functionalized SLB for 35 min followed by rinsing with imaging buffer. T cells were re-suspended in imaging buffer and added to the Attofluor chamber and were imaged immediately, with ongoing data collection up to 30 min. All other incubations during this protocol were performed at room temperature, and imaging experiments were performed at 37 °C.
Dwell time measurements via TIRF
TIRF dwell time experiments were performed on an inverted microscope (Nikon Eclipse Ti; Technical Instruments) using a custom-built laser launch with 488 nm (Sapphire HP) and 640 nm (Cube; Coherent Inc.) diode lasers, as described previously (O’Donoghue et al., 2013). Laser power was measured at the sample at 0.7 mW (640 nm) for the 400 ms exposure. Fluorescent images were recorded using an EM-CCD (iXon 597DU; Andor Inc., South Windsor, CT). ET660LP and ET700/75M filters were used for 647 nm channel imaging. Exposure times and time-lapse periods for most experiments were set using image collection software (MetaMorph 7.5; Molecular Devices Inc.,), which drives an external shutter (Uniblitz LS6; Vincent Associates,). Exposure times were measured directly from the Fire output of the EMCCD using an oscilloscope (TDS 210; Tektronix, Inc.). Single molecule diffraction-limited spots were detected in raw.tif image stacks of B35-HIV-10xHis-195c-647N or B35-Pep20–10xHis-195c-647N and filtered by size and intensity. Spot detections and linking were done with the TrackMate plugin for ImageJ. Size and intensity thresholds were first determined by eye using a test data set and then applied uniformly to all data collected with the same imaging conditions. The dwell time distributions are roughly exponential, with the bleaching rate being approximately 20 times slower than the observed dwell events. Further plotting and analysis were done with in-house developed Python scripts.
UV mediated peptide exchange
UV-sensitive pMHC monomer was produced by refolding (as described below) HLA B35 with a synthesized (Stanford Pan Facility) UV cleavable peptide VPLRPM’J’Y (here J represents Fmoc-(S)-3-amino-3-(2-nitrophenyl)propionic acid (ChemImpex, 15606). In a 96- well plate 10x UV-sensitive MHC monomer (12.5 μl of 5 μM), 10x desired exchange peptide (12.5 μl of 500 uM) were added to 100 l of 20 mM Tris-HCl pH 7.0, 150 mM NaCl. The plate was placed on ice and put under a UV lamp for 1 hr; distance of the UV lamp to the sample was 2–5 cm. The plate was then centrifuged for 5 min at 3300 g at room temperature 80 l of supernatant was transferred into tubes. Exchanged pMHC was either stored at 4 °C for 1 week and used or stored at −20 °C in 20% glycerol.
Surface plasmon resonance
Affinity measurements for TCR589 and TCR55 bound to peptides presented by HLA-B35 were determined by surface plasmon resonance on a Biacore T100 (GE Healthcare). For measurements of TCRs binding to HLA-B35-HIV(Pol448-456), the pMHC was refolded and biotinylated as described above and the TCRs were expressed using baculovirus. The TCRs were incubated with 3c protease in order to cleave off acidic and basic zippers. For measurements of library derived peptides, HLA B35 was refolded with a UV cleavable peptide VPLRPM’J’Y (here J represents Fmoc-(S)-3-amino-3-(2-nitrophenyl)propionic acid). UV mediated peptide exchange was performed as described above.
100–300 RU of pMHC exchanged with the peptide of interest were immobilized to a Biacore Series S SA Chip (GE healthcare). H2 Kb-VSV was used as the reference surface. SPR runs were performed in HBS-P+ (GE Healthcare) + 0.1% BSA. All measurements were made with 2 or 3 fold serial dilutions of TCR using 60 s association followed by 180 s dissociation at 10–30ul/min flow rate at 25° C. No regeneration of the surface was required because the samples completely returned to baseline during dissociation. Measurement of titrations at equilibrium were used to determine the KD using Biacore Analysis Software (GE Healthcare).
BFP assay
Bond life time measurements under force were captured using the Biomembrane Force Probe Assay (BFP). Procedures for coupling pMHC to glass beads have been described (Liu et al., 2014). In brief, RBCs were first biotinylated with EZ-link NHS-PEG-Biotin (Thermo Fisher Scientific) and then reacted to streptavidin; borosilicate beads were first cleaned, silanized, and then reacted to streptavidin-maleimide (Sigma-Aldrich). Streptavidinized beads were then coated with cognate pMHC (HLA B35-HIV(Pol448–456) or with B35-Pep20 or B35-pSQL and then to a RBC that is aspirated onto a micropipette. This bead serves as a force probe, the position of the edge of the bead can be tracked by the high-resolution camera (1,600 frames/sec) with <3nm displacement precision. The T cell of interest is brought into contact with the glass bead and then retracted a set distance and held by the computer-controlled piezoelectric actuator. The retraction and hold phase generates a force on the TCR:MHC bond, which can be altered, based on the distance the T cell is retracted. The camera then records the time it takes for the T cell to disengage the glass bead, which can visually be seen by the RBC retracting and the bead returning to its starting position. Multiple repeated cycles (known as force-clamp cycles) can be carried at a single force in order to generate an average bond lifetime between the TCR and peptide:MHC complex. By varying the force and measuring the bond lifetimes one determines what type of bond occurs. For optimal response to antigen the bond lifetimes increase with increasing force before reaching a peak bond lifetime, which is typical of a catch bond physiology. Alternatively, many protein:protein interactions show shorter bond lifetimes as force is applied to the bond (called a slip bond).
2D affinity measurements by BFP
The micropipette adhesion frequency assay was employed as previously described (Huang et al., 2010; Martinez et al., 2016). In brief, human RBCs were isolated in accordance with the Institutional Review Board approval. RBCs were coated with Biotin-X-NHS (EMD Millipore) streptavidin (Thermo Fisher Scientific) and then coated with pMHC HLA B35-HIV(Pol448–456) or with B35-Pep20 or B35-pSQL. pMHC coated RBC’s and TCR589 or TCR55 CD8 deficient T cells were aspirated onto apposing pipettes and brought into contact 50 times with the same and area (Ac) and time. An electronically controlled piezoelectric actuator repeated T cell contact with the pMHC coated RBC’s. Upon retraction of the T cell, adhesion (binding of TCR-pMHC) was observed by distention of the RBC membrane, allowing for quantification of adhesion frequency (Pa) at equilibrium. Surface pMHC (ml) and TCRbeta (mr) densities were determined by flow cytometry and BD QuantiBRITE PE Beads for standardization (BD Biosciences). The relative 2D affinities were calculated using the following equation: AcKa = -ln [1-Pa(1)]/mrml. Geometric mean affinities are reported ± SEM.
Protein Production and Purification
Baculovirus production of TCRs
Alpha and beta chains of TCRs were cloned separately into the pAcGP67a vector (BD Biosciences). Each of the chains used the polyhedrin promoter to express the TCR V region with human constant domains truncated at the connecting peptide, with an engineered cysteine to promote alpha and beta chain pairing. The alpha and beta chains either expressed a C-terminal acidic GCN4 zipper −6x His tag or a C-terminal Basic GCN4 zipper – 6xHis tag. Each chain contained a 3c protease site N-terminal to the zippers. Chains that contained the acidic zipper also had a biotinylation acceptor peptide (BAP) (GLNDIFEAQKIEWHE). DNA was cotransfected into 2 mL of SF9 cells at 1×10⁶ cells/ml with linearized baculovirus vector (Baculogold, BD Biosciences) with Cellfectin II (Life Technologies). The virus (P0) was harvested and was amplified at a dilution of 1:1000 in 25 ml cultures at 1 × 10⁶ cells/mL (P1 virus), 25 mls of supplemented SF900 was added 24 hours after addition of P0 virus. The P1 viruses of the TCR chains were then co-titrated in 2 mL of Hi5 cells at 2 × 10⁶ cells/mL to optimize TCR alpha and beta chains for 1:1 expression. Optimal titrations were decided by analysis via SDS-PAGE gel and Coomassie staining. Co-titrations ranged from 1:1000 to 1:250 for each chain.
P1 virus was used to infect volumes of 1L (scaling up as necessary) of Hi5 cells at ~2×10⁶ cells/mL. Cells were removed 2–3 days post infection and spun down at 2000 rpm for 10 minutes. The supernatant containing expressed protein was treated to 100 mM Tris pH 8.0, 1 mM NiCl2, and 5 mM CaCl2 to precipitate contaminants. The supernatant and precipitate mixture was spun down at 6000 rpm for 15 min at room temperature to remove precipitate. The supernatant was incubated for 3 hours with Ni-NTA resin (Qiagen) for ~3 hours at room temperature. Ni-NTA beads were collected and washed in a buchner funnel with 20 mM imidazole in 1 x HBS pH 7.2 and then eluted with 200mM imidazole in 1xHBS 7.2. Protein was concentrated in a 30 kDa filter (Milipore, UFC903024) to 500 μl– 1 mL. If necessary, protein was biotinylated overnight with BirA ligase, 100 μM biotin, 40 mM Bicine pH 8.3, 10 mM ATP, and 10 mM Magnesium Acetate at 4 °C overnight. If necessar y (for Biacore or crystallography) protein was treated with 3c protease overnight.
TCRs were purified by size-exclusion chromatography using an AKTAPurifier (GE Healthcare) using a Superdex 200 column (GE healthcare) in 1xHBS buffer pH 7.2. Fractions were collected at the proper size, and run on SDS-PAGE gel to confirm 1:1 stoichiometry and if necessary biotinylation or 3c cleavage. Fractions were pooled at TCRs were quantified by nanodrop and frozen at −80° C for storage.
Refolding of TCRs
TCR alpha and beta chains were cloned into the pET28a vector and separately expressed as inclusion bodies (IBs) in the E. coli strain BL21 (NEB). The IBs were lysed in 50mM Tis pH 8.0, 1% v/v TritonX-100, 1% w/v Na Deoxycholic acid, 100 mM NaCl, 5 mM MgCl2, and 0.2 mM PMSF, and benzonase. Following lysis, IBs were sonicated 10 mM Na EDTA was added and spun down for 15 min at 10,000 G at 4° C. IBs were washed twice with 50 mM Tris pH 8.0, 0.5% Triton X-100, 100 mM NaCl, 1mM Na EDTA, 1 mM DTT 0.2 mM PMSF and once in the same buffer omitting the Triton-X. IBs were solubilized in 20 mM Tris pH 8.0, 6 M urea, 0.5 mM EDTA, and 1 mM DTT. IBs were quantified and assessed for purity via SDS page, and run along side a BSA standard.
TCRs were refolded in 5 M urea, 100 mM TRIS pH 8.0, 2 mM Na-EDTA (pH 8.0) 400 mM L-Arginine-HCl (Sigma), 0.5 mM oxidized glutathione, 5.0 mM reduced glutathione, 0.2 mM PMSF at 4° C. 10 mgs of TCR α and 15 mgs of TCR β were injected into the cold stirring, refold buffer through a 27-gauge needle. This injection was repeated 2 additional times over every 12 hours. Refold mixture was transferred into dialysis tubing (8,000 MWCO), and was dialyzed against 10mM TRIS pH 8.0 for 36–48 hours changing the buffer every 12 hours.
The TCRs were purified using ammonium sulfide precipitation. The refolding mixture was brought up to 30% ammonium sulfide and stirred at 4° C for ~30 minutes. The mixture was spun down and the precipitate discarded. The refolding-ammonium sulfide mixture was then brought up to 60% ammonium sulfate and stirred at 4° C for 30 minutes. The mixture was then spun down at 10,000 g, the supernatant was discarded and the precipitate kept and dissolved in 1xHBS. The mixture was then dialyzed against 1xHBS overnight.
The TCR was then purified by size exchange chromatography in 10 mM TRIS as described above using an S200 column. Fractions were collected and analyzed by SDS PAGE and Coomassie staining. If necessary fractions were concentrated and put over anion exchange column (MonoQ) to separate α β heterodimers from β β homodimers. The resulting protein was again run on an SDS-PAGE gel to assess purity. Fractions were collected at concentrated andbuffer exchanged into 1xHBS pH 7.2 and quantified and stored as above.
pMHC Production
B35*01 and h 2m were cloned into the pET28a vector and separately expressed as inclusion bodies (IBs) in the ecoli strain BL21. For single molecule imaging or tetramer production the construct included the following modifications: a mutation of a cysteine at position 195 to allow for single molecule labeling, the addition of a C-terminal His10 for attachment to bilayers, or the addition of a C-terminal biotin acceptor peptide (BAP). The IBs were lysed in 50 mM Tris pH 8.0, 1% v/v TritonX-100 (Sigma Aldrich), 1% w/v Na-Deoxycholic acid, 100 mM NaCl, 5 mM MgCl2, and 0.2 mM PMSF, and benzonase. Following lysis, IBs were sonicated 10 mM Na EDTA was added and spun down for 15 min at 10000 G at 4 deg C. IBs were washed twice with 50 mM Tris pH 8.0, 0.5% Triton X-100 (Sigma Aldrich), 100 mM NaCl, 1 mM Na EDTA, 1mM DTT 0.2 mM PMSF and once in the same buffer omitting the Triton-X. IBs were solubilized in 20 mM Tris pH 8.0, 6 M urea, 0.5 mM EDTA, and 1 mM DTT. IBs were quantified and assessed for purity via SDS page, and run along side a BSA standard.
B35*01 was refolded in 100 mM Tris (pH 8), 2 mM Na EDTA, 400 mM L-arginine, 0.5 mM oxidized glutathione, 5.0 mM reduced glutathione, and 0.2 mM PMSF at 4° C. A protease inhibitor tablet (Roche) was added to prevent degradation. Three injections of 15 mgs of B35 and 5 mgs of h 2m were added ~12 hours to the refolding mixture for a total of 45 mgs of B35, and 15 mgs of h 2m. The refolding mixture was dialyzed against 20 mM Tris pH 8.0 for 36–48 hours changing buffer about ever 12 hours. The refolded material was filtered through a glass fiber filter and purified using weak anion exchange resin (DEAE Cellulose, Santa Cruz Biotechnologies) followed by purification via size exclusion chromatography (Superdex 200, GE Healthcare) and ion exchange (MonoQ 5/50, GE Healthcare).
Anti-CD45 Fab production
Mouse anti-human CD45 monoclonal antibody, clone Gap 8.3, was purified from supernatant of secreting hybridomas (ATCC® HB-12™). Cells were grown in DMEM supplemented with 10% FBS, Pen/Strep, 1x Sodium Pyruvate and 1x Glutamax. Gap8.3 was captured on immobilized protein A, eluted with 0.1 M Glycine, pH 3.0, immediately buffered with excess Tris-HCl pH 8.0, followed by gel filtration using on a Superdex Increase S200. mAb was fragmented using immobilized Papain (agarose resin; ThermoFisher Scientific), pre-activated with Cysteine-HCl at a final concentration of 20 mM, pH 7.0. Before digestion, Gap 8.3 was buffer exchanged to 20 mM Sodium Phosphate, 10 mM EDTA, pH 7.0. For the digestion, up to 10 mg of mAb in 1 ml, supplemented with 20 mM Cysteine-HCl, pH 7.0, were incubated with 1 ml of activated immobilized Papain bead slurry and left shaking at 37C for 16–18 hours. The Fc portion was separated from Fab by capture on immobilized protein A. All pre- and post-protein A purification samples were characterized by gel electrophoresis and the Fab containing samples were further purified by size exclusion using HBS buffer (10 mM HEPES, 150 mM NaCl).
Fluorescent labeling of recombinant proteins
B35 −195c was incubated with 10-fold molar excess of maleimide-Atto 647N (Atto-tec, cat # 647N-41; reconstituted to a 10 mM stock solution in DMSO) and TCEP (Sigma), for 2 hours at room temperature, protected from light. After incubation, 10-fold molar excess of Gluthatione, relative to protein molarity, (Sigma) was added and excess free dye was removed by gel filtration using a Superdex Increase S75 (GE).
For labeling protein with NHS chemistry, proteins of interest were incubated with a 10-fold molar excess of reconstituted Alexa Fluor NHS Ester (Thermo Fisher) for one hour at room temperature in the presence of 10 mM Sodium Bicarbonate, adjusted to pH 9.0. After incubation, excess free dye was removed by gel filtration using Superdex Increase S75 (GE).
Creation and selection of B35 yeast libraries
To obtain a functional HLA B35 yeast display platform, error-prone evolution of a single-chain peptide-h β2m-HLA-B35 expressed on the surface of the S. cerevisiae strain EBY100 as an N-terminal fusion to Aga2 using the pYAL vector. The GenemorphII random mutagenesis kit (Agilent) was used to lightly mutagenize the region of the vector encoding HIV(pol)-h β2m-HLA B35 (pYAL-B35(HIV)). Briefly, 20 μg of pYAL-B35(HIV) was used as a template for the error-prone mutazymeII reaction. This product was amplified to generate 50 μg of insert DNA. Libraries were created by electroporation of chemically competent EBY100 with mutagenized insert and 10 g of linearized pYAL vector. Successful homologous recombination of the insert with parental vector was verified by sanger sequencing (Sequetech). The error rate of the library was ~3 amino acid mutations per Kb. Selections were performed as described below. Functional surface expression was obtained following a single mutation, S116F (Figure S4). This mutation, in the F-pocket, is found in other B35 alleles such as HLA B35*03 and B35*06 (https://www.ebi.ac.uk/ipd/imgt/hla/).
B35-peptide yeast display libraries were created as previously reported (Birnbaum et al., 2014). Briefly, primers allowing all 20 amino acids via NNK codons at all peptide positions except the defined anchors (see Mendeley Data). The libraries allowed for limited diversity at P2 and P9 to maximize the number of correctly folded pMHC clones on the surface of yeast. pMHC libraries were generated by electroporation of chemically competent EBY-100 cells via homologous recombination of linearized pYAL vector and library containing single chain trimer pMHC construct, the heavy chain was modified with a Y84A mutation to allow for the peptide to thread through the MHC groove as well as the selected S116F mutation described above. The final library had a diversity of about 2 × 10⁸ yeast transformants which was determined by colony counting after limited dilutions.
Yeast were passaged in SDCAA and induced with SGCAA and selected with streptavidin (SA) - coated magnetic MACS beads (Miltenyi) coated with biotinylated TCR. 10x diversity of library from the previous selection step (for round 1 selection 10x the library diversity) were used for each round of selection. First, yeast were incubated on a rotator at 4° C for 1 hour in 10 mL of PBS+ 0.5% bovine serum albumin and 1 mM EDTA (PBE) with 250 μl of SA beads. Yeast-bead mixture negatively selected by passing through an LS Column (Miltenyi) attached to a magnetic stand (Miltenyi) and washed 3 times with PBE while the flow through was collected. The elution from the column contained yeast clones that non-specifically bound to the beads. The flow through was subsequently incubated with 250 μl SA beads preincubated with 400 nM of TCR for 3 hours at 4° C on a rotator. The yeast were washed and centrifuged at 5000 g for 1 minute. The yeast -TCR coated bead mixture was resuspended in 5 mL of PBE and was then passed over a new LS column and the subsequent elution from the column was grown in 3 mLs of SDCAA pH 4.5 overnight. Once the yeast reached OD > 2, they were induced in SGCAA for 2–3 days before the next round of selection. Rounds 2 and 3 were done used 50 l of SA-beads or TCR coated beads in 500 μl of PBE. The fourth round of selection was performed by first doing a negative selection with 400 nM streptavidin-647 (SA-647) in 500 μ l for 1 hr at 4° C, followed by a 20 minute incubation with 50 μl of microbeads coated with anti-647 (miltenyi). The positive selection was performed by incubating the yeast for 3 hrs at 4° C with 400 nM TCR tetramer followed by 20 minutes of incubation with anti-647 beads. All rounds were monitored with anti-c-myc (Cell Signaling) staining which was done for 1 hr on ice. Primers for creation of error prone and peptide libraries can be found in Mendeley Data.
Deep sequencing
DNA was isolated from each round of selection using the a Zymoprep II Kit (Zymo Research). 5 × 10⁷ yeast from each round were lysed and DNA was extracted. Individual barcodes and random 8mer sequences were encoded by PCR primers. These primers amplified a single peptide of the construct through the middle of β 2m. These PCR products were extracted and subsequently amplified adding the Illumina chip primer sequences to generate the final products. These produces encoded (5’−3’) P5 Truseq read – 1-N8-barcode-pMHC-(N8)- P7–2 Illumina Truseq read. The library was purified by agarose gel purification and quantified by nanodrop and BioAnalyzer (Agilent Genomics). The library was deep sequenced by Illumina Miseq sequencer using either a 2×150 V2 or V3 kit for a low diversity library. Primers used for barcoding can be found in Mendeley Data.
Analysis of deep sequencing data
Paired-end reads were determined from the deep sequencing results using PandaSeq (Masella et al., 2012). Paired-end reads are parsed by barcode using Geneious V6 to identify the round of selection. All nucleotide sequences with less than 10 counts in rounds 3 and 4 of the selection and which differed by only 1 nucleotide sequence from another sequence in the round were coalesced to the dominant sequence. Any data with frameshifts or stop codons were removed from further analysis. Sequences were processed using custom Perl scripts and shell commands.
Hamming distances were calculated using MATLAB (Mathworks Inc.) by iterating through each peptide against all other peptides from the selected round 3 library sequences. The output score generated is the number of matching amino acid positions between peptides.
Crystallization and x-ray data collection
For the TCR589-B35-HIV complex, TCR589 was expressed using baculovirus and B35-HIV was refolded and purified separately, as described above. The TCR was treated with 3c protease and carboxypeptidases A and B. TCR589 and B35-HIV were mixed at a 1:1 molar ratio and concentrated to 13 mg/ml. Crystals formed in 100 nl sitting drops in 0.1 M Tris pH 8.0, 20% PEG 3350, 0.002M ZnCl.
For both the TCR55 complexes, the TCR was refolded and purified as described above. The TCR and pMHC of interest were mixed at a 1:1 ratio and concentrated to 11 mg/ml. Crystals of the TCR55-HIV-B35 complex formed in 100 nl sitting drops in PEG 4000, 0.1 M sodium cacodylate, pH 6.0, 0.2 M (NH4)2SO4 from the TOPS Screen (Bulek et al., 2012). For the TCR55-p20-B35, crystals formed in sitting drops in 0.04 M KH2PO4, 16% w/v PEG 8000, 20% v/v Glycerol.
All crystals were flash frozen in liquid nitrogen in 25% ethylene glycol + mother liquor. Data sets for the 589-B35-HIV complex and 55-B35-Pep20 complex were collected at Stanford Synchrotron Radiation Lightsource (Stanford, CA, USA) beamline 12–2. The data sets for the TCR55-HIV-complex was collected at Advanced Light Source (Berkeley, CA, USA) at beamline 8.2.2. Data were indexed, integrated and scaled using either XDS/XSCALE or the HKL-2000 program suite (http://www.hkl-xray.com/) (Kabsch, 2010).
Structure determination and refinement
All structures were solved using molecular replacement using the program Phaser (McCoy, 2007). The molecular replacement search model for B35 was an unliganded B35 molecule and β; 2m as separate chains (1A1N). For TCR589 the alpha chain of the SB27 TCR (PDBID: 2AK4), and for the TCR589 β; the beta chain of the SB47 TCR was used (PDBID: 4JRY) as search models. For the TCR55 α; chain, the search model was the alpha chain of the 9c2 TCR (PDBID: 4LFH). For the TCR55 β;, the search model was the beta chain of the MR1 TCR (PDBID: 4PJ5). For the TCR55-Pep20-B35 complex the solved TCR55 structure was used as a search model. For all TCR chains the CDR3 was deleted to avoid model bias. Manual model building of the peptide and the CDR3 loops was done in COOT followed by iterative rounds of refinement with Phenix (Adams et al., 2010) (https://www.phenix-online.org/), using TLS constraints for the 589-HIV-B35 structure. Figures were made with PYMOL (https://pymol.org/2/). Structures have been deposited in the RCSB protein data bank with accession codes 6BJ3, 6BJ2, and 6BJ8.
Computational methods for MD simulations
For the TCR55-B35(HIV) and TCR55-B35(Pep20) systems, the crystallographic coordinates of the TCR55 Vαβ domains (residues 3–112 in chain D and residues 4–115 in chain H), B35 MHC α1–2 domains (residues 3–180 in chain A), antigen (chain C) and structural waters were taken from the PDB files which have additional domains including TCR55 Cαβ, MHC α3 and β2M. AmberTools16 was used to add hydrogen atoms to the heavy-atom only crystallographic coordinates. A capping acetyl group (ACE) was added to every N-term truncated in the middle of a protein domain. An N-methyl amide capping group (NME) was added to every C-term truncated in the middle of a protein domain. The TCR55(Vαβ)-antigen-B35(α1–2) system was oriented such that the N-term to C-term antigen axis (the +x shear direction defined in the main text) was aligned in the +z direction of the simulation box. The oriented protein complex together with the structural waters were then solvated in a water box of 93×83×113 Å3 pre-equilibrated water molecules, where enough room was left out in the +z direction for shearing. Na+ and Cl- ions were added to balance out the net charge of the protein complex and also to set the NaCl concentration to 154 mM. The above processes were done with AmberTools16 (Case, 2017). The final simulation box contained about 80,000 atoms.
The MD simulations were performed using NAMD version 2.12 (http://www.ks.uiuc.edu/Research/namd/). The following parameters were used for the common part of setting up the MD simulations: Amber ffSB14 force field for protein (Maier et al., 2015) and TIP3P force field for explicit water solvent, particle mesh Ewald method for periodic boundary conditions, 9 Å cut-off distance for van der Waals and electrostatic interactions, 11 Å between pairs of atoms for inclusion in pair lists that are used to calculate van der Waals and electrostatic interactions, 1 fs integration time step, Langevin thermostat at 310 K and Nosé-Hoover Langevin piston pressure at 1 atm for simulating the NPT ensemble. To relax the initialized protein-solvent interface created in the simulation box, each TCR55(Vαβ)-antigen-B35(α1–2) system underwent the following series of simulations: 30,000 steps of minimization and 10 ns of NPT simulation with the atoms of the protein complex fixed, followed by 5 ns of NPT simulation with all atoms free.
Gaussian Accelerated Molecular Dynamics (GaMD) were used to explore the conformational space of the TCR-pMHC system for Pep20 antigen with and without external force (Miao et al., 2015). NAMD version Git-2017-11-28 was used for the GaMD simulation (Pang et al., 2017). GaMD is an unconstrained enhanced sampling method which adds a harmonic boost potential to smoothen the potential energy surface of the simulation system. For our purpose, only GaMD was used to reveal distinct structural flexibility and identify proper collective variables, instead of obtaining free energy profiles through reweighting an extensive GaMD simulation.
A concise description of the GaMD methodology is given here that introduces the module of the method that we used for our purpose. For a system of N atoms , GaMD sets a threshold energy in comparison with the total potential (v) to determine a boost potential which is added on top of during the GaMD simulation:
where k is the harmonic force constant.
In determining the two adjustable parameters and, 1 ns of preparatory conventional MD was run to collect the maximum, minimum, average and standard deviation of the system potential energiesVmax Vmin, Vavg, and ϭv during the 1 ns simulation. The following formula
was used to determine E and k:
which correspond to the default values in setting up the GaMD calculation in NAMD.
25 ns GaMD simulations for TCR55-Pep20-B35 system were run with and without external force respectively and collected the trajectories of several collective variables, including the orientation of the TCR about the pMHC assembly (the azimuthal angle φ), the vector components between the center of masses of TCR and MHC, and several salt-bridges and hydrogen bonds that are present in the crystal structure or formed during the GaMD simulations (Fiorin et al., 2013). These sampled data of collective variables were used for Principal Component Analysis (PCA) (Maisuradze et al., 2009). Dim1 which shares the most information with the azimuthal angle φ and Dim2 which shares the most information with the salt-bridge CDR2α-Glu55 and MHCα2-Arg157 are the top two principal components that capture most of the covariance (see Mendeley Data).
The azimuthal angle φ and the Glu55-Arg157 salt-bridge was used as the collective variables (CV) for the free energy sampling using Adaptive Biasing Force (ABF) method (see SI). The biasing force was applied to these two CVs. The potential of mean force (PMF) as a function of these two CVs were calculated by integrating the reversible work done by the mean force from the accumulated force measurements in the CV space: −12° to 8° for the azimuthal angle φ in bins of 0.5°, 3.5 Å to 13.5 Å for the Glu55-Arg 157 salt-bridge in bins of 0.2 Å. The number of samples in a bin prior to application of the ABF was set to 10,000. The maximum magnitude of the ABF force for both CVs was set to 10, where the unit of force is kcal/mol divided by the respective CV unit. 50 ns MD simulation for each case was performed and convergence of the free energy was checked.
After obtaining the free energy minima from the ABF sampling as the starting points, shearing simulation was performed by steered molecular dynamics (SMD) (Isralewitz et al., 2001). Constant velocity SMD simulations have been used by other researchers to study the molecular mechanism of catch bond formation (Lou and Zhu, 2007; Manibog et al., 2014). Constant velocity SMD was used to shear the center of mass of TCR Vαβ in the +x direction, relative to the MHC. Here, +x is defined as the axis of the peptide pointing towards the C-terminus (Figure 7D). The center of mass of TCR Vαβ is attached via a harmonic spring with force constant 1.0 kcal/mol/Å2 to a point in space that is pulled at constant velocity of 20 Å/ns along the +x direction. The SMD simulation was run over a period of 2 ns, leading to a total displacement of 40 Å in the range of x ≈ 10 – 50 Å, where x ≈ 10 Å at the starting point. For -x, ±y, and ±z direction, SMD simulations with a constant velocity of 20 Å/ns and an external force of 13.9 pN applied along the respective axis were performed till the TCR reaches the boundary of the simulation box.
Assembling starting structures for steered MD
Starting with the relaxed crystal structure of TCR55-B35(Pep20) (denoted Pep20xtal) the ABF sampling method (Darve et al., 2008; Hénin et al., 2010) was applied under a constant external force of 13.9 pN applied in the +x direction. The magnitude of the external force is not strong enough to cause dissociation between TCR-pMHC or lead to a net displacement along the +x direction. The sampling under external force gave rise to the energy minimized structure Pep20min, which differs from the crystal structure (Pep20xtal with φ = 0° and r SB = 7.5 Å) in that φ = −2° and r SB = 3.9 Å and by 1.22 Å RMSD (see Mendeley Data). Pep20min does not have the following direct hydrogen bonds that are present in Pep20xtal: P4(Thr) with CDR1α Ser31, P6(Asp) and Tyr74 at the MHC β-sheet groove base.
For TCR55-B35(HIV), the same procedure yielded HIVmin. An alternative starting structure for the HIV system was obtained by mutating Pep20min to HIV in silico, and is denoted as HIVmut
The shearing simulation that started from HIVmut also revealed slip bonds (see Mendeley Data). For TCR55-B35(SQL), the same alternative procedure yielded SQLmut. Pep20min, HIVmin, HIVmut and SQLmut are starting points for shearing the TCR with respect to the MHC to assess the integrity of the TCR-antigen interactions. Pep20min and HIVmin followed the same procedure of free-energy sampling from their respective crystal structure. No crystal structure is available for the SQL system, therefore we obtained SQLmut by mutating the peptide from Pep20min to SQL and minimizing the complex. We also obtained HIVmut by this alternative procedure to show the lack of a catch bonds does not depend on the starting point (see Mendeley Data).
Quantification and Statistical Analysis
All data are expressed as the mean ± the standard deviation (SD) (for technical triplicates) or mean ± the standard error of the mean (SEM) (for biological triplicates), is stated in the figure legends, results, and methods details. The exact value of n and what n represents (e.g., number of cells, single molecule ligand binding events or experimental replicates) is stated in figure legends and results. All data except dwell time measurements (in methods details and below) were plotted and analyzed in Prism.
Data related to CD69 and pERK assays (Figures 3, 5, and Figures S3, S5). Data were analyzed using Flowjo to gate live, CD3+ SKW3 cells. T cells were then gated on CD69 expression using the negative control (no peptide). The mean MFI expression of CD69 and pERK of CD3+ cells is reported. All measurements were done in biological and technical triplicate, only one representative biological triplicate is shown. SD (n=3) are used and listed in the figure legends. EC50 was calculated in prism using a non-linear fit of log(agonist) vs dose response. The r2 for KD vs Ec50 was calculated in prism using a linear regression.
Zap70 clustering (Figure 3). Percent of cells that clustered was calculated by manual scoring of cells that were randomly selected, the error reported is the standard deviation for 2 pooled biological duplicates. Total number of cells reported in figure legend.
Percent of cells that separated CD45 were calculated by manual scoring of GUVs that were randomly selected, the error reported is the SEM for biological triplicates. Total number of GUVs analyzed are reported in figure legend.
Dwell time measurements (Figure 2 and Figure S6). Single molecule diffraction-limited spots were detected in raw.tif image stacks of agonist pMHC-647N and filtered by size and intensity. Spot detections and linking were done with the TrackMate plugin for ImageJ. Size and intensity thresholds were first determined by eye using a test data set and then applied uniformly to all data collected with the same imaging conditions. The dwell time distributions are roughly exponential, with the bleaching rate being approximately 20 times slower than the observed dwell events. For each measurement four individual cells, with hundreds of tracks per cell were analyzed. Further plotting and analysis were done with in-house developed Python scripts.
BFP Force Experiments (Figure 6). Mean bond lifetimes were calculated from hundreds of measurements over a number of days (TCR55-p20 (749 lifetimes), TCR55-SQL (574 lifetimes), 589-HIV (571 lifetimes), TCR55-HIV (560 lifetimes)). All forces were measured on each day. Beads were coupled with pMHC to allow for ~10% adhesion frequency. SEM for measurements at each force are reported and were plotted in Prism.
Data and Software and Availability
Deep Sequencing
Deep sequencing of TCR55 selections of pMHC yeast display libraries are available in the sequence read archive under accession number SAMN08689057.
Structures
Structures described here have been deposited in the PDB with the following PDBIDs: 6BJ2, 6BJ3, 6BJ8.
Mendeley Dataset
Mendeley Dataset., doi:10.17632/sgff3j9sbg.1, has been deposited to include additional data relating to the manuscript. Below is an index of the files in the Mendeley Dataset.
Additional Information Related to Figure 5
Figure S5_Mendeley. Related to Figure 5. Representative flow cytometry plots of CD69 upregulation and Biacore traces for TCR55 and peptides selected via yeast display.
Additional Information Related to Figure 6
Movie of Zap70 accumulation of TCR55 w/ Pep20. Related to Figure 6.
Movie of dwell time imaging of TCR55 bound to Pep20. Related to Figure 6.
Additional Information Related to Figure 7
Figure S7_Mendeley1. Related to Figure 7. Set up of MD simulations
Figure S7_Mendeley2. Related to Figure 7. Bond vs shearing distance for TCR-B35-antigen systems in multiple directions
Oligonucleotide table
Oligonucleotide DNA sequences used for generating the pMHC-yeast display library and deep sequencing.
Supplementary Material
Figure S1. Related to Figure 1. High affinity non-agonists respond to non-specific stimuli. (A) Proliferation of TCR6 (top) and TCR11 (bottom) stimulated with CD3/CD28 beads (red) or non-specific HA peptide (Gray). (B) Tetramer staining of HCV-NS3(L5M) responsive clone (top) and non-responsive clone (bottom) with HLA-A2(L5M) (turquoise) and HLA A2-PPI (preproinsulin; gray). (C) CD107a immobilization of a responsive clone (top) and unresponsive clone (bottom) when stimulated with L5M (turquoise) or PPI peptide (Gray). (D) Tetramer staining (top panels) and CD107a (bottom panels) immobilization of L5N specific clones. Non-responsive clones are highlighted in yellow. (E) IL-2 release from anti-CD3 stimulation of transduced TCR clones 55 and 589 in 58−/− hybridoma cells ; Representative data (n=3) shown as mean ±SD (n=3).
Figure S5. Related to Figure 5. Relationship between ligand potency and affinity. (A) Validation of MHC UV exchange by tetramer staining of TCR55 (right) and TCR589 (left) expressing cell lines. Cells were stained with 100 nM tetramers not treated with UV (gray), B35-exchanged with non-specific peptide IPLTEKAEL (magenta), or exchanged B35-HIV(Pol). (B) Table of EC50 and KD values as determined by CD69 upregulation and SPR, respectively. (C) CD69 Emax vs SPR 3D KD; data shown as mean ± SEM (n=3). Lower two panels represent high affinity (salmon) and moderate/low affinity ligands (teal) correlation of SPR KD and Emax of CD69. (D) Equilibrium curves of TCR55 binding to pMHCs of interest at 250C. Data shown was measured at equilibrium (red dots). Black line shows the fit to a 1:1 binding curve. (E) Force directed clustering map depiction of unique peptides selected in post-round 3 highlighting: relatedness, as calculated by Hamming distance (left); read count, depicted as relative nodesize (middle); node size and color organized by signaling potency (right). (D-F) were generated in Cytoscape. See also Mendeley Data.
Figure S6. Related to Figure 6. Structural and functional interrogation of library derived peptides. (A) TIRF microscopy of B35-Pep20 binding to SKW3 T cells expressing TCR55. pMHC-binding slows down TCR diffusion. (B) Dwell time fit of B35-Pep20 bound to TCR55. (C) Max projection and quantification of Zap70 recruitment to TCR55 in response to B35-Pep20, TCR55-B35-HIV(Pol448–456) or TCR589-B35-HIV(Pol448–456) (data shown in Figure 3); data shown as mean ± SD of two replicate experiments, n = 200 cells in total of which 185 cells were activated. (D) Dose response of pERK by flow cytometry (E) Representative HIV(Pol448–456) antagonist assay where TCR55 T cells were stimulated with 1 uM of Pep20 and varying concentrations of HIV(Pol448–456) (n=3); Representative data shown as mean ± SD (n=3). (F) Super-imposition of Pep20 and HIV(Pol448–456) interactions with TCR55 CDR loops; and detailed interactions with TCR55-B35(Pep20) (bottom). (G) (top) B35-Pep20 P6-Asp (marine) interactions with B35 C-pocket (orange) and (bottom) P6E of HIV(Pol448–456) peptide (teal) binding to B35 C-pocket (orange). (H) 2D affinity of TCR589 to HIV(Pol448–456) (purple), TCR55 to B35-HIV(Pol448–456l) (aqua), TCR55 to B35-Pep20 (pink), TCR55 to B35-SQL (orange); error bars indicate ± SEM of dozens of measurements. (I) Schematic of GUV assay. (J) TCR-Triggering model. See also tables S1,S2, and Mendeley Data.
Figure S7. Related to Figure 7. Dissociation trajectories and molecular mechanism of catch bonds. (A) Bond distances vs. shearing distance starting from SQLmut in the +x direction. (B) Snapshots of the molecular catch bonds in the SQL system at shearing distances where old interactions have just broken or new interactions have just formed. (C) Snapshot of N-terminal lifting of Pep20 during dissociation, dashed lines represent molecular interaction. (D) Steric effect of conservative mutations in P1 that allow for N-terminal lifting. Pep20 is shown in marine blue, HIV in teal. (E) Comparison of the distance between P6-Asp or P6-Glu and B35-Arg97 for Pep20 and HIV, respectively, that allows catch bond #3 to be formed for Pep20 but not HIV. (F) Bond distances vs. shearing distance of alternative and additional catch or slip bonds formed in −y or −x directions. Catch bonds are outlined in a black box. (G) Summary of catch bond formation in the ± z direction. See also Mendeley Data and Movies S3–S5.
Movie S1. Related to Figure 2. Representative 2D dwell time movies Time-lapse TIRF imaging of single B35-HIV molecules (top panels) or null pMHCs (bottom panels) on functionalized SUVs binding T cells expressing either TCR55 (left panels) or TCR589 (right panels). Images were acquired every 1 seconds with an exposure of 500 ms. Scale bars represent 2 m. Movie is played at 21 fps for 300 frames for top panels, and for 100 frames looped 3 times for bottom panels.
Movie S2. Related to Figure 3. Representative Zap70 clustering movies TIRF Imaging of Zap70-GFP (cyan) movement in TCR589 (left) and TCR55 (right) expressing cells on a supported lipid bilayer functionalized with 1 pMHC molecule/ μM2 and ICAM. To generate this movie, images were recorded with an acquisition interval of 2 seconds with an exposure time of 50 ms for a total of 4 min and 12 seconds, total time was 10 minutes. Scale bars represent 5 m. The movie is played at 30 fps for 126 frames.
Movie S3. Related to Figure 7. Molecular dynamics simulation of TCR55 binding to B35-Pep20 under force The shearing of TCR55 (top, gray) along the N-term to C-term antigen axis (central, gray) with respect to MHC (bottom, gray) leads to four molecular catch bonds for the active antigen Pep20. In each catch bond, colored respectively in red, blue, green and purple, one of the residues in the starting bond colored in the lighter hue breaks its interaction, and forms a new interaction with a new bonding partner colored in the darker hue. The yellow dashed lines connect the bonds that are being formed in their equilibrium distances. The N-term of the Pep20 antigen peptide was lifted up by the purple catch bond between TCR and Pep20, providing a lasting resistance against the relative shearing of the TCR.
Movie S4. Related to Figure 7. Molecular dynamics simulation of TCR55 binding to B35-HIV(Pol) under force The shearing of TCR55 (top, gray) along the N-term to C-term antigen axis (central, gray) with respect to MHC (bottom, gray) and inactive antigen HIV leads to four molecular slip bonds, colored respectively in red, blue, green and purple, where the breaking of the old interactions in the lighter hues are not followed by the formation of the new interactions with the potential catching residues in the darker hues. TCR CDR loops may be out of focus in certain frames for focusing the slip bonds.
Movie S5. Related to Figure 7. Molecular dynamics simulation of TCR55 binding to B35-SQL under force The shearing of TCR55 (top, gray) along the N-term to C-term antigen axis (central, gray) with respect to MHC (bottom, gray) bound to the active SQL antigen leads to three molecular catch bonds, colored respectively in red, blue and green. The purple catch bond is briefly formed. TCR CDR loops may be out of focus in certain frames for focusing the catch bonds.
Figure S2. Related to Figure 1, 2, 3, 6. High affinity non-agonist TCR-pMHC interactions exist for class II restricted TCRs and form slip bonds (A) IL-2 secretion of 58−/− cells transduced with either TCR6 (black) and TCR11 (cyan) in response to DR4-HIV(Gag) (left) and 0.5 g of OKT3 (right); representative data (n=3) shown as mean ± SD (n=3). (B) SPR equilibrium analysis for TCR6 (black) and TCR11 (cyan) bound to DR4-HIV(Gag). (C) Kinetic SPR traces for TCR6 and TCR11. (D) Single-cell Fluo-4 fluorescent traces of Jurkat β−/− transduced with TCR6 (black) or TCR 11 (cyan) and stimulated with OKT3 (top) or DR4-HIV(Gag) (bottom). Representative data shown as mean ± SEM (n=3). (E) Bond lifetime vs force curves for TCR6 (black) or TCR11 (cyan) binding to DR4-HIV(Gag).
Figure S3. Related to Figure 3. Structural comparison of TCR55 and TCR589 bound to HLA B35-HIV(Pol448–456). (A) TCR55 and TCR589 TCR sequences and V gene usages. (B) Schematic of point mutation 195c to enable single molecule imaging. (C) Structural details of TCR55 and 589 bound to HIV. Top inset shows 8 Å shift measured from FG-loops. The CDR1/2α loops do not make contact with α2 helix, and instead make contact with the α1 helix of B35. The CDR1 loop, which harbors sequential tryptophans (WW-motif), pinches HLA B35-Arg62 to form a pi-stacking interaction with Trp29 that significantly contributes to the TCR-MHC interaction. In contrast, the majority of the contact made with the α2 helix of HLA B35 is via the long CDR3b loop (Table S2). (D) Representative pERK1/2 of TCR589 (aqua) and TCR55 (orange) when stimulated with 0.5 ng of OKT3. (E) Representative dose response of pERK with stimulation of HIV(Pol448–456) on cells expressing TCR589 (left) or TCR55 (right) (n=3). (F) Representative single cell Fluo-4 fluorescence traces for for TCR55 or TCR589 when stimulated with OKT3 (Top) or B35-HIV(Pol448–456) (bottom). See also Movie S1 and Table S1–3.
Figure S4. Related to Figure 4. Development of HLA B35 yeast display platform. (A) cMyc-tag enrichment for 3 rounds of selection of the B35*01 error-prone library. B) Post-round 4 tetramer staining of B35-library with 400nM TCR55 (orange) or TCR589 (aqua). (C) Consensus mutations found after TCR selection of the B35*01 error-prone library. (D) 116F mutation (magenta) required for B35 display. (E) Heatmap depicting relatedness based on the hamming distance of unique peptide sequences found in post-round 3 of the selection (n=131). Peptides shown along the x and y axis are sorted by selection frequency. (F) Top 20 most frequent peptides; read counts for each round of selection as determined from the deep sequencing analysis is shown.
Highlights.
High affinity but non-stimulatory T cell interactions occur in vivo.
Non-stimulatory pMHC ligands lack catch bonds.
Molecular dynamics reveals agonist/non-agonist interface chemistry.
Mechanism for decoupling pMHC binding from T cell activation.
Acknowledgments
We thank Vince Luca, Mark O’Dair, Christopher Jakobson, Ignacio Moraga, Naresha Saligrama, and Masafumi Takaguchi for helpful discussions. This study was supported by the NIH (5 T32 AI07290 to LVS, F31 CA216926–01 to MHG, U19 AI57229 to KCG and MMD, R01 AI103867 to KCG, R01AI096879 and R01AI129543 to BDE, R01AI0915180 and CA202241 to JTG, NCI 1U54 CA199090–01 to JRH), HHMI (KCG, MMD, RDV), NSF (GFRP to LVS, EFRI-ODISSEI 1332411 to WAG), Wellcome Trust (WT101609MA to RAF), Parker Institute for Cancer Immunotherapy and Jean Perkins Foundation (JRH). The Berkeley Center for Structural Biology is supported by the NIH, NIGMS and HHMI. The Advanced Light Source is a Department of Energy Office of Science User Facility under Contract DE-AC02–05CH11231. The Stanford Synchrotron Radiation Lightsource, SLAC National Accelerator Laboratory, is supported by the U.S. DOE, Office of Science, Office of Basic Energy Sciences under DE-AC02–76SF00515. The SSRL Structural Molecular Biology Program is supported by the DOE Office of Biological and Environmental Research, and by the NIH, NIGMS (including P41GM103393). Extreme 329 Science and Engineering Discovery Environment (XSEDE), 330 is supported by the NSF grant 331 ACI-1548562.
Footnotes
Publisher's Disclaimer: This is a PDF file of an unedited manuscript that has been accepted for publication. As a service to our customers we are providing this early version of the manuscript. The manuscript will undergo copyediting, typesetting, and review of the resulting proof before it is published in its final citable form. Please note that during the production process errors may be discovered which could affect the content, and all legal disclaimers that apply to the journal pertain.
Declaration of Interests:
LVS, MHG, and KCG are co-founders of 3T Biosciences.
References
- Adams JJ, Narayanan S, Liu B, Birnbaum ME, Kruse AC, Bowerman NA, Chen W, Levin AM, Connolly JM, Zhu C, et al. (2011). T cell receptor signaling is limited by docking geometry to peptide-major histocompatibility complex. Immunity 35, 681–693. [DOI] [PMC free article] [PubMed] [Google Scholar]
- Adams PD, Afonine PV, Bunkoczi G, Chen VB, Davis IW, Echols N, Headd JJ, Hung LW, Kapral GJ, Grosse-Kunstleve RW, et al. (2010). PHENIX: a comprehensive Python-based system for macromolecular structure solution. Acta Crystallogr D Biol Crystallogr 66, 213–221. [DOI] [PMC free article] [PubMed] [Google Scholar]
- Aleksic M, Dushek O, Zhang H, Shenderov E, Chen J-L, Cerundolo V, Coombs D, and van der Merwe PA (2010). Dependence of T cell antigen recognition on T cell receptor-peptide MHC confinement time. Immunity 32, 163–174. [DOI] [PMC free article] [PubMed] [Google Scholar]
- Allison KA, Sajti E, Collier JG, Gosselin D, Troutman TD, Stone EL, Hedrick SM, and Glass CK (2016). Affinity and dose of TCR engagement yield proportional enhancer and gene activity in CD4+ T cells. eLife 5. [DOI] [PMC free article] [PubMed] [Google Scholar]
- Beddoe T, Chen Z, Clements CS, Ely LK, Bushell SR, Vivian JP, Kjer-Nielsen L, Pang SS, Dunstone M.a., Liu YC, et al. (2009). Antigen ligation triggers a conformational change within the constant domain of the alphabeta T cell receptor. Immunity 30, 777–788. [DOI] [PubMed] [Google Scholar]
- Bentzen AK, Marquard AM, Lyngaa R, Saini SK, Ramskov S, Donia M, Such L, Furness AJS, McGranahan N, Rosenthal R, et al. (2016). Large-scale detection of antigen-specific T cells using peptide-MHC-I multimers labeled with DNA barcodes. Nature Biotechnology 34, 1037–1045. [DOI] [PubMed] [Google Scholar]
- Beringer DX, Kleijwegt FS, Wiede F, van der Slik AR, Loh KL, Petersen J, Dudek NL, Duinkerken G, Laban S, Joosten A, et al. (2015). T cell receptor reversed polarity recognition of a self-antigen major histocompatibility complex. Nature immunology 16, 1153–1161. [DOI] [PubMed] [Google Scholar]
- Bertoletti A, Sette A, Chisari FV, Penna A, Levrero M, Carli MD, Fiaccadori F, and Ferrari C (1994). Natural variants of cytotoxic epitopes are T-cell receptor antagonists for antiviral cytotoxic T cells. Nature 369, 407–410. [DOI] [PubMed] [Google Scholar]
- Bulek AM, Madura F, Fuller A, Holland CJ, Schauenburg A.J.a., Sewell AK, Rizkallah PJ, and Cole DK (2012). TCR/pMHC Optimized Protein crystallization Screen. Journal of immunological methods 382, 203–210. [DOI] [PMC free article] [PubMed] [Google Scholar]
- Carbone CB, Kern N, Fernandes RA, Hui E, Su X, Garcia KC, and Vale RD (2017). In vitro reconstitution of T cell receptor-mediated segregation of the CD45 phosphatase. Proceedings of the National Academy of Sciences 114, E9338–E9345. [DOI] [PMC free article] [PubMed] [Google Scholar]
- Case De.a. (2017). AMBER 2017. University of California, San Francisco. [Google Scholar]
- Chakraborty AK, and Weiss A (2014). Insights into the initiation of TCR signaling. Nature Immunology 15, 798–807. [DOI] [PMC free article] [PubMed] [Google Scholar]
- Chang VT, Fernandes RA, Ganzinger KA, Lee SF, Siebold C, McColl J, Jönsson P, Palayret M, Harlos K, Coles CH, et al. (2016). Initiation of T cell signaling by CD45 segregation at ‘close contacts’. Nature Immunology 17, 574–582. [DOI] [PMC free article] [PubMed] [Google Scholar]
- Dave E, Rodriguez-Gomez D, and Pohorille A (2008). Adaptive biasing force method for scalar and vector free energy calculations. The Journal of chemical physics 128, 144120. [DOI] [PubMed] [Google Scholar]
- Das DK, Feng Y, Mallis RJ, Li X, Keskin DB, Hussey RE, Brady SK, Wang J-H, Wagner G, Reinherz EL, et al. (2015). Force-dependent transition in the T-cell receptor β-subunit allosterically regulates peptide discrimination and pMHC bond lifetime. Proceedings of the National Academy of Sciences 112, 1517–1522. [DOI] [PMC free article] [PubMed] [Google Scholar]
- Davis SJ, and van der Merwe PA (2006). The kinetic-segregation model: TCR triggering and beyond. Nature immunology 7, 803–809. [DOI] [PubMed] [Google Scholar]
- Degano M, Garcia KC, Apostolopoulos V, Rudolph MG, Teyton L, and Wilson IA (2000). A functional hot spot for antigen recognition in a superagonist TCR/MHC complex. Immunity 12, 251–261. [DOI] [PubMed] [Google Scholar]
- Ding YH, Baker BM, Garboczi DN, Biddison WE, and Wiley DC (1999). Four A6-TCR/peptide/HLA-A2 structures that generate very different T cell signals are nearly identical. Immunity 11, 45–56. [DOI] [PubMed] [Google Scholar]
- Evavold BD, and Allen PM (1991). Separation of IL-4 production from Th cell proliferation by an altered T cell receptor ligand Science (New York, NY: ) 252, 1308–1310. [DOI] [PubMed] [Google Scholar]
- Fiorin G, Klein ML, and Hénin J (2013). Using collective variables to drive molecular dynamics simulations. Molecular Physics 111, 3345–3362. [Google Scholar]
- Gottschalk R.a., Hathorn MM, Beuneu H, Corse E, Dustin ML, Altan-Bonnet G, and Allison JP (2012). Distinct influences of peptide-MHC quality and quantity on in vivo T-cell responses. Proceedings of the National Academy of Sciences, 1–6. [DOI] [PMC free article] [PubMed] [Google Scholar]
- Govern CC, Paczosa MK, Chakraborty AK, and Huseby ES (2010). Fast on-rates allow short dwell time ligands to activate T cells. [DOI] [PMC free article] [PubMed] [Google Scholar]
- Hawse WF, De S, Greenwood AI, Nicholson LK, Zajicek J, Kovrigin EL, Kranz DM, Garcia KC, and Baker BM (2014). T cell receptor scanning of pMHC through complementary matching of receptor and ligand molecular flexibility(). Journal of immunology (Baltimore, Md : 1950) 192, 2885–2891. [DOI] [PMC free article] [PubMed] [Google Scholar]
- Hénin J, Fiorin G, Chipot C, and Klein ML (2010). Exploring Multidimensional Free Energy Landscapes Using Time-Dependent Biases on Collective Variables. Journal of Chemical Theory and Computation 6, 35–47. [DOI] [PubMed] [Google Scholar]
- Holler PD, and Kranz DM (2003). Quantitative Analysis of the Contribution of TCR/pepMHC Affinity and CD8 to T Cell Activation. Immunity 18, 255–264. [DOI] [PubMed] [Google Scholar]
- Hong J, Persaud SP, Horvath S, Allen PM, Evavold BD, and Zhu C (2015). Force-Regulated In Situ TCR–Peptide-Bound MHC Class II Kinetics Determine Functions of CD4+ T Cells. The Journal of Immunology 195. [DOI] [PMC free article] [PubMed] [Google Scholar]
- Hu KH, and Butte MJ (2016). T cell activation requires force generation. Journal of Cell Biology 213, 535–542. [DOI] [PMC free article] [PubMed] [Google Scholar]
- Huang J, Zarnitsyna VI, Liu B, Edwards LJ, Jiang N, Evavold BD, and Zhu C (2010). The kinetics of two-dimensional TCR and pMHC interactions determine T-cell responsiveness. Nature 464, 932–936. [DOI] [PMC free article] [PubMed] [Google Scholar]
- Huppa JB, Axmann M, Mörtelmaier M.a., Lillemeier BF, Newell EW, Brameshuber M, Klein LO, Schütz GJ, and Davis MM (2010). TCR-peptide-MHC interactions in situ show accelerated kinetics and increased affinity. Nature 463, 963–967. [DOI] [PMC free article] [PubMed] [Google Scholar]
- Isralewitz B, Gao M, and Schulten K (2001). Steered molecular dynamics and mechanical functions of proteins. Curr Opin Struct Biol 11, 224–230. [DOI] [PubMed] [Google Scholar]
- Johanns TM, Ertelt JM, Lai JC, Rowe JH, Avant RA, and Way SS (2010). Naturally Occurring Altered Peptide Ligands Control Salmonella-Specific CD4+ T Cell Proliferation, IFN-γ Production, and Protective Potency. The Journal of Immunology 184. [DOI] [PMC free article] [PubMed] [Google Scholar]
- Judokusumo E, Tabdanov E, Kumari S, Dustin ML, and Kam LC (2012). Mechanosensing in T lymphocyte activation. Biophysical journal 102, L5–7. [DOI] [PMC free article] [PubMed] [Google Scholar]
- Kabsch W (2010). XDS. Acta crystallographica Section D, Biological crystallography 66, 125–132. [DOI] [PMC free article] [PubMed] [Google Scholar]
- Kalergis AM, Boucheron N, Doucey M-A, Palmieri E, Goyarts EC, Vegh Z, Luescher IF, and Nathenson SG (2001). Efficient T cell activation requires an optimal dwell-time of interaction between the TCR and the pMHC complex. Nature Immunology 2, 229. [DOI] [PubMed] [Google Scholar]
- Kersh GJ, Kersh EN, Fremont DH, Allen PM, and Louis S (1998). High- and Low-Potency Ligands with Similar Affinities for the TCR : The Importance of Kinetics in TCR Signaling. 9, 817–826. [DOI] [PubMed] [Google Scholar]
- Kim J, Zhang CZ, Zhang X, and Springer TA (2010). A mechanically stabilized receptor-ligand flex-bond important in the vasculature. Nature 466, 992–995. [DOI] [PMC free article] [PubMed] [Google Scholar]
- Kim ST, Shin Y, Brazin K, Mallis RJ, Sun Z-YJ, Wagner G, Lang MJ, and Reinherz EL (2012). TCR Mechanobiology: Torques and Tunable Structures Linked to Early T Cell Signaling. Frontiers in immunology 3, 76–76. [DOI] [PMC free article] [PubMed] [Google Scholar]
- Kim ST, Takeuchi K, Sun Z-YJ, Touma M, Castro CE, Fahmy A, Lang MJ, Wagner G, and Reinherz EL (2009). The alphabeta T cell receptor is an anisotropic mechanosensor. The Journal of biological chemistry 284, 31028–31037. [DOI] [PMC free article] [PubMed] [Google Scholar]
- Klammt C, Novotna L, Li DT, Wolf M, Blount A, Zhang K, Fitchett JR, and Lillemeier BF (2015). T cell receptor dwell times control the kinase activity of Zap70. Nat Immunol 16, 961–969. [DOI] [PMC free article] [PubMed] [Google Scholar]
- Krogsgaard M, Prado N, Adams EJ, He X. l., Chow D-C, Wilson DB, Garcia KC, and Davis MM (2003). Evidence that Structural Rearrangements and/or Flexibility during TCR Binding Can Contribute to T Cell Activation. Molecular Cell 12, 1367–1378. [DOI] [PubMed] [Google Scholar]
- Linette GP, Stadtmauer EA, Maus MV, Rapoport AP, Levine BL, Emery L, Litzky L, Bagg A, Carreno BM, Cimino PJ, et al. (2013). Cardiovascular toxicity and titin cross-reactivity of affinity-enhanced T cells in myeloma and melanoma. Blood 122, 863–871. [DOI] [PMC free article] [PubMed] [Google Scholar]
- Liu B, Chen W, Evavold Brian D., and Zhu C (2014). Accumulation of Dynamic Catch Bonds between TCR and Agonist Peptide-MHC Triggers T Cell Signaling. Cell 157, 357–368. [DOI] [PMC free article] [PubMed] [Google Scholar]
- Liu Y, Blanchfield L, Ma VP-Y, Andargachew R, Galior K, Liu Z, Evavold B, and Salaita K (2016). DNA-based nanoparticle tension sensors reveal that T-cell receptors transmit defined pN forces to their antigens for enhanced fidelity. Proceedings of the National Academy of Sciences 113, 5610–5615. [DOI] [PMC free article] [PubMed] [Google Scholar]
- Lou J, and Zhu C (2007). A structure-based sliding-rebinding mechanism for catch bonds. Biophys J 92, 1471–1485. [DOI] [PMC free article] [PubMed] [Google Scholar]
- Luca VC, Kim BC, Ge C, Kakuda S, Wu D, Roein-Peikar M, Haltiwanger RS, Zhu C, Ha T, and Garcia KC (2017). Notch-Jagged complex structure implicates a catch bond in tuning ligand sensitivity. Science 355, 1320–1324. [DOI] [PMC free article] [PubMed] [Google Scholar]
- Luz JG (2002). Structural Comparison of Allogeneic and Syngeneic T Cell Receptor-Peptide-Major Histocompatibility Complex Complexes: A Buried Alloreactive Mutation Subtly Alters Peptide Presentation Substantially Increasing Vbeta Interactions. Journal of Experimental Medicine 195, 1175–1186. [DOI] [PMC free article] [PubMed] [Google Scholar]
- Maier JA, Martinez C, Kasavajhala K, Wickstrom L, Hauser KE, and Simmerling C (2015). ff14SB: Improving the Accuracy of Protein Side Chain and Backbone Parameters from ff99SB. Journal of Chemical Theory and Computation 11, 3696–3713. [DOI] [PMC free article] [PubMed] [Google Scholar]
- Maisuradze GG, Liwo A, and Scheraga HA (2009). Principal component analysis for protein folding dynamics. J Mol Biol 385, 312–329. [DOI] [PMC free article] [PubMed] [Google Scholar]
- Manibog K, Li H, Rakshit S, and Sivasankar S (2014). Resolving the molecular mechanism of cadherin catch bond formation. Nature Communications 5, 3941. [DOI] [PubMed] [Google Scholar]
- Martinez RJ, Andargachew R, Martinez HA, and Evavold BD (2016). Low-affinity CD4+ T cells are major responders in the primary immune response. Nature Communications 7, 13848. [DOI] [PMC free article] [PubMed] [Google Scholar]
- Masella AP, Bartram AK, Truszkowski JM, Brown DG, and Neufeld JD (2012). PANDAseq: paired-end assembler for illumina sequences. BMC Bioinformatics 13, 31. [DOI] [PMC free article] [PubMed] [Google Scholar]
- McCoy AJ (2007). Solving structures of protein complexes by molecular replacement with Phaser. Acta Crystallogr D Biol Crystallogr 63, 32–41. [DOI] [PMC free article] [PubMed] [Google Scholar]
- Miao Y, Feher VA, and McCammon JA (2015). Gaussian Accelerated Molecular Dynamics: Unconstrained Enhanced Sampling and Free Energy Calculation. Journal of Chemical Theory and Computation 11, 3584–3595. [DOI] [PMC free article] [PubMed] [Google Scholar]
- Minguet S, Swamy M, Alarcón B, Luescher IF, and Schamel WWA (2007). Full Activation of the T Cell Receptor Requires Both Clustering and Conformational Changes at CD3. Immunity 26, 43–54. [DOI] [PubMed] [Google Scholar]
- Moon JJ, Chu HH, Pepper M, McSorley SJ, Jameson SC, Kedl RM, and Jenkins MK (2007). Naive CD4(+) T cell frequency varies for different epitopes and predicts repertoire diversity and response magnitude. Immunity 27, 203–213. [DOI] [PMC free article] [PubMed] [Google Scholar]
- Natarajan K, McShan AC, Jiang J, Kumirov VK, Wang R, Zhao H, Schuck P, Tilahun ME, Boyd LF, Ying J, et al. (2017). An allosteric site in the T-cell receptor Cβ domain plays a critical signalling role. Nature Communications 8, 15260. [DOI] [PMC free article] [PubMed] [Google Scholar]
- O’Donoghue GP, Pielak RM, Smoligovets A.a., Lin JJ, and Groves JT (2013). Direct single molecule measurement of TCR triggering by agonist pMHC in living primary T cells. eLife 2, e00778–e00778. [DOI] [PMC free article] [PubMed] [Google Scholar]
- Pang YT, Miao Y, Wang Y, and McCammon JA (2017). Gaussian Accelerated Molecular Dynamics in NAMD. Journal of Chemical Theory and Computation 13, 9–19. [DOI] [PMC free article] [PubMed] [Google Scholar]
- Ploegh HL (1998). Viral Strategies of Immune Evasion. Science 280, 248–253. [DOI] [PubMed] [Google Scholar]
- Pullen RH, and Abel SM (2017). Catch Bonds at T Cell Interfaces: Impact of Surface Reorganization and Membrane Fluctuations. Biophysical Journal 113, 120–131. [DOI] [PMC free article] [PubMed] [Google Scholar]
- Rubio-Godoy V, Dutoit V, Rimoldi D, Lienard D, Lejeune F, Speiser D, Guillaume P, Cerottini J-C, Romero P, and Valmori D (2001). Discrepancy between ELISPOT IFN-γ secretion and binding of A2/peptide multimers to TCR reveals interclonal dissociation of CTL effector function from TCR-peptide/MHC complexes half-life. Proceedings of the National Academy of Sciences of the United States of America 98, 10302–10307. [DOI] [PMC free article] [PubMed] [Google Scholar]
- Saitakis M, Dogniaux S, Goudot C, Bufi N, Asnacios S, Maurin M, Randriamampita C, Asnacios A, and Hivroz C (2017). Different TCR-induced T lymphocyte responses are potentiated by stiffness with variable sensitivity. eLife 6. [DOI] [PMC free article] [PubMed] [Google Scholar]
- Sauer MM, Jakob RP, Eras J, Baday S, Eris D, Navarra G, Berneche S, Ernst B, Maier T, and Glockshuber R (2016). Catch-bond mechanism of the bacterial adhesin FimH. Nat Commun 7, 10738. [DOI] [PMC free article] [PubMed] [Google Scholar]
- Schmid EM, Bakalar MH, Choudhuri K, Weichsel J, Ann HS, Geissler PL, Dustin ML, and Fletcher DA (2016). Size-dependent protein segregation at membrane interfaces. Nature Physics 12. [DOI] [PMC free article] [PubMed] [Google Scholar]
- Shi Y, Kawana-tachikawa A, Gao F, Qi J, and Liu C (2017). Conserved Vd1 Binding Geometry in a Setting of Locus-Disparate pHLA Recognition by delta / alpha beta T Cell Receptors (TCRs): Insight into Recognition of HIV Peptides by TCRs. 1–17. [DOI] [PMC free article] [PubMed] [Google Scholar]
- Sloan-Lancaster J, and Allen PM (1996). Altered peptide ligand-induced partial T cell activation: molecular mechanisms and role in T cell biology. Annual review of immunology 14, 1–27. [DOI] [PubMed] [Google Scholar]
- Stone JD, Chervin AS, and Kranz DM (2009). T-cell receptor binding affinities and kinetics: impact on T-cell activity and specificity. Immunology 126, 165–176. [DOI] [PMC free article] [PubMed] [Google Scholar]
- Su LF, Kidd B.a., Han A, Kotzin JJ, and Davis MM (2013). Virus-specific CD4(+) memory-phenotype T cells are abundant in unexposed adults. Immunity 38, 373–383. [DOI] [PMC free article] [PubMed] [Google Scholar]
- Su X, Ditlev JA, Hui E, Xing W, Banjade S, Okrut J, King DS, Taunton J, Rosen MK, and Vale RD (2016). Phase separation of signaling molecules promotes T cell receptor signal transduction. Science. [DOI] [PMC free article] [PubMed] [Google Scholar]
- Ueno T, Tomiyama H, Fujiwara M, Oka S, and Takiguchi M (2004). Functionally Impaired HIV-Specific CD8 T Cells Show High Affinity TCR-Ligand Interactions. The Journal of Immunology 173, 5451–5457. [DOI] [PubMed] [Google Scholar]
- Yu W, Jiang N, Ebert PJR, Kidd BA, Müller S, Lund PJ, Juang J, Adachi K, Tse T, Birnbaum ME, et al. (2015). Clonal Deletion Prunes but Does Not Eliminate Self-Specific αβ CD8(+) T Lymphocytes. Immunity 42, 929–941. [DOI] [PMC free article] [PubMed] [Google Scholar]
- Zehn D, Lee SY, and Bevan MJ (2009). Complete but curtailed T-cell response to very low-affinity antigen. Nature 458, 211–214. [DOI] [PMC free article] [PubMed] [Google Scholar]
Associated Data
This section collects any data citations, data availability statements, or supplementary materials included in this article.
Supplementary Materials
Figure S1. Related to Figure 1. High affinity non-agonists respond to non-specific stimuli. (A) Proliferation of TCR6 (top) and TCR11 (bottom) stimulated with CD3/CD28 beads (red) or non-specific HA peptide (Gray). (B) Tetramer staining of HCV-NS3(L5M) responsive clone (top) and non-responsive clone (bottom) with HLA-A2(L5M) (turquoise) and HLA A2-PPI (preproinsulin; gray). (C) CD107a immobilization of a responsive clone (top) and unresponsive clone (bottom) when stimulated with L5M (turquoise) or PPI peptide (Gray). (D) Tetramer staining (top panels) and CD107a (bottom panels) immobilization of L5N specific clones. Non-responsive clones are highlighted in yellow. (E) IL-2 release from anti-CD3 stimulation of transduced TCR clones 55 and 589 in 58−/− hybridoma cells ; Representative data (n=3) shown as mean ±SD (n=3).
Figure S5. Related to Figure 5. Relationship between ligand potency and affinity. (A) Validation of MHC UV exchange by tetramer staining of TCR55 (right) and TCR589 (left) expressing cell lines. Cells were stained with 100 nM tetramers not treated with UV (gray), B35-exchanged with non-specific peptide IPLTEKAEL (magenta), or exchanged B35-HIV(Pol). (B) Table of EC50 and KD values as determined by CD69 upregulation and SPR, respectively. (C) CD69 Emax vs SPR 3D KD; data shown as mean ± SEM (n=3). Lower two panels represent high affinity (salmon) and moderate/low affinity ligands (teal) correlation of SPR KD and Emax of CD69. (D) Equilibrium curves of TCR55 binding to pMHCs of interest at 250C. Data shown was measured at equilibrium (red dots). Black line shows the fit to a 1:1 binding curve. (E) Force directed clustering map depiction of unique peptides selected in post-round 3 highlighting: relatedness, as calculated by Hamming distance (left); read count, depicted as relative nodesize (middle); node size and color organized by signaling potency (right). (D-F) were generated in Cytoscape. See also Mendeley Data.
Figure S6. Related to Figure 6. Structural and functional interrogation of library derived peptides. (A) TIRF microscopy of B35-Pep20 binding to SKW3 T cells expressing TCR55. pMHC-binding slows down TCR diffusion. (B) Dwell time fit of B35-Pep20 bound to TCR55. (C) Max projection and quantification of Zap70 recruitment to TCR55 in response to B35-Pep20, TCR55-B35-HIV(Pol448–456) or TCR589-B35-HIV(Pol448–456) (data shown in Figure 3); data shown as mean ± SD of two replicate experiments, n = 200 cells in total of which 185 cells were activated. (D) Dose response of pERK by flow cytometry (E) Representative HIV(Pol448–456) antagonist assay where TCR55 T cells were stimulated with 1 uM of Pep20 and varying concentrations of HIV(Pol448–456) (n=3); Representative data shown as mean ± SD (n=3). (F) Super-imposition of Pep20 and HIV(Pol448–456) interactions with TCR55 CDR loops; and detailed interactions with TCR55-B35(Pep20) (bottom). (G) (top) B35-Pep20 P6-Asp (marine) interactions with B35 C-pocket (orange) and (bottom) P6E of HIV(Pol448–456) peptide (teal) binding to B35 C-pocket (orange). (H) 2D affinity of TCR589 to HIV(Pol448–456) (purple), TCR55 to B35-HIV(Pol448–456l) (aqua), TCR55 to B35-Pep20 (pink), TCR55 to B35-SQL (orange); error bars indicate ± SEM of dozens of measurements. (I) Schematic of GUV assay. (J) TCR-Triggering model. See also tables S1,S2, and Mendeley Data.
Figure S7. Related to Figure 7. Dissociation trajectories and molecular mechanism of catch bonds. (A) Bond distances vs. shearing distance starting from SQLmut in the +x direction. (B) Snapshots of the molecular catch bonds in the SQL system at shearing distances where old interactions have just broken or new interactions have just formed. (C) Snapshot of N-terminal lifting of Pep20 during dissociation, dashed lines represent molecular interaction. (D) Steric effect of conservative mutations in P1 that allow for N-terminal lifting. Pep20 is shown in marine blue, HIV in teal. (E) Comparison of the distance between P6-Asp or P6-Glu and B35-Arg97 for Pep20 and HIV, respectively, that allows catch bond #3 to be formed for Pep20 but not HIV. (F) Bond distances vs. shearing distance of alternative and additional catch or slip bonds formed in −y or −x directions. Catch bonds are outlined in a black box. (G) Summary of catch bond formation in the ± z direction. See also Mendeley Data and Movies S3–S5.
Movie S1. Related to Figure 2. Representative 2D dwell time movies Time-lapse TIRF imaging of single B35-HIV molecules (top panels) or null pMHCs (bottom panels) on functionalized SUVs binding T cells expressing either TCR55 (left panels) or TCR589 (right panels). Images were acquired every 1 seconds with an exposure of 500 ms. Scale bars represent 2 m. Movie is played at 21 fps for 300 frames for top panels, and for 100 frames looped 3 times for bottom panels.
Movie S2. Related to Figure 3. Representative Zap70 clustering movies TIRF Imaging of Zap70-GFP (cyan) movement in TCR589 (left) and TCR55 (right) expressing cells on a supported lipid bilayer functionalized with 1 pMHC molecule/ μM2 and ICAM. To generate this movie, images were recorded with an acquisition interval of 2 seconds with an exposure time of 50 ms for a total of 4 min and 12 seconds, total time was 10 minutes. Scale bars represent 5 m. The movie is played at 30 fps for 126 frames.
Movie S3. Related to Figure 7. Molecular dynamics simulation of TCR55 binding to B35-Pep20 under force The shearing of TCR55 (top, gray) along the N-term to C-term antigen axis (central, gray) with respect to MHC (bottom, gray) leads to four molecular catch bonds for the active antigen Pep20. In each catch bond, colored respectively in red, blue, green and purple, one of the residues in the starting bond colored in the lighter hue breaks its interaction, and forms a new interaction with a new bonding partner colored in the darker hue. The yellow dashed lines connect the bonds that are being formed in their equilibrium distances. The N-term of the Pep20 antigen peptide was lifted up by the purple catch bond between TCR and Pep20, providing a lasting resistance against the relative shearing of the TCR.
Movie S4. Related to Figure 7. Molecular dynamics simulation of TCR55 binding to B35-HIV(Pol) under force The shearing of TCR55 (top, gray) along the N-term to C-term antigen axis (central, gray) with respect to MHC (bottom, gray) and inactive antigen HIV leads to four molecular slip bonds, colored respectively in red, blue, green and purple, where the breaking of the old interactions in the lighter hues are not followed by the formation of the new interactions with the potential catching residues in the darker hues. TCR CDR loops may be out of focus in certain frames for focusing the slip bonds.
Movie S5. Related to Figure 7. Molecular dynamics simulation of TCR55 binding to B35-SQL under force The shearing of TCR55 (top, gray) along the N-term to C-term antigen axis (central, gray) with respect to MHC (bottom, gray) bound to the active SQL antigen leads to three molecular catch bonds, colored respectively in red, blue and green. The purple catch bond is briefly formed. TCR CDR loops may be out of focus in certain frames for focusing the catch bonds.
Figure S2. Related to Figure 1, 2, 3, 6. High affinity non-agonist TCR-pMHC interactions exist for class II restricted TCRs and form slip bonds (A) IL-2 secretion of 58−/− cells transduced with either TCR6 (black) and TCR11 (cyan) in response to DR4-HIV(Gag) (left) and 0.5 g of OKT3 (right); representative data (n=3) shown as mean ± SD (n=3). (B) SPR equilibrium analysis for TCR6 (black) and TCR11 (cyan) bound to DR4-HIV(Gag). (C) Kinetic SPR traces for TCR6 and TCR11. (D) Single-cell Fluo-4 fluorescent traces of Jurkat β−/− transduced with TCR6 (black) or TCR 11 (cyan) and stimulated with OKT3 (top) or DR4-HIV(Gag) (bottom). Representative data shown as mean ± SEM (n=3). (E) Bond lifetime vs force curves for TCR6 (black) or TCR11 (cyan) binding to DR4-HIV(Gag).
Figure S3. Related to Figure 3. Structural comparison of TCR55 and TCR589 bound to HLA B35-HIV(Pol448–456). (A) TCR55 and TCR589 TCR sequences and V gene usages. (B) Schematic of point mutation 195c to enable single molecule imaging. (C) Structural details of TCR55 and 589 bound to HIV. Top inset shows 8 Å shift measured from FG-loops. The CDR1/2α loops do not make contact with α2 helix, and instead make contact with the α1 helix of B35. The CDR1 loop, which harbors sequential tryptophans (WW-motif), pinches HLA B35-Arg62 to form a pi-stacking interaction with Trp29 that significantly contributes to the TCR-MHC interaction. In contrast, the majority of the contact made with the α2 helix of HLA B35 is via the long CDR3b loop (Table S2). (D) Representative pERK1/2 of TCR589 (aqua) and TCR55 (orange) when stimulated with 0.5 ng of OKT3. (E) Representative dose response of pERK with stimulation of HIV(Pol448–456) on cells expressing TCR589 (left) or TCR55 (right) (n=3). (F) Representative single cell Fluo-4 fluorescence traces for for TCR55 or TCR589 when stimulated with OKT3 (Top) or B35-HIV(Pol448–456) (bottom). See also Movie S1 and Table S1–3.
Figure S4. Related to Figure 4. Development of HLA B35 yeast display platform. (A) cMyc-tag enrichment for 3 rounds of selection of the B35*01 error-prone library. B) Post-round 4 tetramer staining of B35-library with 400nM TCR55 (orange) or TCR589 (aqua). (C) Consensus mutations found after TCR selection of the B35*01 error-prone library. (D) 116F mutation (magenta) required for B35 display. (E) Heatmap depicting relatedness based on the hamming distance of unique peptide sequences found in post-round 3 of the selection (n=131). Peptides shown along the x and y axis are sorted by selection frequency. (F) Top 20 most frequent peptides; read counts for each round of selection as determined from the deep sequencing analysis is shown.