

Abstract
Objective
To investigate the associations between manganese (Mn) exposure, D2 dopamine receptors (D2Rs), and parkinsonism using [11C](N-methyl)benperidol (NMB) PET.
Methods
We used NMB PET to evaluate 50 workers with a range of Mn exposure: 22 Mn-exposed welders, 15 Mn-exposed workers, and 13 nonexposed workers. Cumulative Mn exposure was estimated from work histories, and movement disorder specialists examined all workers. We calculated NMB D2R nondisplaceable binding potential (BPND) for the striatum, globus pallidus, thalamus, and substantia nigra (SN). Multivariate analysis of covariance with post hoc descriptive discriminate analysis identified regional differences by exposure group. We used linear regression to examine the association among Mn exposure, Unified Parkinson’s Disease Rating Scale motor subsection 3 (UPDRS3) score, and regional D2R BPND.
Results
D2R BPND in the SN had the greatest discriminant power among exposure groups (p < 0.01). Age-adjusted SN D2R BPND was 0.073 (95% confidence interval [CI] 0.022–0.124) greater in Mn-exposed welders and 0.068 (95% CI 0.013–0.124) greater in Mn-exposed workers compared to nonexposed workers. After adjustment for age, SN D2R BPND was 0.0021 (95% CI 0.0005–0.0042) higher for each year of Mn exposure. Each 0.10 increase in SN D2R BPND was associated with a 2.65 (95% CI 0.56–4.75) increase in UPDRS3 score.
Conclusions and relevance
Nigral D2R BPND increased with Mn exposure and clinical parkinsonism, indicating dose-dependent dopaminergic dysfunction of the SN in Mn neurotoxicity.
In excess, manganese (Mn) is a neurotoxicant that targets basal ganglia,1 but understanding of the pathogenic mechanisms in humans remains limited. Alterations of striatal and extrastriatal D2 dopamine receptor (D2R) concentrations have been implicated in the pathophysiology of movement disorders, including parkinsonism2 and dystonia,3,4 both of which can be seen in Mn neurotoxicity. D2Rs are expressed presynaptically on dopaminergic neurons and postsynaptically on dopaminergic neuronal pathways throughout the brain.5–7 The functional roles of D2Rs are complex with their diffuse distribution and dual presynaptic and postsynaptic expression.6,8,9
PET permits in vivo assessment of dopamine receptors, although previous studies with D2R PET ligands in human and nonhuman primate models of Mn toxicity used nonspecific PET radioligands for the D2R family with similar affinity for D2R and D3 receptor subtypes.3,10,11 Competition from endogenous dopamine may alter brain uptake and retention of these radioligands12–14 and may have contributed to inconsistent results across studies.15–19
The PET radioligand [11C](N-methyl)benperidol (NMB) is an analog of the dopamine receptor antagonist benperidol and has both high affinity and selectivity for D2R but is not displaced by endogenous dopamine.3,20 In the present study, we evaluated the relationship between occupational Mn exposure, D2R density, and parkinsonism using NMB PET imaging in Mn-exposed workers and nonexposed workers, clinically characterized by a movement disorder specialist. We hypothesized that Mn exposure would be associated with dose-dependent differences in D2R density indicating dopaminergic dysfunction.
Methods
Standard protocol approvals, registrations, and patient consents
This study was approved by the Washington University Human Research Protection Office and the Radioactive Drug Research Committee, and all participants provided written informed consent.
Participants
All participants (n = 50) were workers from the US Midwest and were recruited from May 2013 to September 2016. To obtain a range of Mn exposures, we recruited from 2 sources. Some (n = 32) were International Brotherhood of Boilermakers union members who participated in a previous cohort study21 of Mn-exposed workers. The remainder (n = 18) were workers engaged in construction who were recruited from a carpentry union. The study was designed to have 90% power to detect a 10% difference in NMB binding between groups. In total, 22 workers conducted welding (welders or welder helpers, hereafter called Mn-exposed welders), 15 workers who worked around welding fume (hereafter called Mn-exposed workers), and 13 workers who were not occupationally exposed to Mn. Inclusion criteria were no history of stroke, brain tumor, or other condition that could compromise the Unified Parkinson's Disease Rating Scale motor subsection 3 (UPDRS3) score22; no antiparkinsonian medications, neuroleptics, or amphetamines; and age ≥18 years, as detailed previously.21 We excluded 2 workers due to medical conditions on the basis of these criteria. Covariate data were available for all workers.
Clinical assessment
A movement disorders specialist blinded to Mn exposure examined all workers and rated them using the UPDRS3. The 2 examiners in this study each rated 10 videos of patients with Parkinson disease (PD) each year, and the intraclass correlation coefficient for UPDRS3 ratings was >90%. However, to account for potential differences by examiner overall and by study time, we adjusted UPDRS3 scores as previously described.21
MRI acquisition
We acquired high resolution 3-dimensional (3D) magnetization-prepared rapid gradient echo (MPRAGE) images on each worker using a Siemens 3T Magnetom Trio or Prisma scanner (Erlangen, Germany) (repetition time = 2,400 milliseconds, inversion time = 1,000 milliseconds, echo time = 3.14 milliseconds, flip angle = 8°, 0.9 × 0.9 × 0.9-mm voxels). Cumulative Mn exposure is associated with increased globus pallidus (GP) T1 signal, and the signal intensity is traditionally measured in terms of a pallidal index (PI), defined as the ratio of T1 signal in the GP to a white matter reference region.23,24 PIs were calculated from the MPRAGE images as previously described23: PI = ([left GP + right GP]/[left control region + right control region]) × 100.
PET acquisition
NMB was synthesized as previously described.25 A single Siemens/CTI EXACT+ scanner, which has 32 rings of bismuth germanate detector elements and acquires 63 simultaneous slices with 2.4-mm spacing and an axial field of view of 15.5 cm, was used to acquire scans in 3D mode. Three retractable germanium 68 (68Ge) rod sources were used for transmission scans to measure individual attenuation factors. Transaxial and axial spatial resolution at slice center are 4.3- and 4.1-mm full width half-maximum in 3D mode.26 NMB (5–25.67 mCi) was injected IV into an arm vein over 20 seconds. Dynamic PET images were obtained for 120 minutes beginning with radioligand injection, with three 1-minute frames followed by four 2-minute frames, three 3-minute frames, and 20 five-minute frames. PET scans were reconstructed with filtered back-projection with ramp filter cutoff at the Nyquist frequency and included attenuation, scatter, and random correction.
Image analysis
For each worker, we coregistered dynamically acquired PET image frames to each other and to the individual's MPRAGE image using methods previously outlined.7 A priori MRI-defined volumes of interest (VOIs) included caudate, anterior and posterior putamen (AP and PP), GP, thalamus, substantia nigra (SN), a standard white matter reference region for the MRI PI, and a cerebellar reference region for the NMB PET. We used FreeSurfer27 for segmentation of the subcortical deep nuclei and cerebellum on individual MRIs. Caudate, AP, PP, GP, thalamus, and cerebellum were identified with FreeSurfer, and a single investigator manually edited these volumes. The cerebellar volume included all gray and white matter from both hemispheres. The putamen VOIs were manually separated at the posterior fornix on individual MPRAGEs as defined previously.23 The SN and white matter reference regions were manually traced following previously published methods.23,28 All VOIs were reviewed by an independent second investigator. We eroded VOIs to minimize partial volume effects on the regional PET measurements of radioactivity. For the caudate, AP, PP, GP, and thalamus, we combined a gaussian smoothing filter at a 3-mm full width half-maximum with thresholding set to 0.75 to erode the surface of the original region. The SN VOI was not large enough to erode.
For each worker, the FreeSurfer-defined VOIs and reference region were resampled in Talairach atlas space29 to 3 mm, and decay-corrected tissue activity curves were extracted from the dynamic PET data.30 D2R nondisplaceable binding potential (BPND) was calculated for each VOI with the Logan graphical method31 with cerebellum as the reference region. Slopes were obtained from Logan plot points for data acquired 60 to 120 minutes after NMB injection. Left and right BPNDs were averaged for all VOIs. We checked for potential variations in PET scanning over time and found no evidence of association between D2R BPND and scan date.
Exposure assessment
All workers completed or updated a validated, structured questionnaire in person at the time of imaging, which included a detailed work history.32 From this, we created categorical Mn exposure groups based on intensity of welding fume exposure as described above. We also calculated 2 cumulative Mn exposure variables, the total years of welding fume exposure and mg Mn/m3-years.21 The latter variable takes into account both duration (years) and intensity (mg Mn/m3) of exposure. All exposure variables were available for all participants.
Statistical analysis
We used R version 3.3.1 with the DiscriMiner package33 for all statistical analyses. We verified that the VOI D2R BPNDs were multivariate normally distributed and performed multivariate analysis of covariance34 as an omnibus test to determine whether differences existed among the exposure groups, covarying with age and using the Pillai trace as the test statistic. We used post hoc descriptive discriminate analysis34 to determine which VOIs drove any group differences and corrected this analysis for 6 multiple comparisons using the Benjamini-Hochberg procedure35 with the false discovery rate set at 0.10. Finally, for VOIs with the greatest discriminate power, we used multivariable linear regression to examine associations within each VOI between D2R BPND and exposure and D2R BPND and examiner-adjusted UPDRS3 score as continuous measures. We verified linearity by residual analysis and locally weighted scatterplot smoothing.36 When locally weighted scatterplot smoothing suggested a possible alternative model, we compared it to the linear model using Akaike information criterion (AIC).37 We examined influential points defined by a Cook distance >4/(number of participants − number of predictors − 1) as a measure of the leverage of a data point on the model.38 In addition to the full models, we performed models with influential points excluded, in case these points distorted the association because of sample size. Parameter significance tests were 2 sided in all models.
We adjusted for age, centered at 43 years (median age among nonexposed), in all models unless noted because age may influence D2R BPND.25 We compared exposure groups to the nonexposed workers on key demographics using pairwise t tests. We repeated all analyses restricted to men and examined the effects of volume size on D2R BPND. There was no association between volume and D2R BPND for the SN, AP, or thalamus; however, there were significant linear associations between volume and D2R BPND for the caudate, GP, and PP, so we performed a sensitivity analysis adjusting for volume in these VOIs. We explored the associations in clinically normal workers (UPDRS3 score ≤6) because inclusion of Mn-exposed workers with nonnormal UPDRS3 scores might enhance the association between D2R BPND and exposure. For this sensitivity analysis, we compared nonexposed workers with the Mn-exposed participants as a single group (n = 12). There were 2 participants with a first-degree family history of PD. We repeated all analyses excluding these 2 workers.
Data availability
Data from research participants in this study, who authorized sharing of their research data, will be made available to investigators with appropriate expertise and research support after publication of the primary aims of this study. All shared data will be deidentified and will be released in accordance with US regulations.
Results
Subject characteristics
Most workers were non-Hispanic white men (table 1). The exposure groups were similar in terms of sex and age. Both Mn-exposed workers and welders had relatively wide ranges of Mn exposure. The age-adjusted PI was higher in Mn-exposed workers (5.2 points, p = 0.10) and Mn-exposed welders (6.0 points, p = 0.04) than nonexposed workers. Similarly, UPDRS3 scores were higher in both Mn-exposed workers (mean 6.9, p ≤ 0.01) and welders (mean 11.3, p ≤ 0.01) compared to the nonexposed workers (mean 2.1). The most common parkinsonian features in the Mn-exposed participants were limb bradykinesia, axial signs, and limb rigidity. Action tremor was markedly more prevalent than rest tremor (table 1). No workers had a diagnosis of PD or received any treatment for parkinsonism, including chelation. As previously reported, these workers had ≈12% lower 6-[18F]fluoro-l-dopa uptake in the caudate nucleus.23,39
Table 1.
Characteristics of participating workers by welding fume exposure

Mn exposure intensity and NMB PET
Multivariate analysis of covariance demonstrated differences in D2R BPNDs among the 3 exposure groups while covarying for age (Pillai trace = 0.45, p = 0.04). Post hoc descriptive discriminate analysis revealed that the SN (p < 0.01) and caudate (p = 0.09) had the greatest discriminant power. The SN remained significant after correction for multiple comparisons. Linear regression demonstrated that SN D2R BPND was higher in both Mn-exposed workers and Mn-exposed welders compared to nonexposed workers (all p ≤ 0.05, table 2 and figure 1). When restricted to workers who had UPDRS3 scores ≤6, SN D2R BPND uptake remained similarly higher (0.07, 95% confidence interval [CI] 0.01–0.13) in Mn-exposed (n = 12) compared to nonexposed workers (n = 13) (p = 0.02) (data not shown in tables). We also re-examined the difference between exposure groups while adjusting for caudate, GP, and PP volume and found no substantial changes. Similarly, results did not change with the analysis limited to men or excluding the 2 workers with a family history of PD in a first-degree relative.
Table 2.
Mean D2R receptor NMB BPND by brain volume and Mn exposure group (n = 50)

Figure 1. Unadjusted composite [11C](N-methyl)benperidol D2 receptor BPND by exposure group.
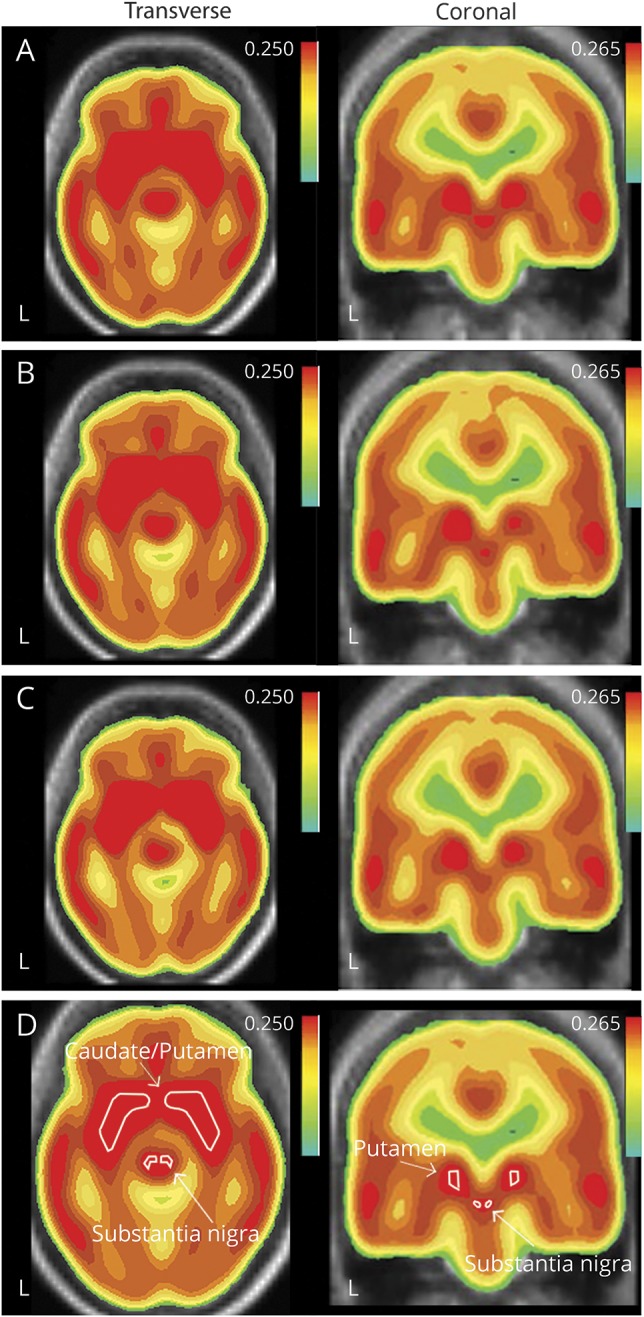
(A) Mn-exposed welders, (B) Mn-exposed workers, (C) nonexposed reference workers in the striatum and midbrain overlaid on MRI in the transverse and coronal views, and (D) reference labels for the striatum and substantia nigra are provided for the composite image. However, volumes of interest for sampling are identified on individual MRI images as described in Methods. BPND = nondisplaceable binding potential.
Cumulative Mn exposure and NMB PET
SN D2R BPND increased with all cumulative Mn exposure measures, with and without influential points (all p ≤ 0.09, table 3). The association between duration in an Mn-exposed job and SN D2R BPND was clearly linear (figure 2A). For mg Mn/m3-years, which accounts for intensity and duration, it was unclear whether a linear model (AIC = −111.37, table 3) or a spline model (AIC = −112.86, table 3 and figure 2B) was superior. In the latter, the increase in SN D2R BPND was particularly marked in the lower range of exposure during the initial 0.8 mg Mn/m3-year.
Table 3.
Mn exposure and substantia nigra D2R BPND adjusted for age

Figure 2. Associations between Mn exposure, NMB SN D2R BPND, and examiner-adjusted UPDRS3 (n = 50).
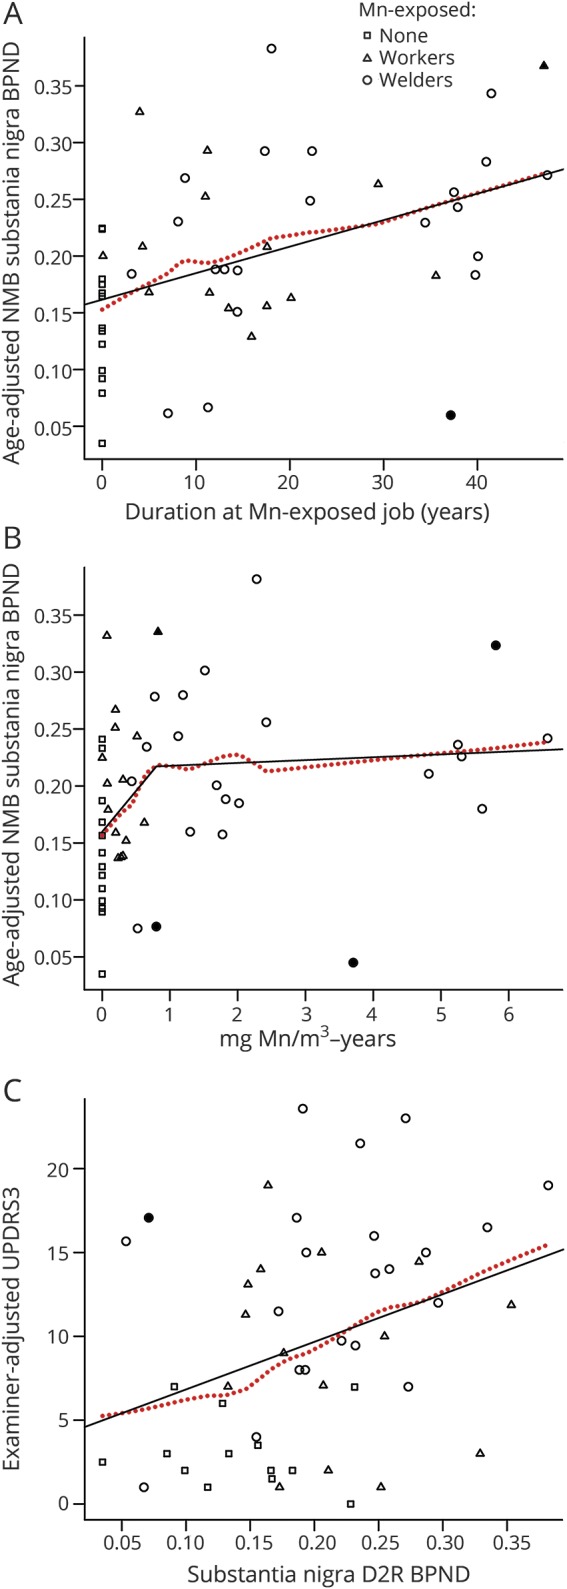
(A) Linear relationship between age-adjusted [11C](N-methyl)benperidol (NMB) substantia nigra (SN) D2 dopamine receptor (D2R) nondisplaceable binding potential (BPND) and duration at an Mn-exposed job and (B) association with mg Mn/m3-years modeled with 2 linear splines with a knot at 0.8 mg Mn/m3-years. (C) There is also a linear relationship between NMB SN D2R BPND and examiner-adjusted Unified Parkinson’s Disease Rating Scale motor subsection 3 (UPRDS3) score. Dotted line is the locally weighted scatterplot smoothing estimate; age-adjusted influential points based on the Cook distance are darkened.
NMB PET and UPDRS3
There was a linear association between SN D2R BPND and examiner-adjusted UPDRS3 score (2.84 increase in UPDRS3 score per 0.1 increase in nigral D2R BPND, 95% CI 0.55–5.14, p = 0.02) (figure 2C). This relationship persisted after adjustment for age (2.13 increase in UPDRS3 score per 0.1 increase in SN D2R BPND, 95% CI −0.03 to 4.29, p = 0.05) and was driven largely by the limb rigidity component of the UPDRS3 (1.21 increase in the limb rigidity subscore per 0.1 increase in nigral D2R BPND, 95% CI 0.39–2.02, p ≤ 0.01). The exclusion of 1 influential point (young participant with a UPDRS3 score of >15) strengthened this relationship (2.65 increase per 0.1 increase in nigral D2R BPND, 95% CI 0.56–4.75, p = 0.01).
Discussion
In this large molecular imaging study of basal ganglia D2 receptors, we provide strong evidence that Mn-exposed welders and workers have higher SN D2R BPND than nonexposed workers using the D2R-specific tracer NMB. We also provide compelling evidence of a dose-response increase in SN D2R BPND with both cumulative Mn exposure and clinical parkinsonism. In contrast to previous smaller PET D2R studies in Mn-exposed human15,16 and nonhuman primate models of Mn neurotoxicity,17–19 we found similar to higher D2R density in the basal ganglia of Mn-exposed workers and welders relative to nonexposed workers. However, direct comparisons to these older studies are difficult because they included participants with advanced parkinsonism, used nonspecific D2/D3R tracers, and did not examine extrastriatal uptake.
This clear linear relationship between increasing SN D2R density and greater severity of parkinsonism as measured by the UPDRS3 strongly suggests that the SN is a target of Mn neurotoxicity. This association was largely driven by limb rigidity. This particular clinical sign was also a primary contributor to progression of parkinsonism related to welding fume exposure in our larger cohort.21 Taken together, these findings strongly suggest that limb rigidity may be a core clinical feature of Mn neurotoxicity. The specific relationship between SN D2R density and clinical parkinsonism has not been fully described. However, nonhuman primate studies demonstrate a strong correlation between increasing nigral dopaminergic cell loss and greater motor parkinsonism, whereas striatal changes in presynaptic dopaminergic neurons did not fully correlate with motor parkinsonism.40,41 In patients with PD, striatal D2R density may be higher than, lower than, or the same as in control participants, secondary to differences in disease severity and medication use.42 Increases in striatal D2R binding may represent compensatory upregulation of striatal D2Rs in early stages of PD, referred to as D2R denervation supersensitivity.42 However, with progressive degeneration of nigrostriatal pathways, striatal D2R binding decreases to normal or reduced levels compared to healthy controls.43,44 Presynaptic D2R in the SN is located in the perikarya and dendrites of the pars compacta,6 which autoregulate dopamine release.45–47 Higher D2R NMB binding in the SN of Mn-exposed workers and welders could, therefore, represent a similar compensatory upregulation or may represent a direct effect of Mn exposure on SN D2Rs. Further exploration of these hypotheses will be an important area in future studies on the pathophysiology of Mn neurotoxicity.
We also demonstrated a dose-dependent increase in SN D2R BPND with all cumulative Mn exposure metrics. This included evidence for a linear association between both duration in an Mn-exposed jobs and Mn/m3-years and SN D2R BPND. Compared to the linear model, the Mn/m3-years spline model suggested an alternative interpretation that much of the change in SN D2R BPND occurs between 0 and 0.8 mg Mn/m3-year and increases only modestly thereafter. This suggests that there may be a critical Mn exposure window in the first 6 years of exposure. This is consistent with our recent longitudinal clinical cohort study in which we identified a particularly strong association between increasing welding fume exposure and progression of clinical parkinsonism in the first 5 years of exposure,21 although longitudinal imaging will be needed to determine whether Mn induces neurodegeneration of the dopaminergic system. Estimated mean time-weighted Mn exposure in the present subset of the cohort was 0.11 to 0.14 mg Mn/m3 for Mn-exposed welders and 0.018 to 0.035 mg Mn/m3 for Mn-exposed workers and is representative of the overall cohort.21 These estimates are substantially lower than the US Occupational Safety and Health Administration Permissible Exposure Limit for Mn of 5 mg Mn/m3.48 In contrast, the American Conference of Governmental Industrial Hygienists time-weighted average threshold limit value for inspirable Mn is 0.1 mg Mn/m3.49 Given that we observe a linear relation between Mn exposure and SN D2R BPND in workers with estimated Mn exposures below these recommended exposure limits, our study provides additional support for reducing the Occupational Safety and Health Administration Permissible Exposure Limit to the American Conference of Governmental Industrial Hygienists threshold limit value or lower.
This study has several potential limitations. Welding fume contains a number of elements and gases50; therefore, this study cannot fully exclude a contribution from other substances in welding fume, including iron, which competes for the same metal transporter responsible for Mn uptake into the brain.51 NMB PET is limited to the examination of D2R; therefore, we cannot exclude pathologic effects in other brain neurotransmitters. Similarly, while current evidence suggests that nigral D2Rs are located primarily in the SN pars compacta6 and that the SN pars reticulata is primarily populated by D1 receptors,45 the presence of D2R within the pars reticulata or other nigral afferents cannot be excluded. Confirmation is required to understand the extent to which our findings in Mn-exposed workers translate to patients with PD. We also note that because all the workers were essentially of working age (not elderly) and we excluded workers taking dopaminergic medications (effectively excluding those diagnosed with PD), the only workers with a UPDRS3 score >6 were in the Mn-exposed groups. However, the consistency of our results in the sensitivity analysis, focusing only on workers with a UPDRS3 score ≤6, would argue against these criteria causing the difference in DR2 BPND between the exposure groups. Finally, while we cannot fully exclude coexistent early PD, none of the workers was diagnosed with PD by the examining neurologist either at the time of imaging or during their participation in the larger cohort study (mean follow-up for Mn-exposed workers 4.3 years, for Mn-exposed welders 7.6 years), although the average age of these workers was substantially younger than the average age at PD onset. Once again, longitudinal evaluation is required to clarify whether the clinical and imaging phenotype we observed becomes consistent with PD.
Mn-exposed welders and workers demonstrated higher D2R-specific binding in the SN compared to nonexposed workers, suggesting nigral D2R upregulation. Furthermore, there was a dose-response linear increase in SN D2R BPND with greater Mn exposure, with much of the change occurring early in the course of welding exposure, suggesting that a critical exposure and intervention window may exist in the first 6 years of exposure. Finally, clinical parkinsonism increased linearly with greater SN D2R BPND, demonstrating nigral involvement in Mn-induced parkinsonism.
Glossary
- AIC
Akaike information criterion
- AP
anterior putamen
- BPND
nondisplaceable binding potential
- CI
confidence interval
- D2R
D2 dopamine receptor
- GP
globus pallidus
- MPRAGE
magnetization-prepared rapid gradient echo
- NMB
[11C](N-methyl)benperidol
- PD
Parkinson disease
- PI
pallidal index
- PP
posterior putamen
- SN
substantia nigra
- 3D
3-dimensional
- UPDRS3
Unified Parkinson's Disease Rating Scale motor subsection 3
- VOI
volume of interest
Author contributions
All authors had full access to all the data in the study and take responsibility for the integrity of the data and the accuracy of the data analysis. Study concept and design: Racette, Perlmutter, Criswell, Checkoway. Acquisition, analysis, or interpretation of data: all authors. Statistical analysis: Criswell, Warden, Nielsen, Sheppard. Drafting of the manuscript: Criswell, Warden, Nielsen, Lenox, Racette. Critical revision of the manuscript for important intellectual content: all authors. Obtained funding: Criswell, Racette. Administrative, technical, or material support: Moerlein, Lenox, Perlmutter. Supervision: Racette, Perlmutter.
Study funding
Funding for this project was provided by the following NIH grants: R01ES021488, K23ES021444, K24ES017765, R01ES013743, R01ES021488-02S1, P42ES004696, and ICTS UL1RR024992, as well as the American Parkinson Disease Association (APDA), and the Greater St. Louis Chapter of the APDA.
Disclosure
S. Criswell reports grant funding from the NIH, including K23ES021444 and R01ES013743. M. Warden reports no disclosures relevant to the manuscript. S. Searles Nielsen reports grant funding from the NIH, including K24ES017765 and R01ES021488, and grants from the Michael J. Fox Foundation and American Parkinson Disease Association. J. Perlmutter reports grant funding from the NIH, including R01ES021488 and R01ES013743. S. Moerlein reports grant funding from the NIH, including R01ES021488. L. Sheppard reports grant funding from NIH, including R01ES026187 and R01ES021488. J. Lenox-Krug reports no disclosures relevant to the manuscript. H. Checkoway reports grant funding from the NIH, including R01ES021488, R21ES026084, R01ES025991, and R01ES025792. B. Racette reports grant funding from NIH, including K24ES017765, R01ES021488, R01ES013743, P42ES004696, and UL1RR024992, as well as grant funding from APDA and the Michael J. Fox Foundation. Go to Neurology.org/N for full disclosures.
References
- 1.Parmalee NL, Aschner M. Manganese and aging. Neurotoxicology 2016;56:262–268. [DOI] [PubMed] [Google Scholar]
- 2.Kaasinen V, Nagren K, Hietala J, et al. Extrastriatal dopamine D2 and D3 receptors in early and advanced Parkinson's disease. Neurology 2000;54:1482–1487. [DOI] [PubMed] [Google Scholar]
- 3.Karimi M, Moerlein SM, Videen TO, et al. Decreased striatal dopamine receptor binding in primary focal dystonia: a D2 or D3 defect? Mov Disord 2011;26:100–106. [DOI] [PMC free article] [PubMed] [Google Scholar]
- 4.Perlmutter JS, Stambuk MK, Markham J, et al. Decreased [18F]spiperone binding in putamen in idiopathic focal dystonia. J Neurosci 1997;17:843–850. [DOI] [PMC free article] [PubMed] [Google Scholar]
- 5.Rankin J, Hazelwood LA, Free RB, Roof RA, Sibley DR. Molecular Pharmacology of the Dopamine Receptors: Dopamine Handbook. New York: Oxford Scholarship Online; 2010. [Google Scholar]
- 6.Missale C, Nash SR, Robinson SW, Jaber M, Caron MG. Dopamine receptors: from structure to function. Physiol Rev 1998;78:189–225. [DOI] [PubMed] [Google Scholar]
- 7.Eisenstein SA, Koller JM, Piccirillo M, et al. Characterization of extrastriatal D2 in vivo specific binding of [(18) F](N-methyl)benperidol using PET. Synapse 2012;66:770–780. [DOI] [PMC free article] [PubMed] [Google Scholar]
- 8.Beaulieu JM, Gainetdinov RR. The physiology, signaling, and pharmacology of dopamine receptors. Pharmacol Rev 2011;63:182–217. [DOI] [PubMed] [Google Scholar]
- 9.Sibley DR. New insights into dopaminergic receptor function using antisense and genetically altered animals. Annu Rev Pharmacol Toxicol 1999;39:313–341. [DOI] [PubMed] [Google Scholar]
- 10.Elsinga PH, Hatano K, Ishiwata K. PET tracers for imaging of the dopaminergic system. Curr Med Chem 2006;13:2139–2153. [DOI] [PubMed] [Google Scholar]
- 11.Halldin C, Farde L, Hogberg T, et al. Carbon-11-FLB 457: a radioligand for extrastriatal D2 dopamine receptors. J Nucl Med 1995;36:1275–1281. [PubMed] [Google Scholar]
- 12.Chou YH, Halldin C, Farde L. Effect of amphetamine on extrastriatal D2 dopamine receptor binding in the primate brain: a PET study. Synapse 2000;38:138–143. [DOI] [PubMed] [Google Scholar]
- 13.Seeman P, Guan HC, Niznik HB. Endogenous dopamine lowers the dopamine D2 receptor density as measured by [3H]raclopride: implications for positron emission tomography of the human brain. Synapse 1989;3:96–97. [DOI] [PubMed] [Google Scholar]
- 14.Cropley VL, Innis RB, Nathan PJ, et al. Small effect of dopamine release and no effect of dopamine depletion on [18F]fallypride binding in healthy humans. Synapse 2008;62:399–408. [DOI] [PubMed] [Google Scholar]
- 15.Shinotoh H, Snow BJ, Chu NS, et al. Presynaptic and postsynaptic striatal dopaminergic function in patients with manganese intoxication: a positron emission tomography study. Neurology 1997;48:1053–1056. [DOI] [PubMed] [Google Scholar]
- 16.Kessler KR, Wunderlich G, Hefter H, Seitz RJ. Secondary progressive chronic manganism associated with markedly decreased striatal D2 receptor density. Mov Disord 2003;18:217–218. [DOI] [PubMed] [Google Scholar]
- 17.Shinotoh H, Snow BJ, Hewitt KA, et al. MRI and PET studies of manganese-intoxicated monkeys. Neurology 1995;45:1199–1204. [DOI] [PubMed] [Google Scholar]
- 18.Eriksson H, Tedroff J, Thuomas KA, et al. Manganese induced brain lesions in Macaca fascicularis as revealed by positron emission tomography and magnetic resonance imaging. Arch Toxicol 1992;66:403–407. [DOI] [PubMed] [Google Scholar]
- 19.Guilarte TR, Chen MK, McGlothan JL, et al. Nigrostriatal dopamine system dysfunction and subtle motor deficits in manganese-exposed non-human primates. Exp Neurol 2006;202:381–390. [DOI] [PubMed] [Google Scholar]
- 20.Moerlein SM, Perlmutter JS, Markham J, Welch MJ. In vivo kinetics of [18F](N-methyl)benperidol: a novel PET tracer for assessment of dopaminergic D2-like receptor binding. J Cereb Blood Flow Metab 1997;17:833–845. [DOI] [PubMed] [Google Scholar]
- 21.Racette BA, Searles Nielsen S, Criswell SR, et al. Dose-dependent progression of parkinsonism in manganese-exposed welders. Neurology 2017;88:344–351. [DOI] [PMC free article] [PubMed] [Google Scholar]
- 22.Fahn S, Elton RL; Members of the UPDRS Development Committee. Unified Parkinson's Disease Rating Scale. In: Fahn S, Marsden CD, Goldstein M, Calne DB, editors. Recent Developments in Parkinson's Disease, vol 2. Florham Park: Macmillan Health Care Information; 1987:153–163. [Google Scholar]
- 23.Criswell SR, Perlmutter JS, Videen TO, et al. Reduced uptake of [(18)F]FDOPA PET in asymptomatic welders with occupational manganese exposure. Neurology 2011;76:1296–1301. [DOI] [PMC free article] [PubMed] [Google Scholar]
- 24.Criswell SR, Perlmutter JS, Huang JL, et al. Basal ganglia intensity indices and diffusion weighted imaging in manganese-exposed welders. Occup Environ Med 2012;69:437–443. [DOI] [PMC free article] [PubMed] [Google Scholar]
- 25.Eisenstein SA, Antenor-Dorsey JA, Gredysa DM, et al. A comparison of D2 receptor specific binding in obese and normal-weight individuals using PET with (N-[(11)C]methyl)benperidol. Synapse 2013;67:748–756. [DOI] [PMC free article] [PubMed] [Google Scholar]
- 26.Brix G, Zaers J, Adam LE, et al. Performance evaluation of a whole-body PET scanner using the NEMA protocol: National Electrical Manufacturers Association. J Nucl Med 1997;38:1614–1623. [PubMed] [Google Scholar]
- 27.Fischl B. FreeSurfer. Neuroimage 2012;62:774–781. [DOI] [PMC free article] [PubMed] [Google Scholar]
- 28.Foster ER, Black KJ, Antenor-Dorsey JA, Perlmutter JS, Hershey T. Motor asymmetry and substantia nigra volume are related to spatial delayed response performance in Parkinson disease. Brain Cogn 2008;67:1–10. [DOI] [PMC free article] [PubMed] [Google Scholar]
- 29.Talairach J, Tournoux P. Co-planar Stereotaxic Atlas of the Human Brain. New York: Theime Verlag; 1988. [Google Scholar]
- 30.Hershey T, Black KJ, Carl JL, McGee-Minnich L, Snyder AZ, Perlmutter JS. Long term treatment and disease severity change brain responses to levodopa in Parkinson's disease. J Neurol Neurosurg Psychiatry 2003;74:844–851. [DOI] [PMC free article] [PubMed] [Google Scholar]
- 31.Logan J, Fowler JS, Volkow ND, Wang GJ, Ding YS, Alexoff DL. Distribution volume ratios without blood sampling from graphical analysis of PET data. J Cereb Blood Flow Metab 1996;16:834–840. [DOI] [PubMed] [Google Scholar]
- 32.Hobson AJ, Sterling DA, Emo B, et al. Validity and reliability of an occupational exposure questionnaire for parkinsonism in welders. J Occup Environ Hyg 2009;6:324–331. [DOI] [PMC free article] [PubMed] [Google Scholar]
- 33.Sanchez G, Determan C. DiscriMiner: Tools of the Trade for Discriminant Analysis: R Package Version 0.1–29 [online]. Available at: CRAN.R-project.org/package=DiscriMiner. Accessed September 15, 2017. [Google Scholar]
- 34.Rencher AC, Christensen WF. Methods of Multivariate Analysis, 3rd ed. Hoboken: Wiley; 2012. [Google Scholar]
- 35.Benjamini Y, Hochberg Y. Controlling the false discovery rate: a practical and powerful approach to multiple testing. J R Stat Soc Ser B 1995;57:289–300. [Google Scholar]
- 36.Cleveland WS. Robust locally weighted regression and smoothing scatterplots. J Am Stat Assoc 1979;74:829–836. [Google Scholar]
- 37.Akaike H. Information theory and an extension of the maximum likelihood principle. In: Petrov BN, Csaki F, editors. Proceedings of the Second International Symposium on Information Theory. Budapest: Akademiai Kiado; 1973:267–281. [Google Scholar]
- 38.Cook RD. Detection of influential observation in linear-regression. Technometrics 1977;19:15–18. [Google Scholar]
- 39.Criswell SR, Nielsen SS, Warden M, et al. [18F]FDOPA positron emission tomography in manganese-exposed workers. Neurotoxicology 2018;64:43–49. [DOI] [PMC free article] [PubMed] [Google Scholar]
- 40.Karimi M, Tian L, Brown CA, et al. Validation of nigrostriatal positron emission tomography measures: critical limits. Ann Neurol 2013;73:390–396. [DOI] [PMC free article] [PubMed] [Google Scholar]
- 41.Brown CA, Karimi MK, Tian L, et al. Validation of midbrain positron emission tomography measures for nigrostriatal neurons in macaques. Ann Neurol 2013;74:602–610. [DOI] [PMC free article] [PubMed] [Google Scholar]
- 42.Nikolaus S, Antke C, Muller HW. In vivo imaging of synaptic function in the central nervous system, I: movement disorders and dementia. Behav Brain Res 2009;204:1–31. [DOI] [PubMed] [Google Scholar]
- 43.Antonini A, Schwarz J, Oertel WH, Pogarell O, Leenders KL. Long-term changes of striatal dopamine D2 receptors in patients with Parkinson's disease: a study with positron emission tomography and [11C]raclopride. Mov Disord 1997;12:33–38. [DOI] [PubMed] [Google Scholar]
- 44.Antonini A, Vontobel P, Psylla M, et al. Complementary positron emission tomographic studies of the striatal dopaminergic system in Parkinson's disease. Arch Neurol 1995;52:1183–1190. [DOI] [PubMed] [Google Scholar]
- 45.Smith Y, Villalba R. Striatal and extrastriatal dopamine in the basal ganglia: an overview of its anatomical organization in normal and Parkinsonian brains. Mov Disord 2008;23(suppl 3):S534–S547. [DOI] [PubMed] [Google Scholar]
- 46.Duda J, Potschke C, Liss B. Converging roles of ion channels, calcium, metabolic stress, and activity pattern of Substantia nigra dopaminergic neurons in health and Parkinson's disease. J Neurochem 2016;139(suppl 1):156–178. [DOI] [PMC free article] [PubMed] [Google Scholar]
- 47.Beaulieu JM, Espinoza S, Gainetdinov RR. Dopamine receptors: IUPHAR review 13. Br J Pharmacol 2015;172:1–23. [DOI] [PMC free article] [PubMed] [Google Scholar]
- 48.Air Contaminants: Code of Federal Regulations, Title 29, Part 1910.1000, Table Z-1. Washington, DC: US Government Publishing Office; 2011. [Google Scholar]
- 49.American Conference of Governmental Industrial Hygienists. Annual Reports for the Year 2012: Committees on Threshold Limit Values (TLVs) and Biological Exposure Indices (BEIs). Cincinnati: ACGIH; 2013. [Google Scholar]
- 50.National Institute for Occupational Safety and Health. Criteria for a recommended standard: welding, brazing, and thermal cutting: U.S. Department of Health and Human Services, Public Health Service, Centers for Disease Control, National Institute for Occupational Safety and Health, Division of Standards Development and Technology Transfer. Cincinnati: Department of Health and Human Services (National Institute for Occupational Safety and Health); 1988. DHHS (NIOSH) publication No. 88-100. [Google Scholar]
- 51.Fitsanakis VA, Zhang N, Garcia S, Aschner M. Manganese (Mn) and iron (Fe): interdependency of transport and regulation. Neurotox Res 2010;18:124–131. [DOI] [PMC free article] [PubMed] [Google Scholar]
Associated Data
This section collects any data citations, data availability statements, or supplementary materials included in this article.
Data Availability Statement
Data from research participants in this study, who authorized sharing of their research data, will be made available to investigators with appropriate expertise and research support after publication of the primary aims of this study. All shared data will be deidentified and will be released in accordance with US regulations.