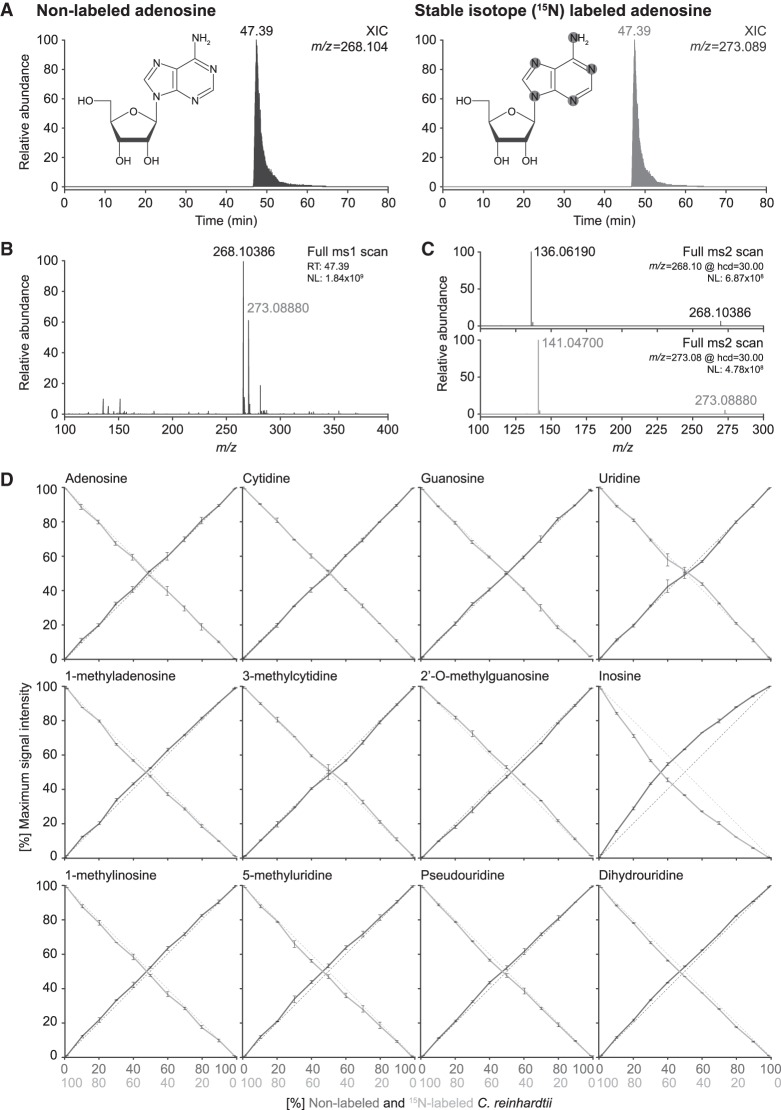
FIGURE 6.
Accurate relative quantification of ribonucleosides can be achieved using stable isotope labeled internal spike-in standards. (A) XICs of adenosine in its native nonlabeled (left panel) form and with stable isotope (15N)-labeling (right panel, spike-in standard), as well as a schematic representation of the chemical structure of adenosine showing the 15N incorporation sites highlighted in gray. (B) MS1 spectrum for adenosine at RT 39.30 min. Note the increase in mass (∼5 Da) resulting from the incorporation of 15N in the base (15N-labeled mass in gray, nonlabeled mass in black). (C) MS2 fragmentation spectra of nonlabeled (top panel; m/z = 268.10) and 15N-labeled (bottom panel; m/z = 273.09) adenosine. Note the appearance of the base at m/z = 136.06 and m/z = 141.05, respectively, corresponding to the expected neutral loss of ribose (−132.04). (D) Cross-dilution series of nonlabeled and 15N-labeled enzymatic digests of bulk tRNA isolated from Chlamydomonas reinhardtii. Quantification of the maximum peak intensity of nonlabeled (solid dark gray line) versus 15N-labeled (solid light gray line) XICs of the canonical bases and representative ribonucleoside modifications. Shown is the abundance ratio of nonlabeled (N) and 15N-labeled (15N) maximum signal intensities (MaxI); Abundance = MaxI15N/(MaxI15N + MaxIN) or vice versa. The dotted lines represent the expected ratio of 15N-labeled (light gray) versus nonlabeled (dark gray) material present in the samples. (NL) Normalized target level.

