ABSTRACT
Treatment of acute myeloid leukemia (AML) remains challenging. Enhancement of anti-tumor responses by blocking negative immune regulators is a promising strategy for novel effective leukemia therapeutics. V-domain Ig suppressor of T-cell activation (VISTA) is a recently defined negative regulator mediating immune evasion in cancer. To investigate the effect of VISTA on anti-leukemia immune response in AML, we initiated a study using clinical samples collected from AML patients. Here we report that VISTA is highly expressed on myeloid-derived suppressor cells (MDSCs) in the peripheral blood of AML patients. Both the frequency and intensity of VISTA expression on MDSCs are significantly higher in newly diagnosed AML than in healthy controls. Importantly knockdown of VISTA by specific siRNA potently reduced the MDSCs-mediated inhibition of CD8 T cell activity in AML, suggesting a suppressive effect of VISTA on anti-leukemia T cell response. Furthermore, we observed a strong positive association between MDSC expression of VISTA and T cell expression of PD-1 in AML. These results support the strategy of VISTA-targeted treatment for AML and underscore the strong potential for combined blockade of VISTA and PD-1 pathways in effective leukemia control.
Keywords: Acute myeloid leukemia (AML), VISTA, programmed cell death protein 1 (PD-1), immunotherapy
Introduction
Despite considerable efforts, the prognosis of acute myeloid leukemia (AML) remains poor with 5-year survival of only 25%. Current mainstream management involves cytotoxic chemotherapy and allogeneic hematopoietic stem cell transplantation. However these high risk therapeutic approaches are often not feasible for elderly patients with multiple co-morbidities. Since the median age of AML at initial diagnosis is 67, novel effective and better-tolerated leukemia therapy is clearly an unmet need.
Immunotherapy is an attractive strategy for cancer treatment due to their relatively convenient administration and better tolerability profile. Studies using reagents inhibiting negative immune regulatory pathways, such as programmed cell death protein 1 (PD-1), have achieved great success.1-3 Blockade antibodies against PD-1 or PD-ligand 1 (PD-L1) have been FDA-approved for treating multiple solid tumors and Hodgkin lymphoma. Several studies including ours have demonstrated an involvement of PD-1 and other inhibitory pathways in AML progression.4-10 Clinical trials investigating the safety and efficacy of PD-1 antibodies in AML are underway. Although promising, tumors may use multiple inhibitory pathways to evade immune attack and a large proportion of patients do not benefit from targeting this single checkpoint molecule. Identification of additional inhibitory pathways is pivotal to the success of this strategy.
V-domain Ig suppressor of T-cell activation (VISTA), also designated as PD-1H, is a recently defined negative regulator mediating immune evasion in cancer11-14. Expression of VISTA is restricted to the hematopoietic system and high on myeloid cells11. Both antigen presenting cells (APCs) and T cells express VISTA and it exerts functions of ligands as well as receptors11,15,16. Interestingly different from the expression pattern of PD-1 ligand, detection of VISTA on tumor cells is minimal.14 In mouse models of multiple solid tumors, over-expression of VISTA in tumor cells significantly increases tumor growth. Consistently blockade antibody against VISTA enhances anti-tumor T cell response and reduces the tumor progression. Combined inhibition of both VISTA and PD-1 pathways synergistically improves anti-tumor T cell activity.14,17 These observations suggest a strong therapeutic potential of targeting VISTA for optimal tumor control. To investigate the effect of VISTA on anti-leukemia immune response in AML, we initiated a study using clinical samples collected from AML patients. Here we report that VISTA is highly expressed on myeloid-derived suppressor cells (MDSCs) and mediates an inhibition of CD8 T cell response in AML. Our findings provide a strong rationale of targeting VISTA for effective leukemia treatment.
Results
VISTA is highly expressed on MDSCs in peripheral blood from AML patients
To determine the involvement of VISTA in the pathogenesis of AML, we initiated a study to investigate the expression of VISTA on each cell component in AML. PBMCs collected from 30 patients with newly diagnosed AML were assessed by flow cytometry. The clinical and demographic information of the patients are summarized in Table 1. Patient age ranged from 19 to 86 with a median age of 66.5 years old. There was wide variation in the white blood cell (WBC) count and percentage of blasts at initial diagnosis. The risk stratification based on cytogenetic features18 was shown. The majority of patients carry intermediate (40%) or high risk (56.7%), only 1 patient (3.3%) was categorized with favorable risk. Consistent with previous reports that VISTA is highly upregulated on myeloid-derived cells,11,15 we observed high expression of VISTA on monocytes (gated on CD45+CD11b+CD14hi/lo) and myeloid leukemia blasts (gated by CD45int, CD45 versus SSC, Figure 1). Although highly heterogeneous within the cohort, the majority of patients express significant level of VISTA on their MDSCs (mean frequency 54.26 ± 5.016, Figure 1A). Of note, when the evaluation was extended to T cells, we found minimal expression of VISTA on CD8, CD4, or regulatory T cells (Treg) in AML patients (Figure 1).
Table 1.
Clinical feature of the AML patients
| Total (n=30) | |
| Age, y | |
| Median | 66.5 |
| Range | 19-86 |
| Gender | |
| Male | 15 |
| Female | 15 |
| WBC, ×109/L | |
| Median | 44.47 |
| Range | 1.21-403 |
| PB blasts (%) | |
| Median | 47.65 |
| Range | 0-97.2 |
| Absolute blasts count, ×109/L | |
| Median | 17.24 |
| Range | 0-391.72 |
| Cytogenetics | |
| Favorable | 1 |
| Intermediate | 12 |
| Adverse | 17 |
Abbreviation: WBC, white blood cell; PB, peripheral blood.
Figure 1.
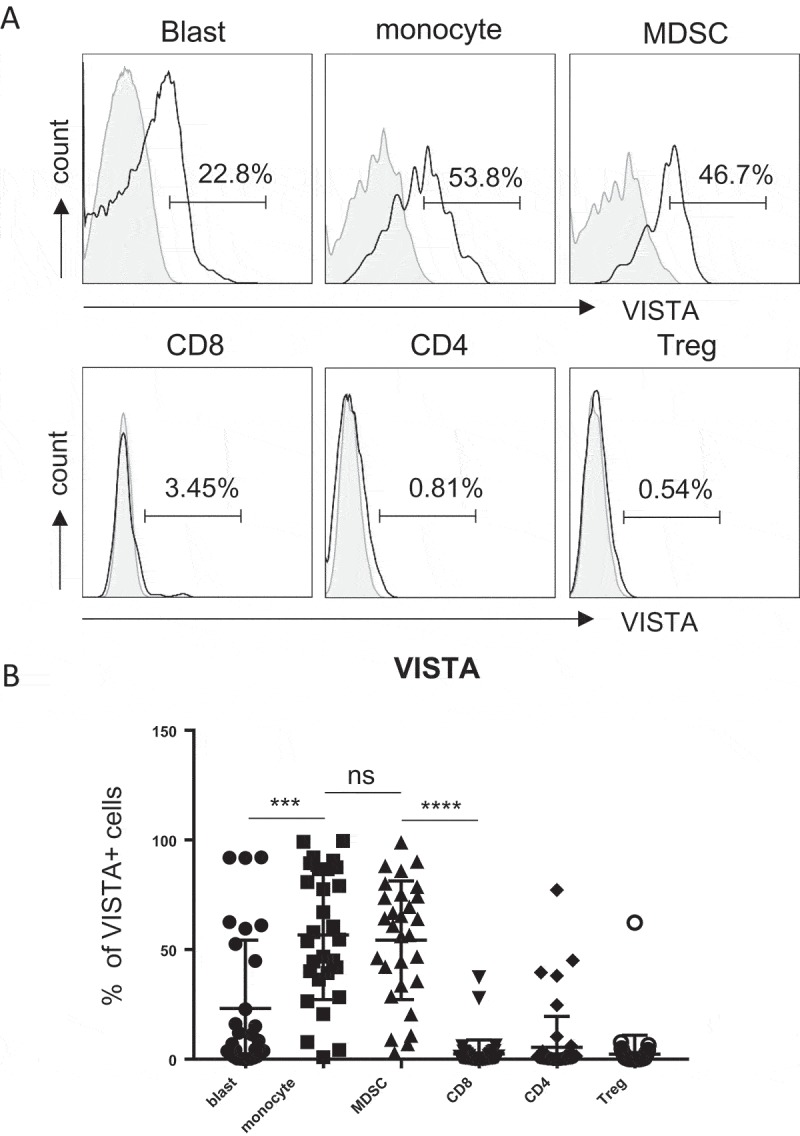
VISTA is highly expressed on MDSCs in peripheral blood from AML patients. PBMCs were isolated from peripheral blood of patients with newly diagnosed AML (n = 30). The expression of VISTA on leukemic blasts, myeloid cells (monocytes and MDSCs) and T cells (CD4, CD8 T cells and Treg) was assessed by flow cytometry. (A) Histograms display the representative flow cytometry data. (B) Summary plot of VISTA expression on indicated subsets, each square represents data from an individual patient. P values were obtained by the unpaired t test or Mann-Whitney test.
MDSCs are increased in patients with newly diagnosed AML
MDSCs are myeloid cells with a strong immunosuppressive activity19. Our observation that VISTA is highly expressed on MDSCs in AML patients led our focus to the effect of VISTA and MDSCs on the immune evasion in AML. We first quantified the MDSCs in peripheral blood from patients with newly diagnosed AML. Samples from 10 healthy donors were tested as controls. MDSCs are generally characterized by CD11b+ CD33+ HLA-DR− phenotype (Figure 2A). They are further defined into two distinct subsets: monocytic MDSCs (CD15−) and granulocytic MDSCs (CD15+)19. Our studies focused on monocytic MDSCs as granulocytic components were largely excluded during the processing of PBMCs that were used in all of our studies. Consistent with findings in recent reports, the numbers of MDSCs in AML patients were significantly higher than that of healthy controls (0.4687 ± 0.2036 × 10⁹ vs. 0.0075 ± 0.0026 × 10⁹, p = 0.0013, Figure 2B). In addition, comparing the MDSCs in newly diagnosed AML to that from the same patients who recovered from induction chemotherapy and achieved complete remission (largely leukemia-free), we observed a significantly lower number of MDSCs in the blood of patients at complete remission (0.0038 ± 0.0013 × 10⁹ vs. 0.1081 ± 0.04822 × 10⁹, p = 0.0122, Figure 2C). This data demonstrates a possible impact of MDSCs on AML pathogenesis.
Figure 2.
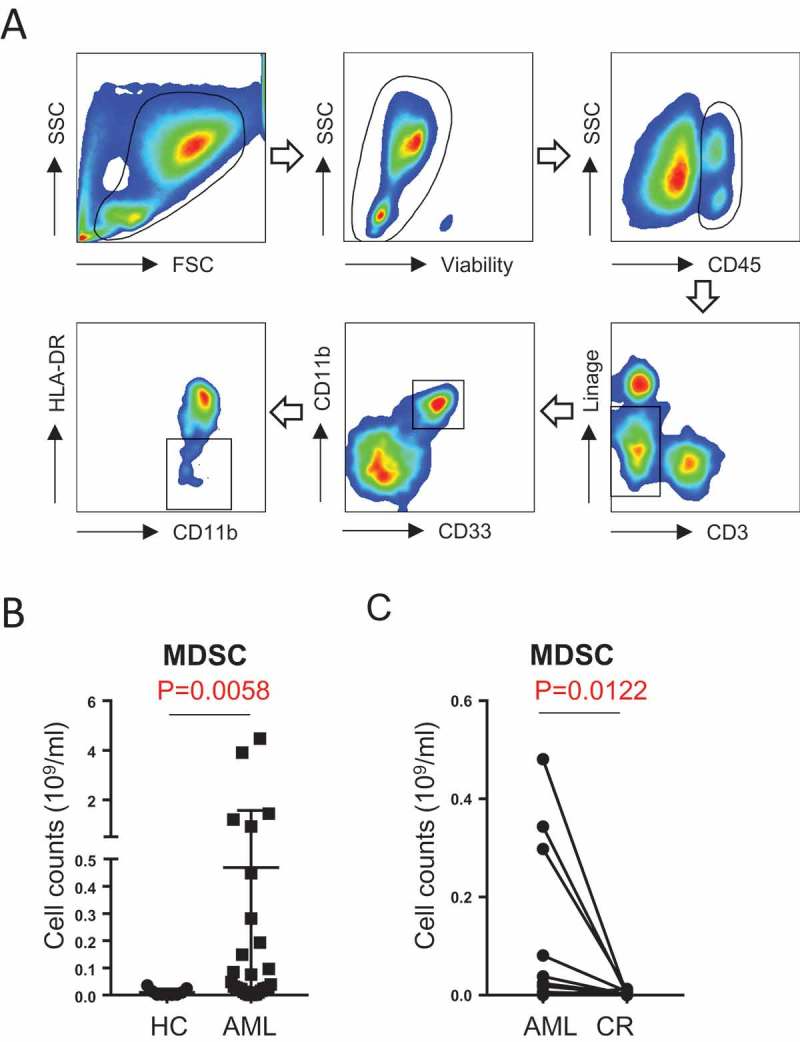
MDSCs are increased in patients with newly diagnosed AML. (A) The gating strategy for MDSCs (CD45+Lin-CD11b+CD33+HLA-DR-) in AML patients by flow cytometry. (B) The absolute number of MDSCs in healthy control (n = 10) vs. AML patients (n = 30) are shown. (C) The absolute number of MDSCs in patients with newly diagnosed AML (n = 12) and the same patients when they achieved complete remission are shown. P values were obtained by Mann-Whitney test and the paired t test.
VISTA is up-regulated on MDSCs in AML patients compared with healthy controls
We next examined the expression of VISTA on MDSCs in AML patients vs. healthy controls. Flow cytometry analysis was performed on PBMCs. Expression of VISTA on MDSCs gated by CD11b+ CD33+ HLA-DR− was evaluated. As shown in Figure 3A, the frequency of VISTA+ cells among MDSCs from AML patients was significantly higher than that from healthy controls (mean frequency 54.26%±5.02% vs. 33.28%±4.89%, p = 0.0262, Figure 3B). Consistently, the mean florescence intensity (MFI) of VISTA is significantly higher in AML (Figure 3C). This observation indicates an involvement of VISTA in the immunosuppressive effect by MDSCs in AML.
Figure 3.
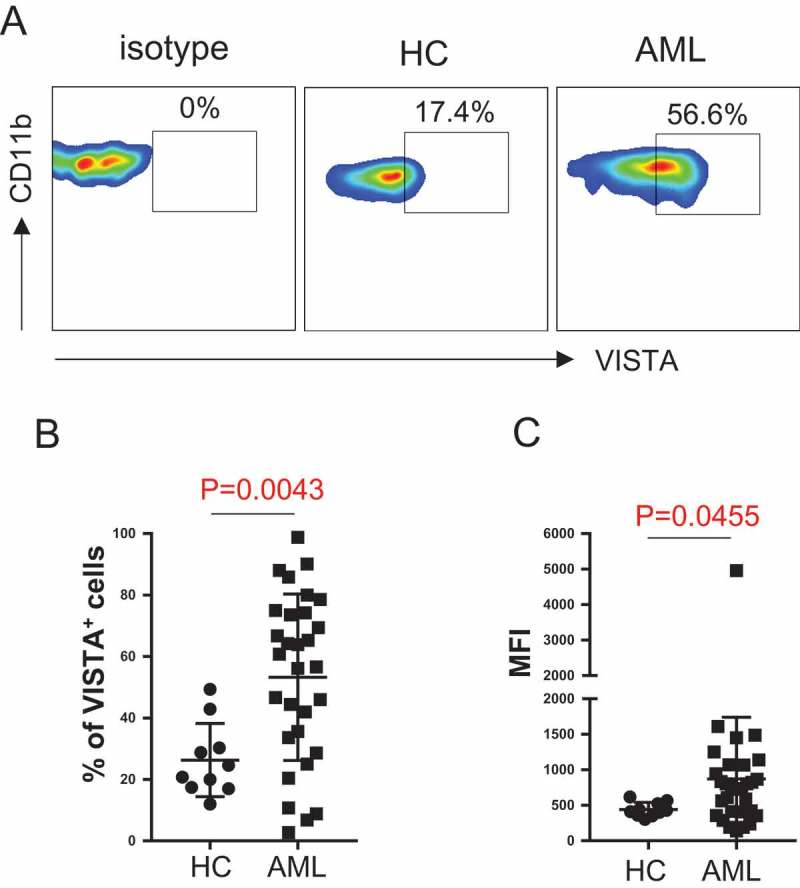
VISTA is up-regulated on MDSCs in AML patients compared with healthy controls. VISTA expression on MDSCs from healthy controls and patients with newly diagnosed AML was assessed by flow cytometry. (A) Representative flow data shows the VISTA expression on MDSCs. (B) Statistical summary of the frequency of VISTA+ MDSCs in healthy control (n = 10) vs. AML patients (n = 30). (C) Mean florescence intensity (MFI) of VISTA on MDSCs. P values were obtained by unpaired t test or Mann-Whitney test.
VISTA knockdown diminished the inhibition of CD8 T cell activity by MDSCs in AML
To assess the effect of MDSCs on CD8 T cell response in AML, we performed a CFSE-based proliferation assay to test the proliferation ability of CD8 T cells upon in vitro stimulation with anti-CD3 and anti-CD28. CD8 T cells were purified from PBMCs from AML patients. Autologous MDSCs were FACS sorted based on the phenotype of CD45+CD11b+ CD33+ HLA-DR−. Adding MDSCs into the co-culture system with the ratio of MDSCs: CD8 T cells as 1:1 significantly decreased CD8 T cell proliferation (Figure 4A), demonstrating an inhibitory effect of MDSCs on CD8 T cell function in AML. To investigate the contribution of VISTA in the MDSC-mediated inhibition of CD8 T cell activity in AML, we used a specific siRNA to knock down VISTA expression in MDSCs from AML patients (Figure 4B). In the CD8 proliferation assay with the presence of autologous MDSCs from AML patients, we observed a significant increase of CD8 T cell proliferation after VISTA knockdown in MDSCs (Figure 4C). These data demonstrate a pivotal role for VISTA in MDSC-mediated suppression of CD8 T cell response in AML patients.
Figure 4.
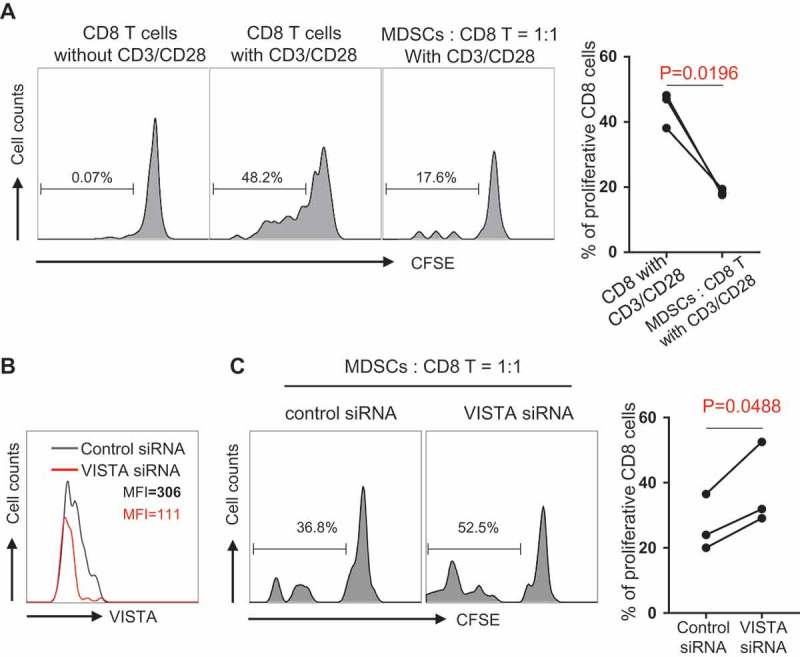
VISTA knockdown diminished the inhibition of CD8 T cell activity by MDSCs in AML. CD8 T cells purified from PBMCs of newly diagnosed AML patients were labeled with CFSE. Autologous MDSCs were FACS sorted based on the phenotype of CD45+ CD11b+ CD33+ HLADR-. Then upon in vitro stimulation with anti-CD3 and anti-CD28, CD8 T cells were co-cultured with MDSCs at the ratio of 1:1 for 3 days. (A) The inhibitory effect of MDSCs on CD8 T cell proliferation. Histograms (left) display the proliferation efficiency of CD8 T cells from indicated culture system. Summary plot (right) shows the frequency of proliferative CD8 T cell in indicated culture system (n = 3). (B) The knockdown efficiency of VISTA siRNA. Non-targeting siRNA was used as control. (C) The proliferative ability of CD8 T cell in co-culture system (MDSC: CD8 = 1:1) at the presence of VISTA siRNA or control siRNA. Histograms (left) show the representative data of CD8 T cell proliferation. Summary plot (right) displays the CD8 T cell proliferative ability upon the effect of control siRNA versus VISTA siRNA. P values were obtained by paired t test.
VISTA expression on MDSCs positively correlates with the frequency of PD-1 on T cells in AML
To determine the association between immune regulations by VISTA and other inhibitory pathways in AML, we performed multi-channel flow cytometry analysis. In addition to the expression of VISTA on MDSCs, the expression of other negative receptors on T cells was assessed on samples from the same AML patients. Several well-known T cell inhibitory receptors including PD-1, T-cell immunoglobulin domain and mucin domain 3 (TIM-3), and T cell immunoglobulin and immunoreceptor tyrosine-based inhibitory motif (ITIM) domain (TIGIT) were examined. We found no correlation between the expression of VISTA on MDSCs and the T cell expression of TIGIT and TIM-3 (Figure 5 A & B). Strikingly, we observed a tight positive correlation between the percentages of VISTA-expressing MDSCs and that of PD-1-expressing T cells including CD8, CD4, and Treg (Figure 5C). This data indicates a potential synergistic effect of VISTA and PD-1 pathways in the suppressive immune regulation in AML.
Figure 5.
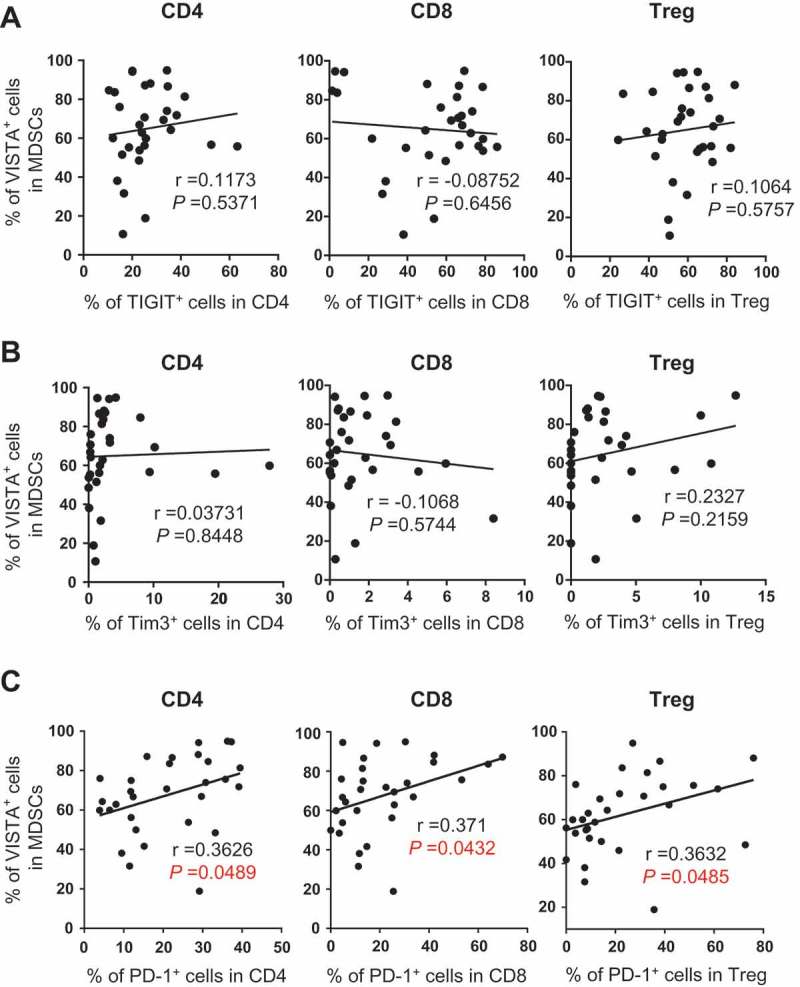
VISTA expression on MDSCs positively correlates with the frequency of PD-1 on T cells in AML. The frequency of TIGIT, TIM-3 and PD-1 on CD4, CD8 and Treg were assessed by flow cytometry. The correlations between the frequency of VISTA+ MDSCs and the frequency of TIGIT+ cells (A), TIM-3+ cells (B), or PD-1+ cells (C) in indicated subsets are shown. P values were obtained by Pearson’s correlation coefficients.
No significant association was detected between VISTA expression on MDSCs and clinical outcome in AML patients
Based on the level of VISTA expression on MDSCs, we defined high-VISTA vs. low-VISTA subgroups in the AML patients. The median level (58.7%) of VISTA expression on MDSCs of the 30 AML patients evaluated in our study was used as the cutoff value. We analyzed clinical characteristics and found no significant difference between the two groups in age, gender, WBC, blast percentage, and cytogenetic features (Data not shown). In order to evaluate the association of VISTA to clinical outcome, we assessed the rate of complete remission after induction chemotherapy and didn’t appreciate a significant difference between the high- vs. low-VISTA subgroups (84.6% vs. 63.6%, p = 0.237, Figure 6A). In addition, both disease-free survival (DFS) and overall survival (OS) were analyzed. With a median follow up of 27.6 months, we observed no difference in either DFS or OS between the high- vs. low-VISTA subgroups of AML patients (Figure 6B & C).
Figure 6.
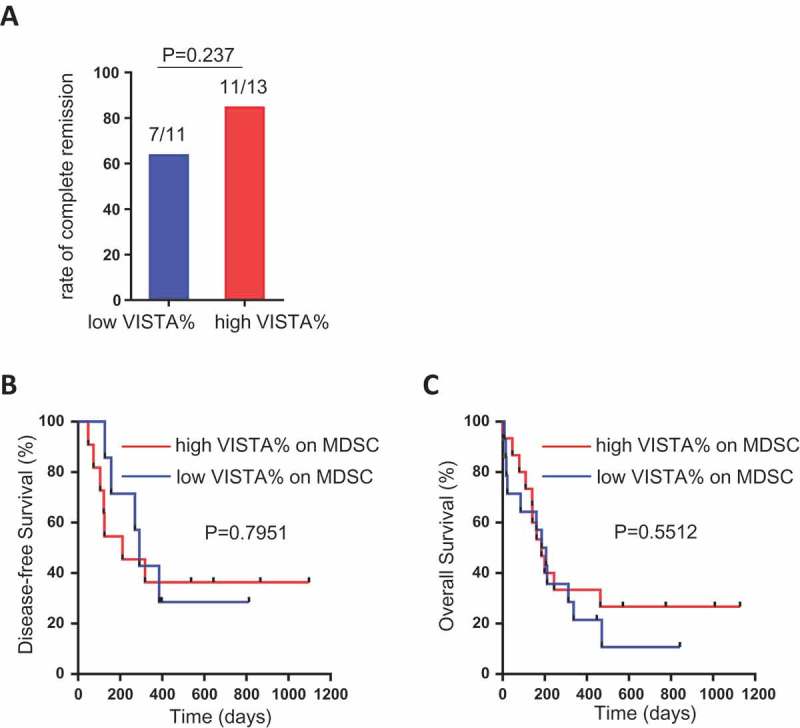
Association between VISTA expression on MDSCs and clinical outcome in AML patients. AML patients were divided into high-VISTA vs. low-VISTA subgroups by using the median value of VISTA expression on MDSCs. (A) Shown is the rate of complete remission after induction chemotherapy in high-VISTA vs. low-VISTA subgroups. (B, C) Shown are the disease-free survival (DFS) and overall survival (OS) between the high-VISTA vs. low-VISTA subgroups of patients. P value was obtained by Fisher’s exact test and Log-rank test.
Discussion
In this study, we performed a comprehensive analysis for the effect of VISTA on the immune response in AML. Using blood samples from a large cohort of patients with AML, we discovered that VISTA is highly expressed on MDSCs in the peripheral blood of AML patients. Both the frequency and intensity of VISTA expression on MDSCs are significantly higher in newly diagnosed AML than in healthy controls. Importantly knockdown of VISTA potently reduced the MDSCs-mediated inhibition of CD8 T cell activity in AML. To our knowledge, this study is the first to demonstrate the upregulation of VISTA in the leukemia microenvironment and its strong immunosuppressive activity in AML. The result of our study has significant clinical impact. In multiple mouse models of solid tumors, VISTA blockade significantly improved anti-tumor T cell response and reduced the tumor growth.14 Anti-human blockade antibodies for VISTA have been made available. Early phase clinical trials testing their safety and efficacy in treating patients with solid tumors are currently being implemented. Our findings that VISTA is a negative immune modulator in AML suggest a strong potential of VISTA-targeted therapeutic approach for effective leukemia therapeutics.
MDSCs are an important cell component in the tumor microenvironment that negatively modulate anti-tumor T cell response.20-22 It has been well recognized, in studies of both pre-clinical and clinical samples, that MDSCs are enriched in the tumor infiltrated tissue in solid tumors.23,24 In addition, significant expansion of MDSCs in peripheral blood has been reported in patients with multiple myeloma, non-Hodgkin’s lymphoma and chronic lymphocytic leukemia.25-27 However studies on the contributions of MDSCs to the pathogenesis of AML are scarce. One report showed a significant increase of MDSCs in the bone marrow of AML patients at initial diagnosis and an association of high MDSCs with minimal residual disease.28 A more recent study demonstrated a higher frequency of MDSCs in the peripheral blood of AML patients and the expansion of MDSCs is driven by leukemia-derived extracellular vesicles.29 In line with these findings, we observed an enhanced presence of monocytic MDSCs in the peripheral blood of AML patients. The number of MDSCs was significantly reduced in patients achieving complete remission after induction chemotherapy. These observations highlight the critical suppressive role of MDSCs in the tumor microenvironment of AML. MDSCs can exert the inhibition of T cell activation through multiple mechanisms including 1) depleting amino acids that are essential for T cell proliferation by overproduction of arginase 1 (ARG1);30 2) causing the loss of T cell receptor by releasing oxidizing molecules (e.g. iNOS) and generating oxidative stress;31,32 3) inducing the development of Treg;33-36 and 4) impairing T cell migration by down regulating trafficking related surface molecules.37-39 In our study, we discovered that VISTA is highly expressed on MDSCs and knockdown of VISTA significantly diminished the MDSC-mediated inhibition of T cell proliferation. This finding suggests that upregulation of VISTA might be an additional mechanism for the immunosuppressive activity of MDSCs, offering a novel strategy of blocking VISTA to normalize MDSCs for cancer immunotherapy.
Of note, we observed significant expression of VISTA on leukemic blasts in AML patients. In multiple models of solid cancers, VISTA was only detected on leukocytes, but not on tumor cells, within the tumor microenvironment.14 However in a recent study examining clinical samples from a large cohort of patients with gastric cancer, expression of VISTA in tumor cells was observed in a small portion (41/464, 8.8%) of patients.The expression of VISTA was exclusively cytoplasmatic in the tumor cells.40 In our study we detected significant surface expression of VISTA on the circulating leukemia cells in peripheral blood from AML patients. This might be related to the myeloid origin of the AML as VISTA is highly expressed on myeloid cells. Further investigation is required to determine whether VISTA expression on leukemia cells interferes with other immune components within the tumor microenvironment and contributes to tumor progression. In a recent study using a mouse model of AML, when PD-1H (VISTA)-expressing murine myeloid leukemia cells were injected into wild type vs. PD-1H knock out mice, the leukemia growth in vivo was reduced in PD-1H knock out mice. Leukemia growth was further diminished by PD-1H blocking antibody.41 These observations suggest that PD-1H (VISTA) on both AML and host cells can cause immune evasion. Therefore the effect of VISTA in AML might be unique, highlighting a strong potential of VISTA-targeted treatment for AML.
Our finding that expression of VISTA is positively correlated with PD-1 expression on T cells in AML is highly clinically relevant. Although promising, we have learned from the studies in solid tumors that clinical response to anti-PD-1 is only about 18–40%.42 Tumors may use a variety of inhibitory pathways to evade immune attack. Combinational treatment targeting multiple suppressive mechanisms is an attractive strategy to improve cancer immunotherapy. In fact, a large clinical study has demonstrated that combining antibodies blocking CTLA-4 and PD-1 is superior to single agent in treating melanoma patients.43 It has been shown that VISTA and PD-1 exert non-redundant immune regulatory functions and synergistically regulate T-cell responses.17 Combined blockade using monoclonal antibodies specific for VISTA and PD-L1 achieved optimal tumor-clearing therapeutic efficacy in murine tumor models.14 Our data indicate an involvement of both VISTA and PD-1 pathways in the immune evasion in AML, therefore combinational treatment targeting these two inhibitory pathways may lead to a successful leukemia control and improve the clinical outcome.
We didn’t appreciate a significant association of VISTA expression level on MDSCs to the clinical outcome among the cohort of AML patients in our study. The rate of complete remission after induction chemotherapy, DFS, and OS were comparable between patients expressing high vs. low level of VISTA on their MDSCs. The small sample size may have limited the capacity of detecting the potential difference. Alternatively, modulation of VISTA alone might not be dominant enough to directly dictate the clinical outcome. Nevertheless, further study in a larger cohort of patients will help to conclude whether VISTA can be used as a prognostic and/or predictive biomarker for AML.
In summary, our study demonstrates that VISTA has significant immunosuppressive activity in AML. Patients with newly diagnosed AML display increased expression of VISTA on MDSCs, and VISTA is critical for the MDSC-mediated CD8 T cell response. Importantly VISTA expression is positively associated with T cell expression of PD-1. These results support the development of a VISTA-targeted strategy and underscore the strong potential for combined blockade of VISTA and PD-1 pathways in effective AML treatment.
Patients and methods
Patients
Peripheral blood samples of AML patients were from the tissue bank maintained by the Penn State Hershey Cancer Institute of Penn State University College of Medicine (Hershey, PA). The study was approved by the Institutional Review Board of Penn State University College of Medicine. Full informed consent was obtained from all patients. Samples from 30 patients (15 males and 15 females with the median age 66.5 years, range, 19–86 years) with diagnosis of AML per WHO classification were used in the study. Samples of 10 healthy volunteers (4 male and 6 females, median age 59 years, range 49–72 years) obtained as controls.
Immunofluorescence staining and flow cytometric analysis
Peripheral blood mononuclear cells (PBMCs) were incubated with directly conjugated mAbs for 30 minutes at 4 ℃. The cells were then washed before flow cytometric analysis. Monoclone Abs used were anti-human CD3-BV605, CD45-BV786, CD14-BV711, HLA-DR-Percp-Cy5.5, CD11b-AF700, Linage (CD19, CD20, CD56, CD40)-FITC, CD4-BV711, CD8 APC-H7, CD25-PE, CD127-BV510, PD-1-BV421, CD-45RA-AF700 (BD Biosciences), VISTA-AF647 (R&D Systems), CD33-APC-cy7 (eBioscience). Data acquisition was performed on a LSR Fortessa flow cytometer (BD Biosciences) and data analysis was performed using FlowJo Software (Tree Star, Ashland, OR, USA).
CFSE staining and T-cell proliferation assay
CD8 T cells were isolated from PBMCs using positive selection with the EasySep Human CD8-Positive Selection Kit (StemCell Technologies). Then CD8 T cells were labeled with 1 µmol/L carboxyfluorescein-diacetate succinimidyl ester (CFSE, Invitrogen). A total of 1 × 10⁵ CFSE-labeled CD8 T cells were cultured with autologous MDSCs (FACS sorted based on the phenotype of CD11+ CD33+ HLA-DR−) with the ratio of MDSCs: CD8 T cells as 1:1, in anti-CD3 (5 µg/mL, functional grade, clone OKT3) coated plates in the presence of soluble anti-CD28 (5 µg/ml, functional grade, clone CD28.2) in RPMI-1640–supplemented medium. After 72 hours, cells were collected. Proliferation of CFSE-labeled cells were assessed by flow cytometry.
SiRNA transfection
SMART-pool Accell VISTA siRNA, Accell Non-targeting Pool and Accell siRNA delivery media were obtained from GE Dharmacon RNA Technologies (GE Dharmacon, Lafayette, CO, USA). Transfection of MDSCs with siRNA was performed according to the manufacturer’s instruction. These siRNAs were transfected at a final concentration of 2 μM in a 96-well tissue culture plate with Accell delivery media for 72 hours. VISTA expression on MDSCs was measured by flow cytometry.
Statistical analysis
GraphPad5 (GraphPad Software, La Jolla,CA, USA) or SPSS 23.0 (IBM Corporation) were used for statistical analysis. For data distributed normally, the comparison of variables was performed using unpaired or paired (where specified) Student’s t test. For data not distributed normally, the comparison of variables was performed with a Mann-Whitney U test or a Wilcoxon signed-rank test for unpaired and paired data, respectively. Comparisons of patient characteristics were analyzed using Fisher exact test (categorical variables) or Willcoxon-rank sum test (continuous variables). To evaluate correlation, Pearson’s correlation coefficients were used. For overall survival, Kaplan-Meier was used. All tests are two-tailed with P < 0.05 considered statistically significant.
Funding Statement
This work was supported by the American Society of Hematology (ASH) Scholar Award Grant and the Kiesendahl Endowment funding.
Disclosure statement
No potential conflict of interest was reported by the authors.
References
- 1.Chen L, Han X.. Anti-pd-1/pd-l1 therapy of human cancer: past, present, and future. J Clin Invest. 2015;125:3384–3391. doi: 10.1172/JCI80011. [DOI] [PMC free article] [PubMed] [Google Scholar]
- 2.Topalian SL, Drake CG, Pardoll DM. Immune checkpoint blockade: A common denominator approach to cancer therapy. Cancer Cell. 2015;27:450–461. doi: 10.1016/j.ccell.2015.03.001. [DOI] [PMC free article] [PubMed] [Google Scholar]
- 3.Sharma P, Allison JP. Immune checkpoint targeting in cancer therapy: toward combination strategies with curative potential. Cell. 2015;161:205–214. doi: 10.1016/j.cell.2015.03.030. [DOI] [PMC free article] [PubMed] [Google Scholar]
- 4.Zhang L, Gajewski TF, Kline J. Pd-1/pd-l1 interactions inhibit antitumor immune responses in a murine acute myeloid leukemia model. Blood. 2009;114:1545–1552. doi: 10.1182/blood-2009-03-206672. [DOI] [PMC free article] [PubMed] [Google Scholar]
- 5.Zhou Q, Munger ME, Veenstra RG, Weigel BJ, Hirashima M, Munn DH, Murphy WJ, Azuma M, Anderson AC, Kuchroo VK, et al. Coexpression of tim-3 and pd-1 identifies a cd8+ t-cell exhaustion phenotype in mice with disseminated acute myelogenous leukemia. Blood. 2011;117:4501–4510. doi: 10.1182/blood-2010-10-310425. [DOI] [PMC free article] [PubMed] [Google Scholar]
- 6.Norde WJ, Maas F, Hobo W, Korman A, Quigley M, Kester MG, Hebeda K, Falkenburg JH, Schaap N, de Witte TM, et al. Pd-1/pd-l1 interactions contribute to functional t-cell impairment in patients who relapse with cancer after allogeneic stem cell transplantation. Cancer Res. 2011;71:5111–5122. doi: 10.1158/0008-5472.CAN-11-0108. [DOI] [PubMed] [Google Scholar]
- 7.Yang H, Bueso-Ramos C, Dinardo C, Estecio MR, Davanlou M, Geng QR, Fang Z, Nguyen M, Pierce S, Wei Y, et al. Expression of pd-l1, pd-l2, pd-1 and ctla4 in myelodysplastic syndromes is enhanced by treatment with hypomethylating agents. Leukemia. 2014;28:1280–1288. [DOI] [PMC free article] [PubMed] [Google Scholar]
- 8.Kong Y, Zhang J, Claxton DF, Ehmann WC, Rybka WB, Zhu L, Zeng H, Schell TD, Zheng H. Pd-1(hi)tim-3(+) t cells associate with and predict leukemia relapse in aml patients post allogeneic stem cell transplantation. Blood Cancer J. 2015;5:e330. doi: 10.1038/bcj.2015.58. [DOI] [PMC free article] [PubMed] [Google Scholar]
- 9.Schnorfeil FM, Lichtenegger FS, Emmerig K, Schlueter M, Neitz JS, Draenert R, Hiddemann W, Subklewe M. T cells are functionally not impaired in aml: increased pd-1 expression is only seen at time of relapse and correlates with a shift towards the memory t cell compartment. J Hematol Oncol. 2015;8:93. doi: 10.1186/s13045-015-0189-2. [DOI] [PMC free article] [PubMed] [Google Scholar]
- 10.Kong Y, Zhu L, Schell TD, Zhang J, Claxton DF, Ehmann WC, Rybka WB, George MR, Zeng H, Zheng H. T-cell immunoglobulin and itim domain (tigit) associates with cd8+ t-cell exhaustion and poor clinical outcome in aml patients. Clin Cancer Res Off J Am Assoc Cancer Res. 2016;22:3057–3066. doi: 10.1158/1078-0432.CCR-15-2626. [DOI] [PubMed] [Google Scholar]
- 11.Wang L, Rubinstein R, Lines JL, Wasiuk A, Ahonen C, Guo Y, Lu LF, Gondek D, Wang Y, Fava RA, et al. Vista, a novel mouse ig superfamily ligand that negatively regulates t cell responses. J Exp Med. 2011;208:577–592. doi: 10.1084/jem.20100619. [DOI] [PMC free article] [PubMed] [Google Scholar]
- 12.Flies DB, Wang S, Xu H, Chen L. Cutting edge: A monoclonal antibody specific for the programmed death-1 homolog prevents graft-versus-host disease in mouse models. J Immunol (Baltimore, Md.: 1950). 2011;187:1537–1541. doi: 10.4049/jimmunol.1100660. [DOI] [PMC free article] [PubMed] [Google Scholar]
- 13.Flies DB, Han X, Higuchi T, Zheng L, Sun J, Ye JJ, Chen L. Coinhibitory receptor pd-1h preferentially suppresses cd4(+) t cell-mediated immunity. J Clin Invest. 2014;124:1966–1975. doi: 10.1172/JCI74589. [DOI] [PMC free article] [PubMed] [Google Scholar]
- 14.Le Mercier I, Chen W, Lines JL, Day M, Li J, Sergent P, Noelle RJ, Wang L. Vista regulates the development of protective antitumor immunity. Cancer Res. 2014;74:1933–1944. doi: 10.1158/0008-5472.CAN-13-1506. [DOI] [PMC free article] [PubMed] [Google Scholar]
- 15.Lines JL, Pantazi E, Mak J, Sempere LF, Wang L, O’Connell S, Ceeraz S, Suriawinata AA, Yan S, Ernstoff MS, et al. Vista is an immune checkpoint molecule for human t cells. Cancer Res. 2014;74:1924–1932. doi: 10.1158/0008-5472.CAN-13-1504. [DOI] [PMC free article] [PubMed] [Google Scholar]
- 16.Le Mercier I, Lines JL, Noelle RJ. Beyond ctla-4 and pd-1, the generation z of negative checkpoint regulators. Front Immunol. 2015;6:418. doi: 10.3389/fimmu.2015.00418. [DOI] [PMC free article] [PubMed] [Google Scholar]
- 17.Liu J, Yuan Y, Chen W, Putra J, Suriawinata AA, Schenk AD, Miller HE, Guleria I, Barth RJ, Huang YH, et al. Immune-checkpoint proteins vista and pd-1 nonredundantly regulate murine t-cell responses. Proc Natl Acad Sci U S A. 2015;112:6682–6687. doi: 10.1073/pnas.1420370112. [DOI] [PMC free article] [PubMed] [Google Scholar]
- 18.Grimwade D, Hills RK, Moorman AV, Walker H, Chatters S, Goldstone AH, Wheatley K, Harrison CJ, Burnett AK. Refinement of cytogenetic classification in acute myeloid leukemia: determination of prognostic significance of rare recurring chromosomal abnormalities among 5876 younger adult patients treated in the united kingdom medical research council trials. Blood. 2010;116:354–365. doi: 10.1182/blood-2009-11-254441. [DOI] [PubMed] [Google Scholar]
- 19.Gabrilovich DI, Ostrand-Rosenberg S, Bronte V. Coordinated regulation of myeloid cells by tumours. Nat Rev Immunol. 2012;12:253–268. doi: 10.1038/nri3175. [DOI] [PMC free article] [PubMed] [Google Scholar]
- 20.Gabrilovich DI, Nagaraj S. Myeloid-derived suppressor cells as regulators of the immune system. Nat Rev Immunol. 2009;9:162–174. doi: 10.1038/nri2506. [DOI] [PMC free article] [PubMed] [Google Scholar]
- 21.Talmadge JE, Gabrilovich DI. History of myeloid-derived suppressor cells. Nat Rev Cancer. 2013;13:739–752. doi: 10.1038/nrc3581. [DOI] [PMC free article] [PubMed] [Google Scholar]
- 22.Kusmartsev S, Gabrilovich DI. Role of immature myeloid cells in mechanisms of immune evasion in cancer. Cancer Immunol ImmunoTher CII. 2006;55:237–245. doi: 10.1007/s00262-005-0048-z. [DOI] [PMC free article] [PubMed] [Google Scholar]
- 23.Greten TF, Manns MP, Korangy F. Myeloid derived suppressor cells in human diseases. Int Immunopharmacol. 2011;11:802–807. doi: 10.1016/j.intimp.2011.01.003. [DOI] [PMC free article] [PubMed] [Google Scholar]
- 24.Katoh H, Wang D, Daikoku T, Sun H, Dey SK, Dubois RN. Cxcr2-expressing myeloid-derived suppressor cells are essential to promote colitis-associated tumorigenesis. Cancer Cell. 2013;24:631–644. doi: 10.1016/j.ccr.2013.10.009. [DOI] [PMC free article] [PubMed] [Google Scholar]
- 25.Gorgun GT, Whitehill G, Anderson JL, Hideshima T, Maguire C, Laubach J, Raje N, Munshi NC, Richardson PG, Anderson KC. Tumor-promoting immune-suppressive myeloid-derived suppressor cells in the multiple myeloma microenvironment in humans. Blood. 2013;121:2975–2987. doi: 10.1182/blood-2012-08-448548. [DOI] [PMC free article] [PubMed] [Google Scholar]
- 26.Liu J, Zhou Y, Huang Q, Qiu L. Cd14(+)hla-dr(low/-) expression: A novel prognostic factor in chronic lymphocytic leukemia. Oncol Lett. 2015;9:1167–1172. doi: 10.3892/ol.2014.2808. [DOI] [PMC free article] [PubMed] [Google Scholar]
- 27.Safarzadeh E, Orangi M, Mohammadi H, Babaie F, Baradaran B. Myeloid-derived suppressor cells: important contributors to tumor progression and metastasis. J Cell Physiol. 2018;233:3024–3036. [DOI] [PubMed] [Google Scholar]
- 28.Sun H, Li Y, Zhang ZF, Ju Y, Li L, Zhang BC, Liu B. Increase in myeloid-derived suppressor cells (mdscs) associated with minimal residual disease (mrd) detection in adult acute myeloid leukemia. Int J Hematol. 2015;102:579–586. doi: 10.1007/s12185-015-1865-2. [DOI] [PubMed] [Google Scholar]
- 29.Pyzer AR, Stroopinsky D, Rajabi H, Washington A, Tagde A, Coll M, Fung J, Bryant MP, Cole L, Palmer K, et al. Muc1-mediated induction of myeloid-derived suppressor cells in patients with acute myeloid leukemia. Blood. 2017;129:1791–1801. doi: 10.1182/blood-2016-07-730614. [DOI] [PMC free article] [PubMed] [Google Scholar]
- 30.Srivastava MK, Sinha P, Clements VK, Rodriguez P, Ostrand-Rosenberg S. Myeloid-derived suppressor cells inhibit t-cell activation by depleting cystine and cysteine. Cancer Res. 2010;70:68–77. doi: 10.1158/0008-5472.CAN-09-2587. [DOI] [PMC free article] [PubMed] [Google Scholar]
- 31.Schmielau J, Finn OJ. Activated granulocytes and granulocyte-derived hydrogen peroxide are the underlying mechanism of suppression of t-cell function in advanced cancer patients. Cancer Res. 2001;61:4756–4760. [PubMed] [Google Scholar]
- 32.Mazzoni A, Bronte V, Visintin A, Spitzer JH, Apolloni E, Serafini P, Zanovello P, Segal DM. Myeloid suppressor lines inhibit t cell responses by an no-dependent mechanism. J Immunol (Baltimore, Md.: 1950). 2002;168:689–695. doi: 10.4049/jimmunol.168.2.689. [DOI] [PubMed] [Google Scholar]
- 33.Pan PY, Ma G, Weber KJ, Ozao-Choy J, Wang G, Yin B, Divino CM, Chen SH. Immune stimulatory receptor cd40 is required for t-cell suppression and t regulatory cell activation mediated by myeloid-derived suppressor cells in cancer. Cancer Res. 2010;70:99–108. doi: 10.1158/0008-5472.CAN-09-1882. [DOI] [PMC free article] [PubMed] [Google Scholar]
- 34.Huang B, Pan PY, Li Q, Sato AI, Levy DE, Bromberg J, Divino CM, Chen SH. Gr-1+cd115+ immature myeloid suppressor cells mediate the development of tumor-induced t regulatory cells and t-cell anergy in tumor-bearing host. Cancer Res. 2006;66:1123–1131. doi: 10.1158/0008-5472.CAN-05-1299. [DOI] [PubMed] [Google Scholar]
- 35.Serafini P, Mgebroff S, Noonan K, Borrello I. Myeloid-derived suppressor cells promote cross-tolerance in b-cell lymphoma by expanding regulatory t cells. Cancer Res. 2008;68:5439–5449. doi: 10.1158/0008-5472.CAN-07-6621. [DOI] [PMC free article] [PubMed] [Google Scholar]
- 36.Hoechst B, Gamrekelashvili J, Manns MP, Greten TF, Korangy F. Plasticity of human th17 cells and itregs is orchestrated by different subsets of myeloid cells. Blood. 2011;117:6532–6541. doi: 10.1182/blood-2010-11-317321. [DOI] [PubMed] [Google Scholar]
- 37.Molon B, Ugel S, Del Pozzo F, Soldani C, Zilio S, Avella D, De Palma A, Mauri P, Monegal A, Rescigno M, et al. Chemokine nitration prevents intratumoral infiltration of antigen-specific t cells. J Exp Med. 2011;208:1949–1962. doi: 10.1084/jem.20101956. [DOI] [PMC free article] [PubMed] [Google Scholar]
- 38.Hanson EM, Clements VK, Sinha P, Ilkovitch D, Ostrand-Rosenberg S. Myeloid-derived suppressor cells down-regulate l-selectin expression on cd4+ and cd8+ t cells. J Immunol (Baltimore, Md.: 1950). 2009;183:937–944. doi: 10.4049/jimmunol.0804253. [DOI] [PMC free article] [PubMed] [Google Scholar]
- 39.Elkabets M, Ribeiro VS, Dinarello CA, Ostrand-Rosenberg S, Di Santo JP, Apte RN, Vosshenrich CA. Il-1beta regulates a novel myeloid-derived suppressor cell subset that impairs nk cell development and function. Eur J Immunol. 2010;40:3347–3357. doi: 10.1002/eji.201041037. [DOI] [PMC free article] [PubMed] [Google Scholar]
- 40.Boger C, Behrens HM, Kruger S, Rocken C. The novel negative checkpoint regulator vista is expressed in gastric carcinoma and associated with pd-l1/pd-1: A future perspective for a combined gastric cancer therapy? Oncoimmunology. 2017;6:e1293215. doi: 10.1080/2162402X.2017.1293215. [DOI] [PMC free article] [PubMed] [Google Scholar]
- 41.Tk Hx K, Wang J, Sanmamed M, Zhang T, Halene S, Pillai MM, Lu J, Xu M, Zeidan AM, Gore SD, et al. Pd-1h (vista) induces immune evasion in acute myeloid leukemia. Blood. 2017;130:2658. [Google Scholar]
- 42.Callahan MK, Postow MA, Wolchok JD. Targeting t cell co-receptors for cancer therapy. Immunity. 2016;44:1069–1078. doi: 10.1016/j.immuni.2016.04.023. [DOI] [PubMed] [Google Scholar]
- 43.Larkin J, Chiarion-Sileni V, Gonzalez R, Grob JJ, Cowey CL, Lao CD, Schadendorf D, Dummer R, Smylie M, Rutkowski P, et al. Combined nivolumab and ipilimumab or monotherapy in untreated melanoma. N Engl J Med. 2015;373:23–34. doi: 10.1056/NEJMoa1504030. [DOI] [PMC free article] [PubMed] [Google Scholar]


