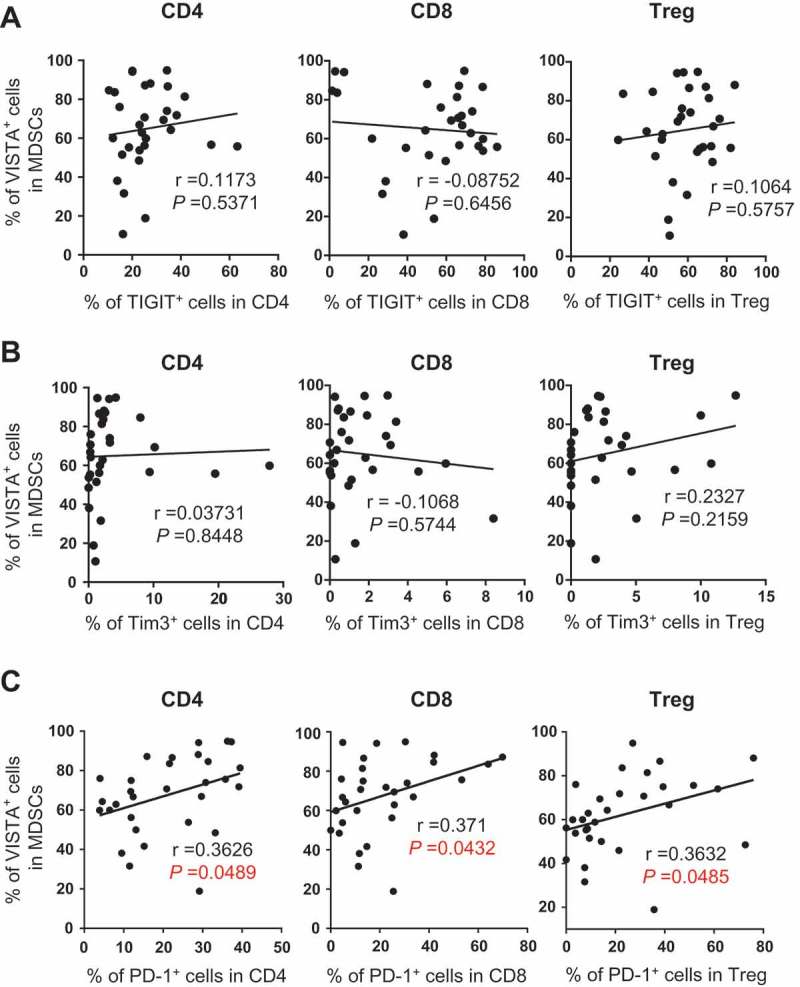
Figure 5.

VISTA expression on MDSCs positively correlates with the frequency of PD-1 on T cells in AML. The frequency of TIGIT, TIM-3 and PD-1 on CD4, CD8 and Treg were assessed by flow cytometry. The correlations between the frequency of VISTA+ MDSCs and the frequency of TIGIT+ cells (A), TIM-3+ cells (B), or PD-1+ cells (C) in indicated subsets are shown. P values were obtained by Pearson’s correlation coefficients.
