

ABSTRACT
Compelling evidence supports the existence of a profound immune dysregulation in patients with chronic myeloproliferative neoplasms (MPN). Increased Arginase-1 expression has been described in MPN patients and in solid cancers. This increase contributes to an immunosuppressive tumor microenvironment in MPN patients because of L-arginine depletion by Arginase-1-expressing regulatory cells and cancer cells, which subsequently limits the activation of circulating effector cells. In the present study, we demonstrate that Arginase-1-derived peptides are recognized by T cells among peripheral mononuclear blood cells from MPN patients. We characterized the Arginase-1-specific T cells as being CD4+ and found that the magnitude of response to the Arginase-1 peptides depends on disease stage. Activation of Arginase-1-specific T cells by vaccination could be an attractive novel immunotherapeutic approach to targeting malignant and suppressive cells in MPN patients in combination with other immunotherapeutics.
Keywords: MPN, Arginase-1, immune responses, therapeutic peptide vaccine
Introduction
The Philadelphia chromosome–negative chronic myeloproliferative neoplasms (MPNs) are neoplastic disorders of the hematopoietic stem cells and are characterized by overproduction of terminally differentiated blood cells that are not fully functional.1 There are three main entities of the MPNs – polycythemia vera (PV), essential thrombocythemia (ET), and primary myelofibrosis (PMF), though boundaries between these three disorders are not well established.1,2 A gain-of-function mutations in Janus kinase 2 (JAK2V617F) is found in 98% of PV and 50–60% of ET and PMF patients,3 and a gain-of-function mutation in the calreticulin gene exon 9 (CALR) is found in 50–60% of wild-type JAK2 ET patients and 75% of wild-type JAK2 PMF patients.4,5 As we previously described, these mutations are recognized by specific T cells and could be promising new targets for immunotherapy.6,7
Even though specific T cells recognize these mutations,6,7 patients with MPN do not eliminate the malignant cells, which evade immune-mediated destruction. Thus, it has been speculated that patients with MPN have a dysregulated immune system.8,9 The enzyme Arginase-1 not only plays an essential role in metabolism but also contributes to immune regulation in cancer by regulating L-arginine metabolism in an immunosuppressive manner. Arginase-1 hydrolyzes the amino acid L-arginine to urea and L-ornithine, depleting the tumor microenvironment from L-arginine and limiting T cell activation, leading to immune suppression.10,11 Arginase-1 is expressed by tumor cells as well as the immune system’s own regulatory cells, such as myeloid-derived suppressor cells (MDSCs). MDSCs are recruited by tumors to escape immune surveillance using their increased expression of Arginase-1.12–14 Wang and colleagues have recently described an increased amount of Arginase-1-expressing MDSCs in MPN patients and shown that MDSCs from patients with MPN are increased in amount and have a more suppressive function than MDSCs from healthy donors.14
Recent evidence supports the view that regulatory T cells retain both suppressor and effector capabilities. We previously reported that self-reactive pro-inflammatory T cells, termed anti-regulatory T cells,15 can specifically target immune suppressive cells in both the periphery and the tumor microenvironment. This capacity suggests the existence of immune system mechanisms that counteract the immune suppressive feedback signals mediated by regulatory cells. Recently, we described Arginase-1-specific T cells that can recognize target cells in a Arginase-1 dependent manner.16 Thus, in the present study, we examined if Arginase-1-specific T cells are present in MPN patients, and we describe the relationship between Arginase-1-specific T-cell responses and patient clinical data.
Materials and methods
Patients and blood samples
A total of 30 MPN patients were recruited in accordance with the protocol approved by the Scientific Ethics Committee for the Capital Region of Denmark. Before study entry, written informed consent was obtained from the patients. Blood samples were drawn, and PBMCs were isolated using LymphoprepTM (Axis Shield, Oslo, Norway) separation and frozen in fetal calf serum with 10% dimethyl sulfoxide (Sigma-Aldrich, St. Louis, MO, USA) until the day of culturing.
Peptides
Epitopes from the Arginase-1 protein were selected from the entire Arginase-1 sequence upon screening of a peptide library covering the entire Arginase-1 sequence.16 For this study, three overlapping Arginase-1 peptides were used: Arg1-18 (AKDIVYIGLRDVDPGEHYIL), Arg1-19 (DVDPGEHYILKTLGIKYFSM), and Arg1-20 (KTLGIKYFSMTE VDRLGIGK). For the ex vivo ELISPOTs and the intracellular cytokine stain, the Arg1-18 peptide was replaced by Arg1-18-1 (AKDIVYIGLRDVDPGEHYI). This sequence is identical to that of Arg1-18 except for the missing L in the C-terminal. The Arg1-18-1 peptide can be used in mouse studies as well as studies with human cells. All peptides were delivered by Schafer (Copenhagen, Denmark) and dissolved in 10 mM dimethyl sulfoxide.
IFNγ ELISPOT assay
Two types of ELISPOT were conducted in this study. In the in vitro ELISPOT, the PBMCs were thawed and stimulated with the respective Arginase-1 peptide in vitro to enhance assay sensitivity. A total of 120 U/mL interleukin-2 (Peprotech, London, UK) was added to the cells on day two, and cells were cultured for one week before the assay. In the ex vivo ELISPOT, the cells were thawed, incubated, and rested overnight before the assay, thus without prior in vitro peptide stimulation. The 96-well nitrocellulose-bottomed plates (Millipore, Burlington, MA, USA) were coated with anti-IFNγ antibody (Mabtech, Nacka Strand, Sverige) for two days at 4°C. The wells were washed and blocked with X-VIVO media for two hours before the addition of the cultured effector cells in triplicates with 3*10^5 cells per well with or without the respective peptide (5 uM). The plates were incubated overnight. The following day, the effector cells were discarded and the plates washed before the biotinylated secondary IFNγ antibody (Mabtech, Nacka Strand, Sverige) was added. The plates were washed again before addition of Streptavidin-AP (Mabtech, Nacka Strand, Sverige) and washed for the last time before the enzyme substrate BCIP/NBT (Mabtech, Nacka Strand, Sverige) was added to the wells to visualize IFNγ-secreting cells. The spots were counted using the CTL ImmunoSpot S6 Ultimate-V analyzer with ImmunoSpot software, version 5.1.
Intracellular cytokine stain
To detect cytokine production by T cells, we used an intracellular cytokine stain. First, the cells were thawed and cultured in the presence of the respective peptide and interleukin-2. After one week of culturing, the cells were plated in triplicates in a round-bottomed 96-well plate, with 3*10^5 cells per well. The cells were stimulated with their respective peptide, and as a control, some were left unstimulated. The cells were incubated for five hours. After one hour of incubation, GolgiPlug (BD Biosciences San Jose, CA, USA) was added (1:1000 dilution). The wells were then washed twice with phosphate-buffered saline, stained with fluorochrome-conjugated extracellular antibodies specific for the surface markers CD3-APC-H7, CD4-FITC, and CD8-PerCP (BD Biosciences San Jose, CA, USA), and dead cells were stained using FVS510 (564,406, BD Biosciences) according to manufacturer’s instructions. Incubated for 30 min. Cells were then washed in FACS buffer and fixed and permeabilized with fixation/permeabilization and permeabilization buffer (Life Technologies, Carlsbad, CA, USA). Next, cells were stained with fluorochrome-conjugated intracellular antibodies specific for the cytokines TNFα-BV421 and IFNγ-APC (BD Biosciences San Jose, CA, USA). Flow cytometry analysis was conducted using a FACS Canto II.
Statistical analysis
Definition of ELISPOT responses was based on the guidelines provided by Moodie and colleagues.17 The DFR method described here was used for statistical analysis of triplicates. DFR, p < 0.05 (*) and DFRx2, p < 0.01 (**) were considered statistically significant. All comparisons between group mean with p < 0.05 (*) and p < 0.01 (**) were analyzed by the Mann–Whitney U test using the statistical software package Prism version 7 (GraphPad Software Inc., San Diego, CA, USA). Error bars denote the standard error of the mean.
Results
Patient characteristics
Thirty patients diagnosed with MPN according to the WHO 2016 MPN classification1 were included in this study. Of the 30 patients, five were diagnosed with ET, nine with PV, four with prefibrotic myelofibrosis (PreMF), and 12 with PMF. Of the group, 14 (47%) had JAK2 mutations, 15 (50%) had CALR mutations, and one (3%) had a myeloproliferative leukemia virus mutation. The anti-proliferative treatment administered to the patients was very heterogeneous as 10 patients (33%) were treated with interferon-alpha, 6 patients (20%) were treated with anagrelide, 3 patients (10%) were treated with hydroxyurea, 3 patients (10%) were treated with anagrelide and hydroxyurea in combination, one patient (3 %) was treated with ruxolitinib, and seven patients (23%) did not receive any medical anti-proliferative treatment.
Strong and frequent responses towards different Arginase-1 epitopes
First, we scrutinized MPN patients for interferon (IFN)γ responses upon stimulation with three Arginase-1 peptides, which in an earlier study from our group incited a strong immune response in patients with malignant melanoma and multiple myeloma.16 Of interest, all three peptides elicited strong responses in in vitro ELISPOTs (Figure 1a). After these intriguing results, we analyzed a total of 30 MPN patients and observed statistically significant responses against all three peptides (Figure 1b). Arg1-19 showed more immune responses compared to the two other peptides as defined statistically by distribution-free resampling (DFR; DFRx2) (Table 1).
Figure 1.
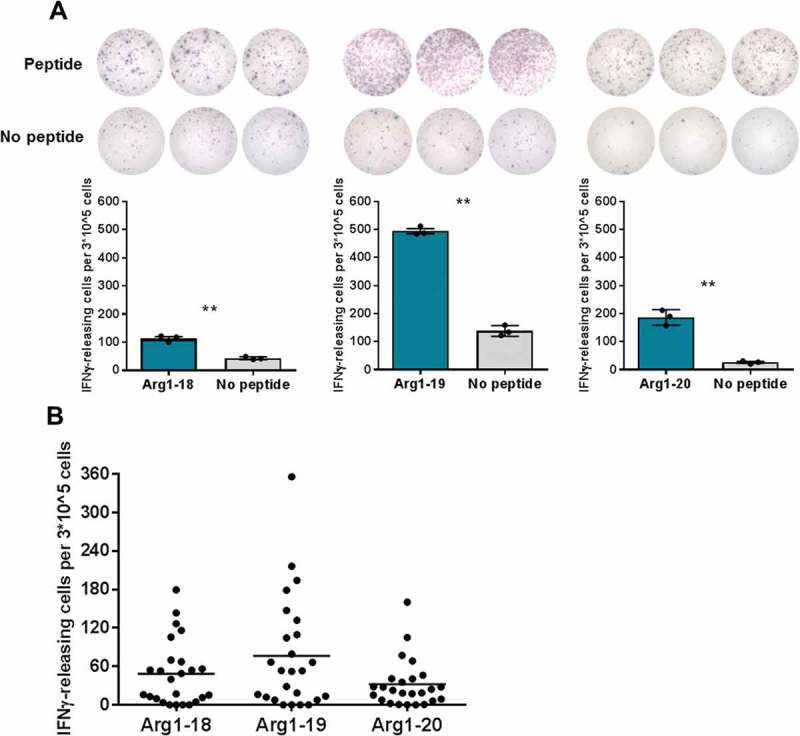
Arginase-1 epitopes are recognized by MPN patient PBMCs. In vitro IFNγ ELISPOT screening of responses against three Arginase-1 epitopes. A) Examples of responses against the three Arginase-1 epitopes. B) ELISPOT results from the whole MPN patient cohort (n = 25). Each data point represents the average number of Arginase-1-specific spots, after subtraction of the mean number of spots from wells without added peptide. This value was calculated per 3*10^5 PBMCs per well. Negative average values were set to zero. The number of DFR and DFRx2 responses to each peptide is indicated in Table 1.
Table 1.
Statistics for Arginase-1 responses in MPN patients. The distribution-free resampling (DFR) method was used for statistical analysis of triplicates. DFR, p < 0.05 and DFRx2, p < 0.01 were considered statistically significant.
| DFR | DFRx2 | ||||
|---|---|---|---|---|---|
| Arg1-18 | n = 25 | 14 | 56% | 4 | 16% |
| Arg1-19 | n = 25 | 12 | 48% | 7 | 28% |
| Arg1-20 | n = 25 | 11 | 44% | 1 | 4% |
Two assays were conducted for the same four patients (two diagnosed with ET, two diagnosed with PV), one with 24 hours of incubation and one with 48 hour of incubation to increase the sensitivity of the assay. For the 24-hour–incubated ex vivo ELISPOT, a DFR-defined response towards Arg1-19 or Arg1-20 was detected in two of the four patients. For the 48-hour–incubated ex vivo ELISPOT, a DFR-defined response against Arg1-18-1 was detected in two patients (Figure 2a), and one patient showed a DFR-defined response towards both Arg1-18-1 and Arg1-19 (Figure 2b).
Figure 2.
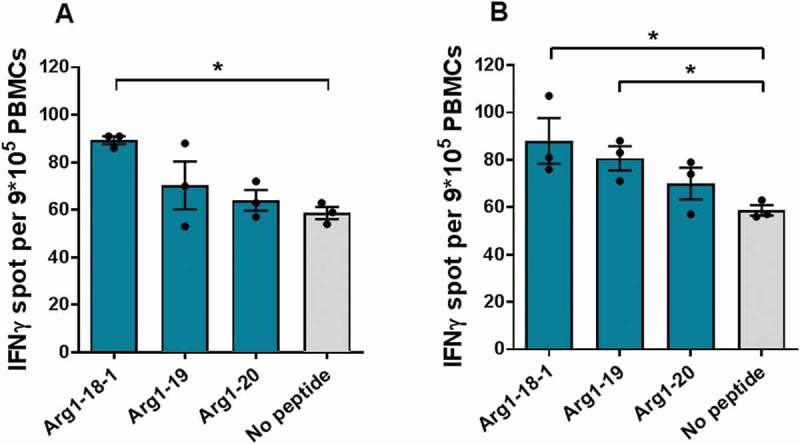
Spontaneous recognition of Arginase-1 epitopes by MPN patients PBMCs. 48-hour ex vivo IFNγ ELISPOT screening of Arginase-1 responses in MPN patients. 9*10^5 cells per well. A) patients diagnosed with PV; B) patient diagnosed with ET.
Arginase-1-specific t cells are CD4+ t cells
To identify the phenotype of the Arginase-1-specific T cells, we performed intracellular cytokine staining in four ET patients, four PV patients, and three PreMF patients with solid IFNγ ELISPOT responses (no PMF patients were included due to low responses in these patients in ELISPOT). Ten of the 11 analyzed patients demonstrated an Arginase-1-specific immune response (Figure 3). All responses were identified in CD4+ T cells, and the strongest responses were against Arg1-19. The median proportion of tumor necrosis factor (TNF)α/IFNγ-secreting T cells (Figure 3b, bottom) was 0.051% in the peptide-stimulated cells vs. 0.0068% in the control (p = 0.0012), and the median amount of TNFα-secreting cells (Figure 3b, top) was 0.46% vs. 0.21% in the control (p = 0.013). There was no statistically significant difference in levels of IFNγ-secretion (Figure 3b, middle).
Figure 3.
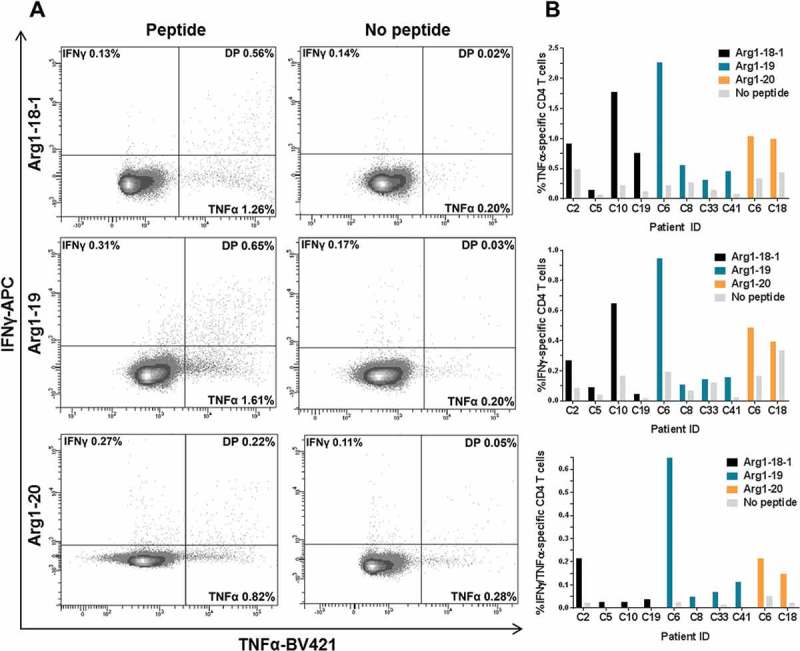
Arginase-1-specific T-cell responses are CD4+ T cells. Flow cytometry plots were gated on live CD4+ T cells. A) Intracellular cytokine staining with a CD4+ T cell gate demonstrates strong TNFα+ and IFNγ+/TNFα+ (double positive; DP) responses against the three Arginase-1 epitopes in MPN patients PBMCs. B) Bar chart showing the difference in the release of TNFα (top), IFNγ (middle), and TNFα/IFNγ (bottom) between cells stimulated with Arginase-1 peptide or no peptide.
Patients with advanced disease show weaker responses
Earlier we showed that patients with ET harbor more frequent immune responses to CALR mutant epitopes compared to patients with PMF, which is in line with the theory on cancer immune editing, where advanced cancer can dampen the immune response.18,19 Therefore, we chose to investigate if patients with ET or PV harbor more frequent Arginase-1 responses compared to patients with PMF. We identified a tendency for patients diagnosed with ET to mount better IFNγ responses upon stimulation with Arginase-1 peptides compared to the more progressed diseases PV, PreMF, and PMF (supplementary figure). To elucidate this tendency, all responses towards the three Arginase-1 peptides were then pooled according to diagnosis, and Mann–Whitney U test analyses were performed (Figure 4). PreMF responses are not included here because the cases were too few (n = 4). The statistical analysis demonstrated a significant (p = 0.010) decrease in responses in the PMF patients compared to the ET patients (Figure 4), indicating that patients diagnosed with the more aggressive PMF disease have a more compromised immune response compared to ET patients. The PV patients seemed to have the lowest response.
Figure 4.
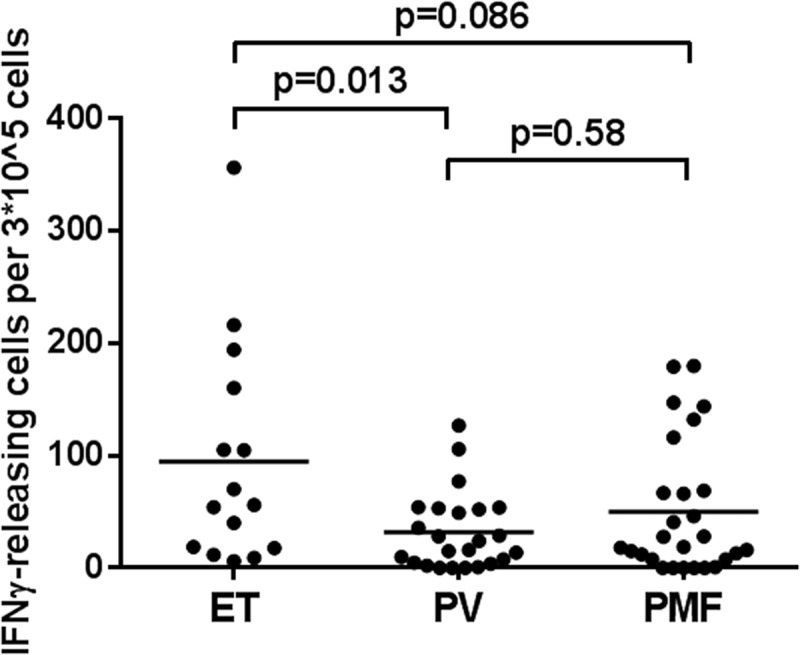
Differences in the strength of Arginase-1 epitope recognition according to MPN diagnoses. In vitro IFNγ ELISPOT data according to diagnosis (ET: n = 5; PV: n = 8; PMF: n = 9). Each data point represents the average number of arginase-1-specific spots, after subtraction of the mean number of spots from wells without added peptide. This value was calculated per 3*10^5 PBMCs. The Mann–Whitney U test was used to compare group means.
To elucidate the effect of the mutational status on the disease, we pooled all IFNγ responses according to mutational status and performed statistical analysis once again (Figure 5a). In this analysis, we identified no significance.
Figure 5.
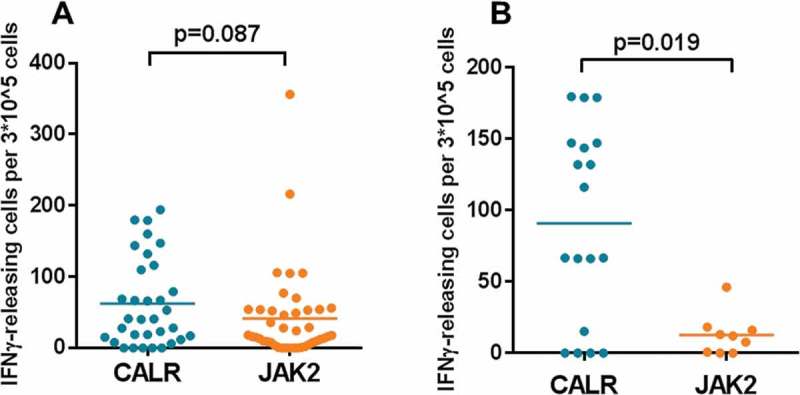
Stronger recognition of Arginase-1 epitopes in PMF patients with a CALR mutation. In vitro IFNγ ELISPOT data according to mutational status. Each data point represents the average number of Arginase-1-specific spots, after subtraction of the mean number of spots from wells without added peptide. A) Arginase-1 peptide responses from the four diagnoses are pooled according to mutational status. The group means were compared, but no significance was found (p = 0.087). B) Arginase-1 peptides responses in PMF patients are pooled according to mutational status. The group means were compared, but no significance was found (p = 0.019).
The occurrence of Arginase-1-specific immune responses was correlated with the patient clinical data (Table 2), where an Arginase-1-specific immune response was defined as a response against two or more of the three evaluated peptides. An Arginase-1-specific immune response was seen in 5/5 (100%) of patients with ET, 7/9 (78%) of patients with PV, and 5/12 (42%) of patients with PMF. The patients were then divided into two new groups: non-PMF and PMF. An Arginase-1-specific immune response was seen in 3/18 (17%) of patients with non-PMF vs. 7/12 (58%) of patients with PMF (p = 0.045). There were no statistical difference between Arginase-1 responders and non-responders according to sex, hematological response, anti-proliferative treatment, median age at diagnosis, median age at blood sampling, or median disease duration.
Table 2.
Statistics for clinical data on all patients included in the study. A response is defined as at least one DFR response against more than one of the three Arginase-1 peptides. The diagnoses ET, PV, and PreMF are defined as non-PMF. Disease duration was calculated from the date of diagnosis to the date of calculation.
| Response (%) | No response (%) | P value | ||
|---|---|---|---|---|
| Sex | 0.43 | |||
| Female | 14 (74) | 5 (26) | ||
| Male | 6 (55) | 5 (46) | ||
| Diagnosis | 0.11 | |||
| ET | 5 (100) | 0 (0) | ||
| PV | 7 (78) | 2 (22) | ||
| PreMF | 3 (75) | 1 (25) | ||
| PMF | 5 (42) | 7 (58) | ||
| Diagnosis (non-PMF vs. PMF) | 0.045 | |||
| Non-PMF | 15 (83) | 3 (17) | ||
| PMF | 5 (42) | 7 (58) | ||
| Mutation type | 1.00 | |||
| CALR | 10 (67) | 5 (33) | ||
| JAK2V617F | 9 (64) | 5 (36) | ||
| Hematological response | 0.078 | |||
| Response | 17 (77) | 5 (23) | ||
| Stable disease or progression | 3 (38) | 5 (62) | ||
| Median age at diagnosis | 54 | 56 | 1.00 | |
| Median age at blood sampling | 66.5 | 61 | 0.70 | |
| Median disease duration, years | 7 | 7.5 | 1.0 |
Mutational status affects Arginase-1 peptide responses in PMF patients
Because PMF patients seemed to show better responses to the Arginase-1 peptides than the PV patients did, we investigated whether the Arginase-1 responses could be affected by the mutational status of only the PMF patients. To compare the JAK2 (n = 3) and CALR (n = 9) mutation PMF patient groups, we again pooled the Arginase-1 responses according to mutational status and used the Mann–Whitney U test to compare the two groups. The result showed a significant difference between them (p = 0.019) (Figure 5b). In the same analyses for the other diagnostic groups, we found no significance (data not shown).
Discussion
There is now compelling evidence describing a profound immune dysregulation in patients with MPN,20 leading to the speculation that MPN may evolve and progress due to a defect in tumor immune surveillance.9 In solid cancers, L-arginine depletion by Arginase-1-expressing regulatory cells and cancer cells is an important contribution to an immunosuppressive tumor microenvironment, which subsequently limits the activation of circulating effector cells.10,11 High Arginase-1 expression in the peripheral blood of MPN patients was recently described.14 Specific targeting of such Arginase-1-expressing regulatory cells could potentially restore the arginine balance, leading to T cell proliferation and decreased immune suppression in the tumor microenvironment. In this study, we report that Arginase-1-derived peptides were recognized by peripheral blood mononuclear cells (PBMCs) from MPN patients. We show that patients with MPN harbor spontaneously occurring Arginase-1-specific T cells, which could possibly be used to enhance the tumor-specific immune responses just recently described in MPN.7 The high numbers of Arginase-1-specific T cells in MPN patients were especially detected in response to the Arg1-19 peptide, indicating that this peptide includes a more immunogenic epitope within the Arginase-1 protein in MPN. It was especially noteworthy that we could measure specific T-cell responses directly ex vivo. The detection of tumor-associated antigen-specific T cells either by tetramer staining or by ELISPOT in PBMCs directly ex vivo without an in vitro peptide stimulation have been rare.22 Patients with MPN spontaneously demonstrate strong immune responses towards Arginase-1 ex vivo, which implies that the immune system in MPN can selectively target regulatory cells and thus enhance the anti-tumor immune response. We found more frequent 48-hour than 24-hour ex vivo responses, indicating a slow processing and presentation of the peptides. This effect could be explained by the use of long peptides, where the antigen-presenting cells need to process the peptides through the endoplasmic reticulum, which is why we also saw CD4+ T-cell responses and no CD8+ T-cell responses. From the responding CD4+ T cells, we identified frequent IFNγ and TNFα responses upon stimulation with three different Arginase-1 peptides. It is possible that Arginase-1 peptides are presented on class I HLA-molecules and subsequently, CD8+ T-cell responses are evident if the cells have a longer period to process and present the peptides.16 The absence of CD8+ T-cell responses could also result from defective processing and assembly of the class I HLA:antigen complex, as the chaperone calreticulin plays a key role in the loading of HLA class I molecules, and a defective complex may not be exported from the endoplasmic reticulum to the Golgi apparatus.23 Thus, the CALR mutation might lead to lower expression of class I HLA-molecules and thus no CD8+ T-cell responses. However, this will naturally only impact the malignant cells.
To analyze the ELISPOT data according to MPN diagnosis, we divided the detected responses accordingly. We found that ET patients showed higher IFNγ responses upon stimulation with Arginase-1 peptides compared to the more progressed diseases PV and PMF. Because the strength of the immune response decreases as the disease evolves, these results suggest that the cancer cells may be held in equilibrium by the immune system (ET patients) and then escape to the metastatic disseminated stage (PMF patients). The above differences clearly show a trend supporting the notion that advanced cancer suppresses the immune system and thus evades immune-mediated destruction. To address this important notion we are planning a study looking at Cytomegalovirus (CMV) responses according to MPN diagnosis. The results also fit with the clinical data in which ET patients had a total response compared to the PMF patients, among whom only half showed a response. Furthermore, the PMF patients who showed the highest immune responses against the Arginase-1 epitopes harbored CALR mutations, which could explain why patients with CALR-mutant PMF have markedly longer survival than their JAK2V617F mutant counterparts.24 We speculate that the low frequency of immune responses detected in this group is attributable to patients having a higher allele burden because they have a more compromised immune system. Furthermore, as with MDSCs, the JAK2 mutation induces accumulation of reactive oxygen species.25,26 Thus, the high mutated allele burden results in accumulation of reactive oxygen species, which may subsequently decrease T cell reactivity. This conclusion is substantiated by our data in which the patients with JAK2-mutated PMF showed almost no Arginase-1-specific immune responses. Our clinical data also show that anti-proliferative treatment does not influence on the occurrence of Arginase-1-specific immune responses. But given the very heterogeneous treatment administered to our group of patients it should not be excluded, that treatment with immune-stimulatory agents such as IFNα could instigate an Arginase-1-specific immune responses.
We recently reported that both the JAK2V617F and CALR exon 9 mutations are potential targets for cancer immune therapy.6,19,21 In our opinion, co-vaccination with JAK2 mutant/CALR mutant epitopes and Arginase-1 epitopes might be synergistic. The desired effects of therapeutic cancer vaccines might be antagonized by immune suppressive cells, in which case the addition of Arginase-1 epitopes could be highly synergistic and easily implemented. Activating Arginase-1-specific T cells in a therapeutic setting is interesting because Arginase-1-expressing myeloid cells contribute to an immunosuppressive tumor microenvironment that prevents effector lymphocyte proliferation.10,11 Specifically targeting Arginase-1-expressing myeloid cells (e.g., neutrophils, MDSCs, and tumor-associated macrophages) could potentially induce T-cell infiltration at the tumor site. In this scenario, Arginase-1 vaccination could induce Th1 inflammation at tumor sites where regulatory myeloid cells otherwise prevent lymphocyte infiltration, enabling mutant-specific T cells to function at the location. Concurrently, vaccination with JAK2 mutant/CALR mutant peptides would induce and activate T cells specific for JAK2 and CALR mutant cells.
Accumulation of myeloid regulatory cells in the bone marrow of MPN patients restricts T-cell accumulation within the vicinity of cancer cells. These suppressive cells are a major factor in limiting the efficacy of checkpoint blockade to only a small fraction of patients with solid cancer. Our characterization of Arginase-1-specific T cells in MPN may also lead to a translatable strategy for improving checkpoint blockade efficacy by activating specific T cells that react to regulatory cells at the tumor site including tumor cells, and induce local inflammation. We hypothesize that a vaccine activating Arginase-1-specific T cells would attract T cells into the tumor, inducing Th1 inflammation, which would further induce PD-L1 expression in cancer and immune cells, generating targets more susceptible to anti-PD-1/PD-L1 immunotherapy. Likewise, these measures would make patients more susceptible to vaccines targeting the mutated CALR or JAK2, as discussed above. Taken together, combinatorial immune therapy including an Arginase-1 vaccine could be an attractive and novel way to treat MPN patients.
Funding Statement
This work was supported by Copenhagen University Hospital, Herlev, the Danish Cancer Society, and the Danish Council for Independent Research. The funders had no role in the study design, data collection and analysis, decision to publish, or manuscript preparation.
Disclosure of Potential Conflicts of Interest
Mads Hald Andersen has filed a patent application based on the use of Arginase-1 for vaccination. The rights of the patent application have been transferred to Copenhagen University Hospital, Herlev through the Capital Region of Denmark. The other authors declare “no conflict of interest”.
Supplemental data
Supplemental data for this article can be accessed here.
Acknowledgments
We thank Merete Jonassen and Tina Seremet for their excellent technical assistance, and Per thor Straten for scientific discussions.
References
- 1.Arber DA, Orazi A, Hasserjian R, Thiele J, Borowitz MJ, Le Beau MM, Bloomfield CD, Cazzola M, and Vardiman JW.. The 2016 revision to the World Health Organization classification of myeloid neoplasms and acute leukemia. Blood. 2016;127(20):2391–2406. doi: 10.1182/blood-2016-03-643544. [DOI] [PubMed] [Google Scholar]
- 2.Campbell P, Green A. The myeloproliferative disorders. N Engl J Med. 2006;355(23):2452–2504. doi: 10.1056/NEJMra063728. [DOI] [PubMed] [Google Scholar]
- 3.Vainchenker W, Kralovics R. Genetic basis and molecular pathophysiology of classical myeloproliferative neoplasms. Blood. 2017;129(6):667–679. doi: 10.1182/blood-2016-10-695940. [DOI] [PubMed] [Google Scholar]
- 4.Klampfl T, Gisslinger H, Harutyunyan AS, Nivarthi H, Rumi E, Milosevic JD, Them NCC, Berg T, Gisslinger B, Pietra D, et al. Somatic mutations of calreticulin in myeloproliferative neoplasms. N Engl J Med. 2013;369(25):2379–2390. doi: 10.1056/NEJMoa1311347. [DOI] [PubMed] [Google Scholar]
- 5.Nangalia J, Massie CE, Baxter EJ, Nice FL, Gundem G, Wedge DC, Avezov E, Li J, Kollmann K, Kent DG, et al. Somatic CALR mutations in myeloproliferative neoplasms with nonmutated JAK2. N Engl J Med. 2013;369(25):2391–2405. doi: 10.1056/NEJMoa1312542. [DOI] [PMC free article] [PubMed] [Google Scholar]
- 6.Holmström MO, Hjortsø MD, Ahmad SM, Ö M, Martinenaite E, Riley C, Straten P, Svane IM, Hasselbalch HC, Andersen MH. The JAK2V617F mutation is a target for specific T cells in the JAK2V617F-positive myeloproliferative neoplasms. Leukemia. 2017;31(2):495–498. doi: 10.1038/leu.2016.290. [DOI] [PubMed] [Google Scholar]
- 7.Holmström MO, Martinenaite E, Ahmad SM, Ö Met, Friese C, Riley CH, Thor Straten P, Svane IM, Hasselbalch HC, Andersen MH. The calreticulin (CALR) exon 9 mutations are promising targets for cancer immune therapy. Leukemia. 2017;2 :1–9. [DOI] [PubMed] [Google Scholar]
- 8.Barosi G. An immune dysregulation in MPN. Curr Hematol Malig Rep. 2014;9(4):331–339. doi: 10.1007/s11899-014-0227-0. [DOI] [PubMed] [Google Scholar]
- 9.Hasselbalch HC. Chronic inflammation as a promotor of mutagenesis in essential thrombocythemia, polycythemia vera and myelofibrosis. A human inflammation model for cancer development? Leuk Res. 2013;37(2):214–220. doi: 10.1016/j.leukres.2012.10.020. [DOI] [PubMed] [Google Scholar]
- 10.Munder M, Mollinedo F, Calafat J, Canchado J, Gil-Lamaignere C, Fuentes JM, Luckner C, Doschko G, Soler G, Eichmann K, Müller FM, Ho AD, Goerner M, Modolell M. Arginase I is constitutively expressed in human granulocytes and participates in fungicidal activity. Blood. 2005;105(6):2549–2557. doi: 10.1182/blood-2004-07-2521. [DOI] [PubMed] [Google Scholar]
- 11.Munder M. Arginase: an emerging key player in the mammalian immune system. Br J Pharmacol. 2009;158:638–651. doi: 10.1111/j.1476-5381.2009.00291.x. [DOI] [PMC free article] [PubMed] [Google Scholar]
- 12.Umansky V, Blattner C, Fleming V, Hu X, Gebhardt C, Altevogt P, Utikal J. Myeloid-derived suppressor cells and tumor escape from immune surveillance. Semin Immunopathol. 2017;39(3):295–305. doi: 10.1007/s00281-016-0597-6. [DOI] [PubMed] [Google Scholar]
- 13.Andersen M. The targeting of immunosuppressive mechanisms in hematological malignancies. Leukemia. 2014;28(9):1784–1792. doi: 10.1038/leu.2014.108. [DOI] [PubMed] [Google Scholar]
- 14.Wang JC, Kundra A, Andrei M, Baptiste S, Chen C, Wong C, Sindhu H. Myeloid-derived suppressor cells in patients with myeloproliferative neoplasm. Leuk Res. 2016;43:39–43. doi: 10.1016/j.leukres.2016.02.004. [DOI] [PubMed] [Google Scholar]
- 15.Andersen MH. Immune regulation by self-recognition: novel possibilities for anticancer immunotherapy. J Natl Cancer Inst. 2015;107(9):1–8. doi: 10.1093/jnci/djv154. [DOI] [PMC free article] [PubMed] [Google Scholar]
- 16.Martinenaite E, Mortensen REJ, Hansen M, Orebo Holmström M, Munir Ahmad S, Grønne Dahlager Jørgensen N, Met Ö, Donia M, Svane IM, Andersen MH. Frequent adaptive immune responses against Arginase-1. Oncoimmunology. 2017;7(3):e1404215-1 - e1404215-9. [DOI] [PMC free article] [PubMed] [Google Scholar]
- 17.Moodie Z, Price L, Gouttefangeas C, Mander A, Janetzki S, Löwer M, Welters MJP, Ottensmeier C, Van Der Burg SH, Britten CM. Response definition criteria for ELISPOT assays revisited. Cancer Immunol Immunother. 2010;59(10):1489–1501. doi: 10.1007/s00262-010-0875-4. [DOI] [PMC free article] [PubMed] [Google Scholar]
- 18.Dunn GP, Bruce AT, Ikeda H, Old LJ, Schreiber RD. Cancer immunoediting: from immunosurveillance to tumor escape. Nat Immunol [Internet]. 2002;3(11):991–998. http://www.nature.com/doifinder/10.1038/ni1102-991. [DOI] [PubMed] [Google Scholar]
- 19.Holmstrom MO, Riley CH, Svane IM, Hasselbalch HC, Andersen MH. The CALR exon 9 mutations are shared neoantigens in patients with CALR mutant chronic myeloproliferative neoplasms. Leukemia. 2016;30(12):2413–2416. doi: 10.1038/leu.2016.233. [DOI] [PubMed] [Google Scholar]
- 20.Tefferi A, Vaidya R, Caramazza D, Finke C, Lasho T, Pardanani A. Circulating interleukin (IL)-8, IL-2R, IL-12, and IL-15 levels are independently prognostic in primary myelofibrosis: A comprehensive cytokine profiling study. J Clin Oncol. 2011;29(10):1356–1363. doi: 10.1200/JCO.2010.32.9490. [DOI] [PubMed] [Google Scholar]
- 21.Holmström MO, Hasselbalch HC, Andersen MH. The JAK2V617F and CALR exon 9 mutations are shared immunogenic neoantigens in hematological malignancy. Oncoimmunology. 2017:e1358334. doi: 10.1080/2162402X.2017.1358334. [DOI] [PMC free article] [PubMed] [Google Scholar]
- 22.Keilholz U, Weber J, Finke JH, Gabrilovich DI, Kast WM, Disis ML, Kirkwood JM, Scheibenbogen C, Schlom J, Maino VC, et al. Immunologic monitoring of cancer vaccine therapy: results of a workshop sponsored by the Society for Biological Therapy. J Immunother. 2002;25(2):97–138. doi: 10.1097/00002371-200203000-00001. [DOI] [PubMed] [Google Scholar]
- 23.Gao B, Adhikari R, Howarth M, Nakamura K, Gold MC, Hill AB, Knee R, Michalak M, Elliott T. Assembly and antigen-presenting function of MHC class I molecules in cells lacking the ER chaperone calreticulin. Immunity. 2002;16(1):99–109. doi: 10.1016/S1074-7613(01)00260-6. [DOI] [PubMed] [Google Scholar]
- 24.Tefferi A, Lasho TL, Finke CM, Knudson RA, Ketterling R, Hanson CH, Maffioli M, Caramazza D, Passamonti F, Pardanani A. CALR vs JAK2 vs MPL-mutated or triple-negative myelofibrosis: clinical, cytogenetic and molecular comparisons. Leukemia. 2014. January;28(7):1472–1477. doi: 10.1038/leu.2014.3. [DOI] [PubMed] [Google Scholar]
- 25.Gabrilovich D, Nagaraj S. Myeloid-derived-suppressor cells as regulators of the immune system. Nat Rev Immunol. 2009;9(3):162–174. doi: 10.1038/nri2506. [DOI] [PMC free article] [PubMed] [Google Scholar]
- 26.Marty C, Lacout C, Droin N, Le Couédic J-P, Ribrag V, Solary E, Vainchenker W, Villeval J-L, Plo I. A role for reactive oxygen species in JAK2V617F myeloproliferative neoplasm progression. Leukemia. 2013;27(11):2187–2195. doi: 10.1038/leu.2013.102. [DOI] [PubMed] [Google Scholar]
Associated Data
This section collects any data citations, data availability statements, or supplementary materials included in this article.