

Abstract
Fabry disease is an X-linked lysosomal storage disorder caused by mutations in the GLA gene coding for α-galactosidase A (α-GalA). The deleterious mutations lead to accumulation of α-GalA substrates, including globotriaosylceramide (Gb3) and globotriaosylsphingosine. Progressive glycolipid storage results in cellular dysfunction, leading to organ damage and clinical disease, i.e. neuropathic pain, impaired renal function and cardiomyopathy. Many Fabry patients are treated by bi-weekly intravenous infusions of replacement enzyme. While the only available oral therapy is an α-GalA chaperone, which is indicated for a limited number of patients with specific ‘amenable’ mutations. Lucerastat is an orally bioavailable inhibitor of glucosylceramide synthase (GCS) that is in late stage clinical development for Fabry disease. Here we investigated the ability of lucerastat to lower Gb3, globotriaosylsphingosine and lysosomal staining in cultured fibroblasts from 15 different Fabry patients. Patients’ cells included 13 different pathogenic variants, with 13 cell lines harboring GLA mutations associated with the classic disease phenotype. Lucerastat dose dependently reduced Gb3 in all cell lines. For 13 cell lines the Gb3 data could be fit to an IC50 curve, giving a median IC50 [interquartile range (IQR)] = 11 μM (8.2–18); the median percent reduction (IQR) in Gb3 was 77% (70–83). Lucerastat treatment also dose dependently reduced LysoTracker Red staining of acidic compartments. Lucerastat’s effects in the cell lines were compared to those with current treatments—agalsidase alfa and migalastat. Consequently, the GCS inhibitor lucerastat provides a viable mechanism to reduce Gb3 accumulation and lysosome volume, suitable for all Fabry patients regardless of genotype.
Introduction
Fabry disease (OMIM #301500) is an inherited X-linked glycosphingolipid storage disorder caused by deleterious mutations in the GLA gene encoding the lysosomal enzyme α-galactosidaseA (α-GalA) (1). Fabry disease belongs to a group of more than 50 monogenic lysosomal storage disorders (LSDs), most of which are life threatening with multiple organ systems affected (2). In each LSD, aberrant mutations in a specific protein (most commonly hydrolytic enzymes) leads to discrete clinical phenotypes. The incidence of Fabry disease is estimated at 1:100 000, although it is probably underdiagnosed (3). Over 900 GLA variants have been associated with Fabry disease pathogenicity (4), with males more severely affected than females (1,3). The reduced α-GalA activity leads to accumulation of its substrates, globotriaosylceramide (Gb3) and other α-galactose linked neutral glycosphingolipids in many cell types, including podocytes and capillary endothelial cells (5). The accumulated lysosomal Gb3 can be converted to globotriaosylsphingosine (lysoGb3) (6), the plasma levels of which are a useful diagnostic marker, which also show some relationship to genotype and phenotype (7,8). Fabry patients suffer from a range of non-specific, severe symptoms, including neuropathic pain, progressive renal disease, cardiomyopathy, stroke and gastrointestinal problems (1,3,9). Symptoms can arise at any age, in multiple organs simultaneously, and result in reduced quality of life and life expectancy.
Many Fabry patients are treated with enzyme replacement therapy (ERT) (10) via bi-weekly infusions of one of two recombinant α-GalA preparations, agalsidase alfa or agalsidase beta. Only agalsidase beta is approved in the United States of America, with the approval based on reduction of Gb3 inclusions in kidney biopsies. Although some limited improvements in renal function, cardiac mass, cerebrovascular complications and quality of life have been reported (11,12) long-term benefit of ERT on risk of morbidity and mortality related to Fabry disease remain to be established (13,14). ERT reduces Gb3 in kidneys, heart and skin (15–18), and is particularly effective in clearing the lipid load from endothelial cells (19). However, distal tubular cells (15), smooth muscle (16) and the dorsal root ganglia (20) are more resistant to ERT (20,21). Unfortunately, the formation of neutralizing antibodies (22) is known to diminish the effectiveness of ERT (23–25).
Migalastat, an orally available pharmacological chaperone, is approved in the European Union and Japan for the treatment of some Fabry patients (26). Migalastat stabilizes mutated α-GalA protein forms by binding to the active site, enabling escape from proteasomal degradation and trafficking to the lysosome (27). Migalastat mediated α-GalA activation varies widely with genotype (28), with 268 pathogenic GLA variants classified as amenable to treatment.
While ERT and chaperone mechanisms aim to deliver functional enzyme to the lysosome, substrate reduction therapy (SRT) acts to decrease production of the defective enzyme's substrate before it accumulates, reducing synthesis to a level compatible with residual clearance (29). Small molecule SRT offers the benefits of an oral drug and has the potential to provide therapy for all Fabry patients independent of genotype. Two glucosylceramide synthase (GCS) inhibitor SRTs have been approved for treatment of the LSD Gaucher’s disease (30,31). Similarly, in Fabry mice, GCS inhibitors reduce tissue Gb3 by inhibiting production of the metabolic precursor glucosylceramide (GlcCer) (Fig. 1) (20,32,33). In Fabry mice, GCS inhibitors and ERT have complementary pharmacodynamic profiles, with GCS inhibitors more effectively clearing Gb3 from the kidneys (20,32). Additionally, GCS inhibitors and not ERT delayed loss of the thermal nociceptive response (20) and increased tetrahydrobiopterin, thereby reducing renal hypertrophy (33).
Figure 1.
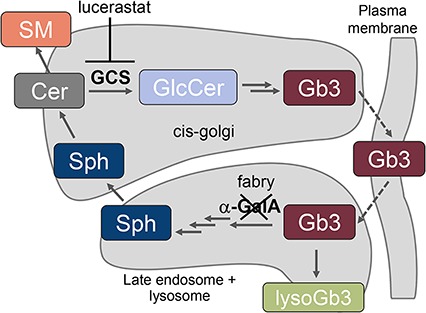
Key steps in the synthesis and degradation of Gb3. The scheme includes all sphingolipids quantified in this study. The α-GalA protein mutated in Fabry disease, and the GCS target of lucerastat are also depicted. LysoGb3 is only present at appreciable levels in the absence of α-GalA activity. α-GalA, α-galactosidaseA; Cer, ceramide; Gb3, globotriaosylceramide; GCS, glucosylceramide synthase; GlcCer, glucosylceramide; SM, sphingomyelin; Sph, sphingosine.
Lucerastat (N-butyldeoxygalactonojirimycin) an iminosugar inhibitor of GCS (34) reduced substrate load and improved survival and neuromotor function in a mouse model of the LSD Sandhoff disease (35,36). In Fabry mice null for α-GalA activity, lucerastat lowered renal Gb3 and α-galactose- terminated glycosphingolipids in the dorsal root ganglia (37). Further, oral lucerastat was well tolerated in healthy subjects dosed for 2 weeks with 1 g b.i.d. (38). Fabry patients who received oral lucerastat 1 g b.i.d. in addition to ERT for 3 months had reduced plasma GlcCer, lactosylceramide and Gb3 (39). An ongoing phase 3 clinical trial of lucerastat monotherapy (NCT03425539) is enrolling patients of all genotypes. Despite the success of SRT in Fabry mice, it has been suggested that the SRT mechanism will be reliant on the presence of residual enzyme activity (29).
Here we assessed the ability of lucerastat to lower the Gb3 and lysoGb3 lipid markers of Fabry disease, along with lysosomal staining, in cultured fibroblasts from Fabry patients with different genotypes, including many associated with low or absent residual α-GalA activity. The results were compared to the same cell lines treated with the ERT agalsidase alfa and the pharmacological chaperone migalastat. The study represents the first wide dose range comparison of molecules with three different modes of action in a relatively large set of Fabry patient fibroblasts.
Results
The 15 Fabry patient cell lines studied included 9 from male patients (Table 1). A total of 13 different Fabry pathogenic variants were covered: 5 missense mutations, 4 nonsense mutations, 3 small deletions and 1 small insertion. Of the cell lines, 13 have GLA mutations that are associated with the classic Fabry phenotype. Three of the cell lines harbor a GLA mutation expected to have significant residual α-GalA activity (>5%) and be amenable to treatment with the pharmacological chaperone migalastat (28). Notably, cell line W4 is a compound heterozygote, with the migalastat amenable N139S variant on one allele and the migalastat non-amenable W236C variant on the other, a situation for which chaperoning has not been studied.
Table 1.
Characteristics of the Fabry patients’ cell lines and their genotypes. Data throughout this manuscript is presented maintaining the order male, female, then within each sex, missense, nonsense and small deletions/insertions. Residual α-GalA activity values are from Benjamin et al. for constructs expressing mutated α-GalA in HEK cells (28). Benjamin et al. did not test nonsense and small deletion/insertion mutations, as they were predicted to result in negligible or no activity. W4 has one potentially pathogenic mutation on each X chromosome. GLA reference sequence NM_000169.2. NL, not listed; na, not applicable; BLD, below limit of detection; VUS, variant of unknown significance.
| Identifier | Donor sex (m/f) | HGMD accession | Mutation (DNA) | Mutation (protein) | Mutation type (dbFGP) | Likely phenotype listed in dbFGP | Residual activity (% wt) | Residual activity with 10 μM migalastat (% wt) |
|---|---|---|---|---|---|---|---|---|
| GM00882 | m | HM972098 | c.901C>G | R301G | missense | VUS | 19.1 | 64.7 |
| W15 | m | CM138947 | c.486G>T | W162C | missense | classic | 0.5 | BLD |
| W3 | m | CM930329 | c.679 C>T | R227X | nonsense | classic | NL | NL |
| GM00107 | m | CM993451 | c.485G>A | W162X | nonsense | classic | NL | NL |
| GM00881 | m | CM940860 | c.658C>T | R220X | nonsense | classic | NL | NL |
| GM02775 | m | CM940860 | c.658C>T | R220X | nonsense | classic | NL | NL |
| W10 | m | CD941691 | c.1208 del AAG | small deletion | classic | BLD | BLD | |
| W9 | m | CD023845 | c. 568 delG | A190Pfs*1 | small deletion | classic | NL | NL |
| W6 | m | CI138963 | c.993_994 ins A | fs X338 | small insertion | classic | NL | NL |
| W20 | f | CM972773 | c.427G>A | A143T | missense | benign | 21.4 | 43.8 |
| W14 | f | CM960769 | c.708G>C | W236C | missense | classic | BLD | BLD |
| W4 | f | Compound Heterozygote | ||||||
| CM103681 | c.416>G | N139S | missense | later onset | 65.5 | 79.1 | ||
| CM960769 | c.708G>C. | W236C | missense | classic | 0.5 | BLD | ||
| W12 | f | HM971748 | c.1069 C>T | Q357X | nonsense | classic | BLD | BLD |
| GM02771 | f | CM940860 | c.658C>T | R220X | nonsense | classic | NL | NL |
| W11 | f | CD085930 | c. 363 delT | A121fs*8 | small deletion | classic | NL | NL |
The relative sphingolipid levels and lysosomal staining was characterized in 12 of the cell lines, covering 12 different genotypes (Supplementary Fig. 1). Sphingolipid levels and lysosomal staining was assessed using LC-MS/MS and LysoTracker Red staining, respectively. The cells with the variants R301G and A143T, which were assigned as variant of unknown significance (VUS) and benign respectively in the International Fabry Disease Genotype-Phenotype database (dbFabry) had the lowest per cell levels of Gb3 and LysoTracker staining. Of the measured sphingolipids, levels of Gb3 isoforms, substrates of α-GalA, varied the most between cell lines. While, levels of sphingolipids, which are more remote from the mutated α-GalA enzyme, ie ceramide (Cer) and sphingomyelin (SM), were more similar between cell lines, with the exception of two cell lines with small deletions in the GLA gene (W10 and W11).
To assess treatment duration, GM00881 fibroblasts were incubated with lucerastat and agalsidase alfa for 3, 6, 11 and 21 days and LysoTracker staining was quantified. Agalsidase alfa reduced LysoTracker staining within 6 days (Supplementary Fig. 2). At 1 mM, lucerastat-mediated decrease of LysoTracker staining reached equivalent efficacy to agalsidase alfa after 11 days. At 50 μM, lucerastat yielded a reduction of LysoTracker staining of ∼50% when compared to agalsidase alfa.
To assess effects of the three mechanisms of action on different markers, the different cell lines were incubated with different concentrations of the GCS inhibitor lucerastat, the pharmacological chaperone migalastat and the ERT agalsidase alfa for a period of 9 days. As migalastat is an α-GalA inhibitor, it is necessary to perform a compound wash-out prior to read-out. A 2-day wash-out was employed for migalastat-treated cells as has been described to successfully promote migalastat-mediated chaperoning of α-GalA leading to Gb3 reduction in fibroblasts with the R301Q and L300P mutations (40). The dose ranges used in the cell culture experiments adequately covered clinical concentrations: clinically, lucerastat is dosed 1 g b.i.d. with plasma Cmax = 10.1 μg/ml (= 46 μM) and t1/2 = 5.4 h (39); agalsidase alfa is dosed by infusion of 0.2 mg/kg every other week, with a plasma t1/2 ∼ 60 min (41); migalastat is dosed 150 mg every other day, with plasma Cmax = 1630 ng/ml (= 10 μM) and t1/2 = 5.1 h (42).
Lucerastat dose dependently reduced the direct GCS product GlcCer in all cell lines with median IC50s [interquartile range (IQR)] of 19 μM (15–21) and 42 μM (31–51) for the (d18:1/16:0) and (d18:1/24:1) isoforms, respectively (Fig. 2 and Supplementary Table 2). The GCS substrate Cer was unaltered by lucerastat, while SM was in many cases dose-dependently increased (Supplementary Fig. 3), in-line with the metabolic shunt mechanism seen with GCS inhibitors, which is thought to act to prevent accumulation of toxic Cer (43). All six measured Gb3 isoforms were dose dependently reduced by lucerastat in all 15 cell lines (Fig. 3). In 13 cell lines the Gb3 data could be fit to an IC50 curve, giving a median IC50 (IQR) = 11 μM (8.2–18) for lucerastat lowering of Gb3 across all isoforms, with a median percent Gb3 reduction (IQR) of 77% (70–83) (Supplementary Tables 2 and 3). In the remaining two cell lines (GM00881 and GM02775), the dose response curves did not have plateaus. The IC50 and effect size parameters from the Gb3 curve fits did not show large differences based on isoform, with all 6 isoforms responding similarly in each cell line. The lysoGb3 signal was generally low; however, in some cell lines a lucerastat dose response for lowering was observed (Fig. 2). LysoTracker staining was dose-dependently decreased by lucerastat in most cell lines (Fig. 2). In 8/15 cell lines the LysoTracker dose response was of sufficient quality to fit to an IC50 curve giving a median IC50 (IQR) = 11 μM (3–17) and a median percent reduction (IQR) = 83% (74–87) for lucerastat (Supplementary Tables 2 and 3).
Figure 2.
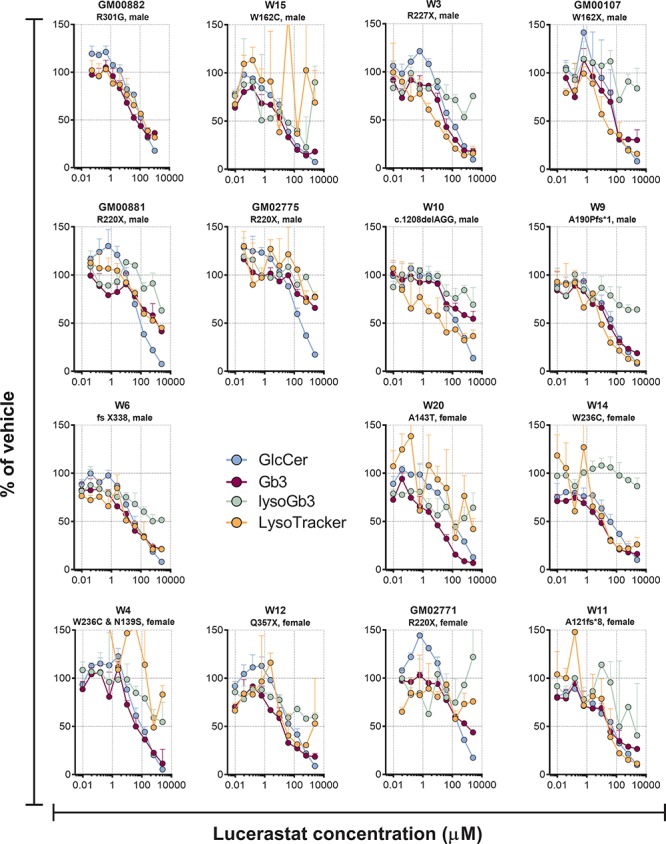
Effect of different concentrations of the GCS inhibitor lucerastat on GlcCer (d18:1/24:1), Gb3 (d18:1/24:0) and lysoGb3 lipid levels, along with LysoTracker staining in cultured Fabry patients’ fibroblasts after 9 days of treatment. Each point is the mean of duplicates (±SD).
Figure 3.
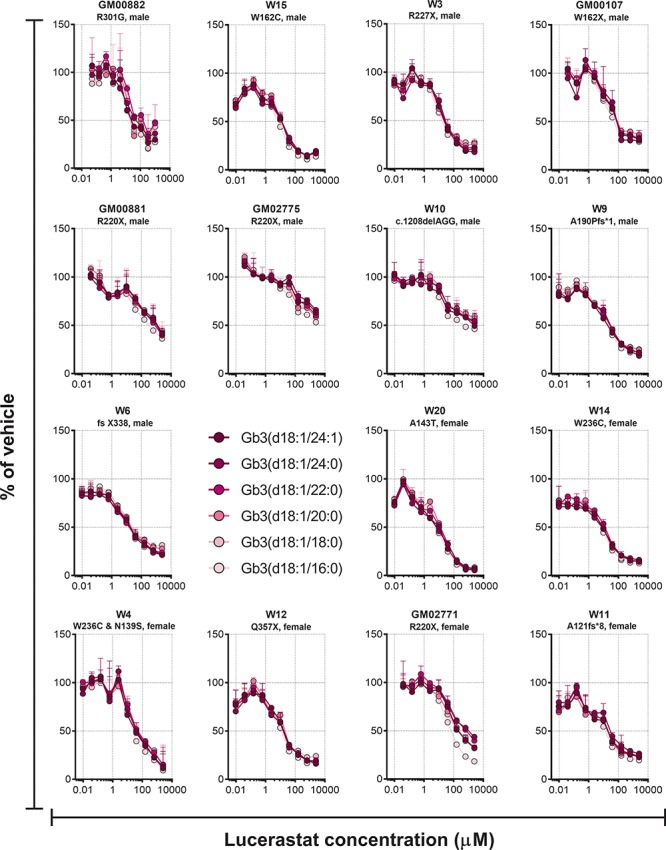
Effect of different concentrations of the GCS inhibitor lucerastat on Gb3 isoforms in cultured Fabry patients’ fibroblasts after 9 days of treatment. Each point is the mean of duplicates (±SD).
The ERT agalsidase alfa dose-dependently reduced Gb3, lysoGb3 and LysoTracker in the majority of the cell lines from Fabry patients (Fig. 4). For the 12 cell lines with evaluable Gb3 IC50 curves, agalsidase had a median IC50 (IQR) = 3.2 ng/ml (2.0–6.2), with a median percent reduction (IQR) of 61% (45–75) (Supplementary Tables 4 and 5). For the LysoTracker read-out, IC50 curves for 10 cell lines could be evaluated with median IC50 (IQR) = 2.0 ng/ml (1.2–3.8) and median percent reduction (IQR) of 93% (89–96). The Gb3 and lysoGb3 dose response curves were generally superimposed, while LysoTracker was often reduced to a greater extent (eg GM00107, W9, W6 and W11). The effects of agalsidase alfa on Gb3, lysoGb3 and LysoTracker were generally smaller in cells with GLA missense mutations than those with nonsense or small deletions. Similarly, in cultured cells from a subject without Fabry disease, agalsidase alfa had no effect on Gb3 (Supplementary Fig. 4). In some cell lines, a dose-dependent reduction in GlcCer was also observed with agalsidase alfa (Fig. 4).
Figure 4.
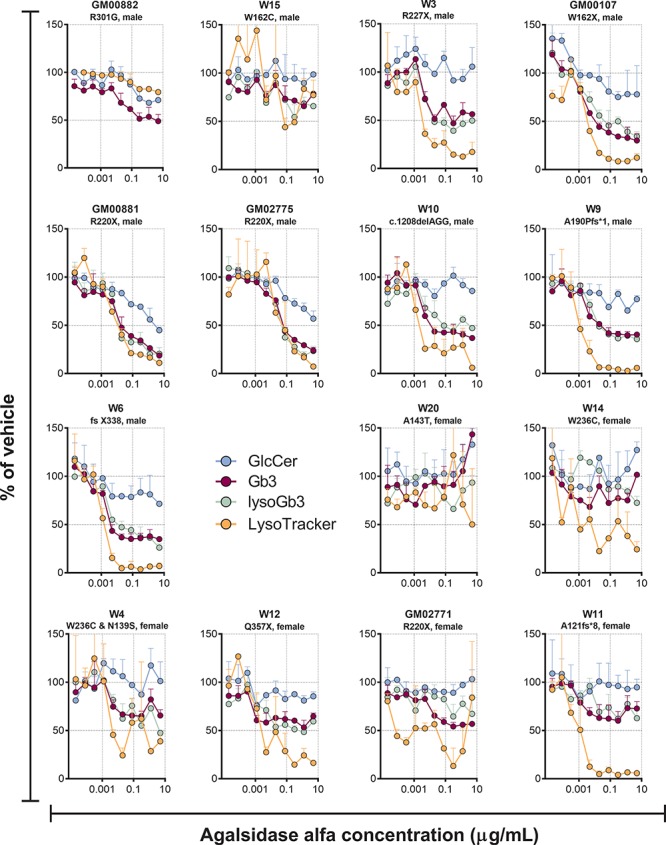
Effect of different concentrations of the ERT agalsidase alfa on GlcCer (d18:1/24:1), Gb3 (d18:1/24:0) and lysoGb3 lipid levels, along with LysoTracker staining in cultured Fabry patients’ fibroblasts after 9 days of treatment. Each point is the mean of duplicates (±SD).
The pharmacological chaperone migalastat did not lead to consistent dose responsive effects on the markers in the cell lines tested (Fig. 5).
Figure 5.
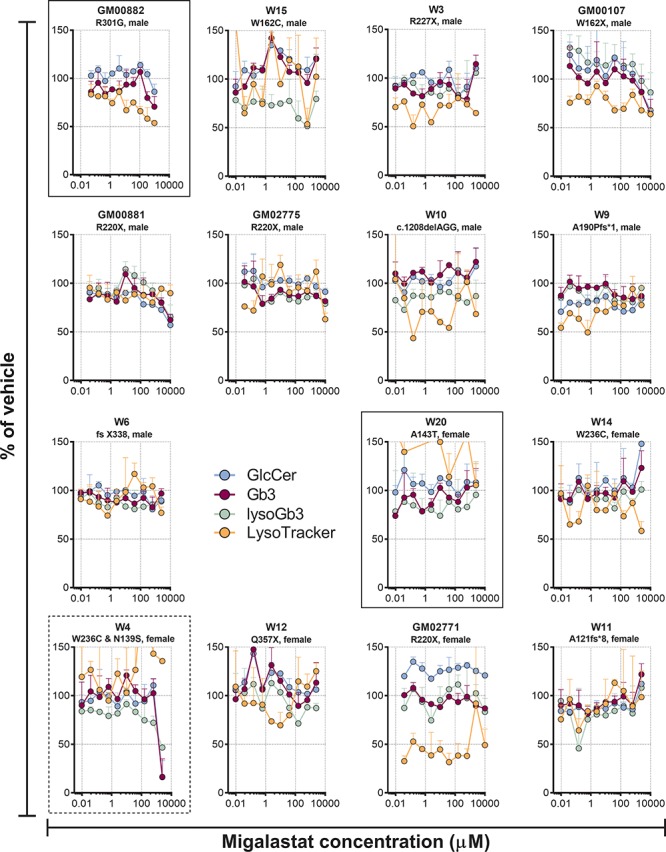
Effect of different concentrations of the pharmacological chaperone migalastat on GlcCer (d18:1/24:1), Gb3 (d18:1/24:0) and lysoGb3 lipid levels, along with LysoTracker staining in cultured Fabry patients’ fibroblasts after 9 days of treatment. Each point is the mean of duplicates (±SD). Cell lines with migalastat amenable mutations are in boxes with solid lines. Cell line W4, which is a compound heterozygote, with the migalastat amenable N139S variant on one allele and the migalastat non-amenable W236C variant on the other, a situation for which chaperoning has not been studied is in a box with dashed lines. The rest of the cell lines did not harbour mutated forms of α-GalA that are amenable to migalastat treatment.
Discussion
Here we show that GCS inhibition with lucerastat lowers the Fabry disease marker Gb3 in cultured fibroblasts from Fabry patients of both sexes harboring different GLA genotypes, including those with negligible α-GalA activity. Lucerastat also dose-dependently reduced the acidic compartment staining, a cellular phenotype associated with LSDs (44). The effectiveness of lucerastat observed here in Fabry patients’ fibroblasts, in Fabry patients (39), combined with studies of GCS inhibitors in mice null for α-GalA activity (20,32,33,37), suggests that the lucerastat SRT mode of action may be appropriate for all Fabry patients.
The presented data confirms and significantly expands on published work demonstrating that GCS inhibitors can reduce accumulated Gb3 in cultured cells derived from Fabry patients (33,45). In particular, Itier and colleagues have shown that GCS inhibitors can reduce accumulated Gb3, suggesting a role for clearance mechanisms other than α-GalA (45). Alternative molecular clearance mechanisms, which may come into play in situations of high local intracellular Gb3 levels, include removal of the α-galactose by α-N-acetylgalactosaminidase (46,47) or conversion of Gb3 to lysoGb3 by acid ceramidase (6). Overall, the GlcCer, Gb3 and LysoTracker curves overlapped for lucerastat, indicating that the reduction in acidic compartment volume is most likely a consequence of a reduction of glycosphingolipid levels resulting from GCS inhibition. In Fabry patients treated with 1 g b.i.d. of lucerastat, plasma Cmax was 10.1 μg/ml (= 46 μM) and t1/2 = 5.4 h (39). An exposure that resulted in a 49% and 55% reduction in plasma GlcCer and Gb3 respectively, in good agreement with the effect of lucerastat on GlcCer and Gb3 in the patients’ cells in the 10–40 μM concentration range. Although plasma lysoGb3 was not reduced in the Fabry patients receiving lucerastat for 3 months, the reduction in lysoGb3 seen here in patients’ fibroblasts, and the effect of other GCS inhibitors (20) in Fabry mice, suggests that lucerastat will also lower lysoGb3 in patients, given sufficient time. In several cell lines low concentrations of lucerastat resulted in increases in GlcCer, presumably as a result of the known inhibition of non-lysosomal glucosylceramidase (GBA2) by lucerastat (48). GBA2 inhibition has been shown to be beneficial in mouse models of the LSDs Gaucher disease, Niemann Pick disease type C and Sandhoff disease (49–51), it is, however, unknown if GBA2 inhibition would be beneficial in Fabry patients. The inhibition of GBA2 may also explain why the GlcCer curves, unlike those for Gb3, do not reach a plateau at high lucerastat concentrations.
The assessment of lucerastat was complemented and validated by comparison to the ERT agalsidase alfa. ERT generally had a smaller effect on Gb3 than lucerastat, this may be due to ERT only reducing lysosomal Gb3, while SRT reduces all Gb3. In a study of Fabry patient-derived microvascular endothelial cells ERT was found to reduce punctuate (presumably lysosomal) immunofluorescence staining of Gb3, while not effecting overall Gb3 levels (33). In the same study, a GCS inhibitor reduced all Gb3 staining and the total level. Here, the agalsidase alfa effects on Gb3, lysoGb3 and LysoTracker started at the same concentration in a given cell line, indicating that clearing the excess α-GalA substrate was sufficient to lower acidic compartment staining. Additionally, while the Gb3 lowering effect of agalsidase alfa was lower than that of lucerastat, its effect on LysoTracker and lysoGb3 was slightly larger in cells with nonsense and small deletions/insertions. The described difference may be a result of ERT acting directly on lysosomal lipids, including lysoGb3 (52), while lucerastat acts upstream, requiring more time to reach maximal effect, as observed here in the time course study and discussed elsewhere (39).
The pharmacological chaperone migalastat had only minor, if any effects in the three cell lines with migalastat amenable mutations. The cells with A143T and R301G had relatively high residual activity in the GLP-HEK assay (21.4% and 19.1%) (28), and agalsidase alfa had little effect on these cell lines, indicating that they probably had enough α-GalA activity to prevent relevant Gb3 accumulation. Notably, the pathogenicity of A143T is debated (53). While agalsidase alfa had a clearer effect on the cell line W4 with W236C and N139S mutations, the lack of migalastat effect may be ascribable to the small benefit seen in GLP-HEK assay for N139S (1.2-fold). Additionally, no efforts were made to optimize conditions for migalastat beyond the published protocol for migalastat chaperoning in Fabry patient fibroblasts (40).
Here we have studied the effects of Fabry treatments on patients’ fibroblasts in culture. An important caveat for the translatability of the study is the heterogeneity in rates of cellular turnover and division between the different cultures and the plethora of cell types in a Fabry disease afflicted organ. Additionally, the clinical dosing regimen of both migalastat and agalsidase alfa produce exposures that vary widely through each dosing cycle, which cannot be accurately simulated in cell culture experiments. The relatively high residual activity and/or sex of the migalastat amenable mutations available, likely contributed to the weak migalastat effects.
Lucerastat has a high volume of distribution, indicating that it may be able to reach tissues that ERT poorly penetrates. Further, studies in Fabry mice have shown that GCS inhibitors can bring reversal of disease phenotypes, which are not improved with ERT (20,33). The data described here supports the use of lucerastat in Fabry patients with different genotypes, suggesting that it could be the first oral therapy suitable for all Fabry patients irrespective of the underlying mutation. An ongoing Phase 3 clinical trial of lucerastat in Fabry patients will assess whether the presented results translate to reductions in Gb3 and ultimately in neuropathic pain.
Materials and Methods
Materials. Lucerastat was synthesized at Actelion Pharmaceuticals Ltd. (Allschwil, Switzerland). Agalsidase alfa was purchased from Shire. Migalastat was purchased from Sigma. Sphingolipid standards were from Matreya LLC (Gb3, lysoGb3, SM) and Avanti Polar lipids (Cer, GlcCer).
The following cell lines were obtained from the NIGMS Human Genetic Cell Repository at the Coriell Institute for Medical Research: GM00881, GM00882, GM02771, GM02775, GM00107 and GM05756, with all work being performed as outlined in a research plan, which was incorporated in the material transfer agreement. The cell lines W15, W3, W10, W9, W6, W20, W14, W4, W12 and W11 were from diagnostic skin punch biopsies at the Department of Neurology, University of Würzburg (Germany). The cell lines were utilized in an anonymized manner. All patients gave written informed consent after receiving oral and written information about the planned use (as recommended by the ethics committee of the University of Würzburg Medical Faculty). The characteristics of the cells lines and their genotypes are described in Table 1. Data on mutations was assembled from dbFGP (http://www.dbfgp.org/dbFgp/fabry/FabryGP.html), the Human gene mutation database (HGMD® Professional) from Qiagen (4) and literature sources (28). The X-chromosome inactivation of the female cell lines was not investigated.
Cell culture. Compounds were diluted in HBSS + 20 mM HEPES at pH 7.4 at the concentration of 1 M (lucerastat and migalastat). Cells were grown to around 80% confluence in a 75 cm2 flask in Minimal Essential Medium (MEM) supplemented with 10% Foetal Bovine Serum (FBS), in the presence of 100 U/ml of penicillin and 100 μg/ml of streptomycin (hereafter called ‘medium’) at 37°C and 5% CO2. One day before the assay, cells were harvested by trypsinisation, counted and plated in 96-well microtiter plates (black, clear-bottomed) at a density of approximately 1000 cells/well in 100 μl/well. Each plate contained 10 concentrations of each drug in duplicate, 8 wells of untreated control and 8 wells of vehicle. Duplicate plates were performed for each cell line, one for image analysis and one for sphingolipid quantification. The following day, 50 μl of 3-fold concentrated dilution series (steps of 4-fold dilution) of test compounds was added to the cells and they were incubated for 5 days. Medium was then replaced with the same volume of freshly prepared compound or agalsidase alfa-containing medium, and the treatment was continued for another 4 days, except for migalastat, which was washed out for the final 2 days. After the treatment period, for the sphingolipid analysis plate compound-containing medium was removed and cells were washed two times with an excess of phosphate-buffered saline (PBS). Remaining buffer was completely aspirated and plates were stored at −20°C.
Cell staining, image acquisition and analysis. At the end of the treatment period, compound-containing medium was replaced with freshly prepared medium containing 200 nM LysoTracker™ Red DND-99 (ThermoFisher Scientific) and cells were incubated for 90 min at 37°C and 5% CO2, then formalin-fixed for 10 min, washed with PBS and nuclei were stained with Hoechst 33342 for 30 min in the dark. Finally, cells were washed three times with PBS before image acquisition. Images were acquired at nine different positions within each well of 96-well microtiter plates, using ImageXpress Micro XLS (Molecular Device) high-content analysis device (objective 10×; exposure times for Texas red channel, 150 ms; DAPI channel, 50 ms). The fluorescence of each image was analyzed using MetaXpress software (Molecular Device). The fluorescence intensities for LysoTracker (TexasRed) were normalized to the number of cells as defined by the ‘Cell: vesicle integrated intensity (Transfluor)’ parameter of the ‘Transfluor’ module.
Sphingolipid quantification. Washed plates were removed from the −20°C freezer and sphingolipids extracted by adding 100 μl of methanol containing 100 nM internal standard [(13C2,D2) Cer (d18:1/18:0)] to each well of the 96-well plate. The plate was gently shaken for 5 min, centrifuged and 90 μl of the supernatant were transferred to a fresh plate. After the plate was sealed the samples were injected into the LC-MS/MS system. Re-extracting with a second methanol aliquot recovered <5% of the first extraction. For all analyses, calibrants were made in methanol containing 100 nM internal standards. Quality control (QC) samples were prepared from a pool of the cell extracts. For each analysis, the QC pool was run in triplicate as prepared, 3-fold and 10-fold diluted with methanol containing internal standard. Calculated inter-batch precision and accuracy for the QC samples are given in Supplementary Table 1. The injection order of all calibrants, QC and study samples was randomized.
Sphingolipids were quantified using liquid chromatography coupled with tandem mass spectrometry (LC-MS/MS) on an ABSCIEX 6500QTRAP with a Dionex Ultimate 3000 HPLC system. For the LC, an ACQUITY UPLC CSH column (C18, 2.1 × 100 mm, 1.7 μm) with buffer A (acetonitrile:water (60:40), 10 mM ammonium formate and 0.1% formic acid) and buffer B (isopropanol:acetonitrile:water (90:9:1) with 10 mM ammonium formate and 0.1% formic acid) running at 0.4 ml/min, a column temperature of 55°C was used. A multi-step gradient was used running from 50% to 60% of buffer B over the first 4.5 min, then from 60% to 85% of buffer B over 4.5–9.0 min, followed by re-equilibration. The following source parameters were used: curtain gas (20), collision gas (medium) Q1 and Q3 resolution (unit), ion spray voltage (5500V), temperature (500°C), gas1 (50) and gas2 (15). Other parameters (EP, DP, CE and CXP) were optimized per transition using standard procedures. Each sphingolipid was quantified with the following different lipidic chain compositions: d18:1/16:0 and d18:1/24:1 for Cer and GlcCer; d18:1/16:0, d18:1/18:0 and d18:1/24:1 for SM; d18:1/16:0, d18:1/18:0, d18:1/20:0, d18:1/22:0, d18:1/24:0 and d18:1/24:1 for Gb3; d18:1/0:0 for lysoGb3. As SM concentration is higher than the rest of the analytes, it was quantified using the [M+1] molecular ion in Q1 and Q3 to reduce signal intensity. Transitions (only d18:1/16:0 isoforms as example per lipid class, except lysoGb3) monitored (Q1/Q3) were the following: Cer (538.4/264.2), GlcCer (700.5/264.2), SM (704.5/185.1), Gb3 (1024.5/520.5) and lysoGb3 (d18:1/0:0), (786.1/282.2). The acquisition was performed in scheduled Multiple Reaction Monitoring (MRM) mode with a cycle time of 0.5 s. LC-MS/MS data was processed using Multiquant™ 3.0.1.
The Cer and GlcCer chromatographic peaks were assigned using synthetic commercial standards. The Gb3 standard could be used to assign all isoforms as it was purified from a natural source and contained a mixture of isoforms. For SM (d18:1/16:0) and SM (d18:1/24:1) peaks were assigned using the retention time of the SM (d18:1/18:0) standard as a reference, considering that the elution time is mainly influenced by the N-acyl chain length. The analytical method used does not differentiate between GlcCer and GalCer. However, the peak was assigned as GlcCer, as using a Hydrophilic Interaction Liquid Chromatography (HILIC) method (54), fibroblasts were found to contain ∼20-fold more GlcCer than GalCer.
Data analysis. Further data processing was performed with Microsoft Excel®. Graphs were made with Graphpad Prism® 6.0. Data was expressed as a percent of the average value in the 8 wells with vehicle. The potency of lucerastat and agalsidase alfa on various read-outs was determined using proprietary software (IC50Studio, Idorsia Pharmaceuticals). A 4-parameter fit was used for the IC50 calculation with a variable slope, and the top and bottom plateaus were constrained to the extreme values (average of duplicate measurements). The percent reduction was calculated as [(top plateau)-(bottom plateau)]/(top plateau).
Supplementary Material
Acknowledgements
The authors thank Daniela Urlaub (Department of Neurology, University of Würzburg, Germany) for her expert technical assistance and Rene Roscher (Idorsia Pharmaceuticals) for careful proof reading of the manuscript.
Conflict of Interest statement. R.W., A.M., M.G., O.M., P.G. and M.P. are employees of Idorsia Pharmaceuticals, which is developing lucerastat as a treatment for Fabry disease. N.U. received travel and research grants from Sanofi Genzyme and Shire Corp., which were independent of the work presented here. V.R. declares no conflicts of interest.
Author contributions
Designed research: R.W., A.M., M.P.; generation and analysis of data: A.M., M.G., R.W.; provision and collection of new biological materials: V.R., N.U.; interpretation of data: R.W., A.M., M.G., P.G., O.M., M.P.; wrote the manuscript: R.W.; reviewed the manuscript: A.M., M.G., P.G., O.M., N.U., M.P.
Funding
Idorsia Pharmaceuticals.
References
- 1. Germain D.P. (2010) Fabry disease. Orphanet J. Rare Dis., 5, 30. [DOI] [PMC free article] [PubMed] [Google Scholar]
- 2. Boustany R.M. (2013) Lysosomal storage diseases–the horizon expands. Nat. Rev. Neurol., 9, 583–598. [DOI] [PubMed] [Google Scholar]
- 3. Schiffmann R. (2015) Fabry disease. Handb. Clin. Neurol., 132, 231–248. [DOI] [PubMed] [Google Scholar]
- 4. Stenson P.D., Mort M., Ball E.V., Howells K., Phillips A.D., Thomas N.S. and Cooper D.N. (2009) The Human Gene Mutation Database: 2008 update. Genome Med., 1, 13. [DOI] [PMC free article] [PubMed] [Google Scholar]
- 5. Elleder M. (2003) Sequelae of storage in Fabry disease–pathology and comparison with other lysosomal storage diseases. Acta Paediatr. Suppl., 92, 46–53; discussion 45. [DOI] [PubMed] [Google Scholar]
- 6. Ferraz M.J., Marques A.R., Appelman M.D., Verhoek M., Strijland A., Mirzaian M., Scheij S., Ouairy C.M., Lahav D. and Wisse P. et al. (2016) Lysosomal glycosphingolipid catabolism by acid ceramidase: formation of glycosphingoid bases during deficiency of glycosidases. FEBS Lett., 590, 716–725. [DOI] [PubMed] [Google Scholar]
- 7. Nowak A., Mechtler T.P., Hornemann T., Gawinecka J., Theswet E., Hilz M.J. and Kasper D.C. (2018) Genotype, phenotype and disease severity reflected by serum LysoGb3 levels in patients with Fabry disease. Mol. Genet. Metab., 123, 148–153. [DOI] [PubMed] [Google Scholar]
- 8. Smid B.E., Tol L., Biegstraaten M., Linthorst G.E., Hollak C.E. and Poorthuis B.J. (2015) Plasma globotriaosylsphingosine in relation to phenotypes of Fabry disease. J. Med. Genet., 52, 262–268. [DOI] [PubMed] [Google Scholar]
- 9. Schiffmann R. and Ries M. (2016) Fabry disease: a disorder of childhood onset. Pediatr. Neurol., 64, 10–20. [DOI] [PubMed] [Google Scholar]
- 10. Pisani A., Visciano B., Roux G.D., Sabbatini M., Porto C., Parenti G. and Imbriaco M. (2012) Enzyme replacement therapy in patients with Fabry disease: state of the art and review of the literature. Mol. Genet. Metab., 107, 267–275. [DOI] [PubMed] [Google Scholar]
- 11. Mehta A., Beck M., Elliott P., Giugliani R., Linhart A., Sunder-Plassmann G., Schiffmann R., Barbey F., Ries M. and Clarke J.T. et al. (2009) Enzyme replacement therapy with agalsidase alfa in patients with Fabry's disease: an analysis of registry data. Lancet, 374, 1986–1996. [DOI] [PubMed] [Google Scholar]
- 12. Beck M., Hughes D., Kampmann C., Larroque S., Mehta A., Pintos-Morell G., Ramaswami U., West M., Wijatyk A. and Giugliani R. et al. (2015) Long-term effectiveness of agalsidase alfa enzyme replacement in Fabry disease: a Fabry Outcome Survey analysis. Mol. Genet. Metab. Rep., 3, 21–27. [DOI] [PMC free article] [PubMed] [Google Scholar]
- 13. Mehta A.B. (2009) Anderson-Fabry disease: developments in diagnosis and treatment. Int. J. Clin. Pharmacol. Ther., 47 (Suppl 1), S66–74. [DOI] [PubMed] [Google Scholar]
- 14. Weidemann F., Niemann M., Stork S., Breunig F., Beer M., Sommer C., Herrmann S., Ertl G. and Wanner C. (2013) Long-term outcome of enzyme-replacement therapy in advanced Fabry disease: evidence for disease progression towards serious complications. J. Intern. Med., 274, 331–341. [DOI] [PMC free article] [PubMed] [Google Scholar]
- 15. Thurberg B.L., Rennke H., Colvin R.B., Dikman S., Gordon R.E., Collins A.B., Desnick R.J. and O'Callaghan M. (2002) Globotriaosylceramide accumulation in the Fabry kidney is cleared from multiple cell types after enzyme replacement therapy. Kidney Int., 62, 1933–1946. [DOI] [PubMed] [Google Scholar]
- 16. Germain D.P., Waldek S., Banikazemi M., Bushinsky D.A., Charrow J., Desnick R.J., Lee P., Loew T., Vedder A.C. and Abichandani R. et al. (2007) Sustained, long-term renal stabilization after 54 months of agalsidase beta therapy in patients with Fabry disease. J. Am. Soc. Nephrol., 18, 1547–1557. [DOI] [PubMed] [Google Scholar]
- 17. Najafian B., Tondel C., Svarstad E., Sokolovkiy A., Smith K. and Mauer M. (2016) One year of enzyme replacement therapy reduces globotriaosylceramide inclusions in podocytes in male adult patients with Fabry disease. PLoS One, 11, e0152812. [DOI] [PMC free article] [PubMed] [Google Scholar]
- 18. Thurberg B.L., Randolph Byers H., Granter S.R., Phelps R.G., Gordon R.E. and O'Callaghan M., (2004) Monitoring the 3-year efficacy of enzyme replacement therapy in fabry disease by repeated skin biopsies. J. Invest. Dermatol., 122, 900–908. [DOI] [PubMed] [Google Scholar]
- 19. Eng C.M., Banikazemi M., Gordon R.E., Goldman M., Phelps R., Kim L., Gass A., Winston J., Dikman S. and Fallon J.T. et al. (2001) A phase 1/2 clinical trial of enzyme replacement in fabry disease: pharmacokinetic, substrate clearance, and safety studies. Am. J. Hum. Genet., 68, 711–722. [DOI] [PMC free article] [PubMed] [Google Scholar]
- 20. Ashe K.M., Budman E., Bangari D.S., Siegel C.S., Nietupski J.B., Wang B., Desnick R.J., Scheule R.K., Leonard J.P. and Cheng S.H. et al. (2015) Efficacy of enzyme and substrate reduction therapy with a novel antagonist of glucosylceramide synthase for Fabry disease. Mol. Med., 21, 389–399. [DOI] [PMC free article] [PubMed] [Google Scholar]
- 21. Sakuraba H., Chiba Y., Kotani M. , Kawashima I., Ohsawa M., Tajima Y., Takaoka Y., Jigami Y., Takahashi H. and Hirai Y. et al. (2006) Corrective effect on Fabry mice of yeast recombinant human alpha-galactosidase with N-linked sugar chains suitable for lysosomal delivery. J. Hum. Genet., 51, 341–352. [DOI] [PubMed] [Google Scholar]
- 22. Linthorst G.E., Hollak C.E., Donker-Koopman W.E., Strijland A. and Aerts J.M. (2004) Enzyme therapy for Fabry disease: neutralizing antibodies toward agalsidase alpha and beta. Kidney Int., 66, 1589–1595. [DOI] [PubMed] [Google Scholar]
- 23. Hollak C.E. and Linthorst G.E. (2009) Immune response to enzyme replacement therapy in Fabry disease: impact on clinical outcome? Mol. Genet. Metab., 96, 1–3. [DOI] [PubMed] [Google Scholar]
- 24. Lenders M., Stypmann J., Duning T., Schmitz B., Brand S.M. and Brand E. (2016) Serum-mediated nhibition of enzyme replacement therapy in Fabry disease. J. Am. Soc. Nephrol., 27, 256–264. [DOI] [PMC free article] [PubMed] [Google Scholar]
- 25. Rombach S.M., Aerts J.M., Poorthuis B.J., Groener J.E., Donker-Koopman W., Hendriks E., Mirzaian M., Kuiper S., Wijburg F.A. and Hollak C.E. et al. (2012) Long-term effect of antibodies against infused alpha-galactosidase A in Fabry disease on plasma and urinary (lyso)Gb3 reduction and treatment outcome. PLoS One, 7, e47805. [DOI] [PMC free article] [PubMed] [Google Scholar]
- 26. Germain D.P., Hughes D.A., Nicholls K., Bichet D.G., Giugliani R., Wilcox W.R., Feliciani C., Shankar S.P., Ezgu F. and Amartino H. et al. (2016) Treatment of Fabry's disease with the pharmacologic chaperone migalastat. N. Engl. J. Med., 375, 545–555. [DOI] [PubMed] [Google Scholar]
- 27. Germain D.P. and Fan J.Q. (2009) Pharmacological chaperone therapy by active-site-specific chaperones in Fabry disease: in vitro and preclinical studies. Int. J. Clin. Pharmacol. Ther., 47(Suppl 1), S111–117. [PubMed] [Google Scholar]
- 28. Benjamin E.R., Della Valle M.C., Wu X., Katz E., Pruthi F., Bond S., Bronfin B., Williams H., Yu J. and Bichet D.G. et al. (2017) The validation of pharmacogenetics for the identification of Fabry patients to be treated with migalastat. Genet. Med., 19, 430–438. [DOI] [PMC free article] [PubMed] [Google Scholar]
- 29. Platt F.M. (2018) Emptying the stores: lysosomal diseases and therapeutic strategies. Nat. Rev. Drug Discov., 17, 133–150. [DOI] [PubMed] [Google Scholar]
- 30. Lachmann R.H. (2006) Miglustat: substrate reduction therapy for glycosphingolipid lysosomal storage disorders. Drugs Today (Barc), 42, 29–38. [DOI] [PubMed] [Google Scholar]
- 31. Sechi A., Dardis A. and Bembi B. (2016) Profile of eliglustat tartrate in the management of Gaucher disease. Ther. Clin. Risk Manag., 12, 53–58. [DOI] [PMC free article] [PubMed] [Google Scholar]
- 32. Marshall J., Ashe K.M., Bangari D., McEachern K., Chuang W.L., Pacheco J., Copeland D.P., Desnick R.J., Shayman J.A., and Scheule R.K. et al. (2010) Substrate reduction augments the efficacy of enzyme therapy in a mouse model of Fabry disease. PLoS One, 5, e15033. [DOI] [PMC free article] [PubMed] [Google Scholar]
- 33. Shen J.S., Arning E., West M.L., Day T.S., Chen S., Meng X.L., Forni S., McNeill N., Goker-Alpan O. and Wang X. et al. (2017) Tetrahydrobiopterin deficiency in the pathogenesis of Fabry disease. Hum. Mol. Genet., 26, 1182–1192. [DOI] [PubMed] [Google Scholar]
- 34. Butters T.D.,van den Broek L.A.G.M., Fleet G.W.J., Krullec T.M., Wormald M.R., Dwek R.A. and Platt F.M. (2000) Molecular requirement of iminosugars for the selective control of N-linked glycosylation and glycosphingoplipid biosynthesis. Tetrahedron: Asymmetry 11, 113–124. [Google Scholar]
- 35. Andersson U., Smith D., Jeyakumar M., Butters T.D., Borja M.C., Dwek R.A. and Platt F.M. (2004) Improved outcome of N-butyldeoxygalactonojirimycin-mediated substrate reduction therapy in a mouse model of Sandhoff disease. Neurobiol. Dis., 16, 506–515. [DOI] [PubMed] [Google Scholar]
- 36. Baek R.C., Kasperzyk J.L., Platt F.M. and Seyfried T.N. (2008) N-butyldeoxygalactonojirimycin reduces brain ganglioside and GM2 content in neonatal Sandhoff disease mice. Neurochem. Int., 52, 1125–1133. [DOI] [PubMed] [Google Scholar]
- 37. Welford R.W.D., Mühlemann A., Priestman D., Garzotti M., Deymier C., Ertel E.A., Iglarz M., Baldoni D., Platt F.M. and Probst M.R. (2016) Lucerastat, an iminosugar for substrate reduction therapy in Fabry disease: preclinical evidence. Mol. Genet. Metab., 120, S139–S140. [Google Scholar]
- 38. Guerard N., Morand O. and Dingemanse J. (2017) Lucerastat, an iminosugar with potential as substrate reduction therapy for glycolipid storage disorders: safety, tolerability, and pharmacokinetics in healthy subjects. Orphanet J. Rare Dis., 12, 9. [DOI] [PMC free article] [PubMed] [Google Scholar]
- 39. Guerard N., Oder D., Nordbeck P., Zwingelstein C., Morand O., Welford R.W., Dingemanse J. and Wanner C. (2018) Lucerastat, an iminosugar for substrate reduction therapy: tolerability, pharmacodynamics, and pharmacokinetics in patients with Fabry disease on enzyme replacement. Clin. Pharmacol. Ther., 103, 703–711. [DOI] [PubMed] [Google Scholar]
- 40. Benjamin E.R., Flanagan J.J., Schilling A., Chang H.H., Agarwal L., Katz E., Wu X., Pine C., Wustman B., Desnick R.J. et al. (2009) The pharmacological chaperone 1-deoxygalactonojirimycin increases alpha-galactosidase A levels in Fabry patient cell lines. J. Inherit. Metab. Dis., 32, 424–440. [DOI] [PubMed] [Google Scholar]
- 41. Clarke J.T., West M.L., Bultas J. and Schiffmann R. (2007) The pharmacology of multiple regimens of agalsidase alfa enzyme replacement therapy for Fabry disease. Genet. Med., 9, 504–509. [DOI] [PubMed] [Google Scholar]
- 42. Warnock D.G., Bichet D.G., Holida M., Goker-Alpan O., Nicholls K., Thomas M., Eyskens F., Shankar S., Adera M. and Sitaraman S. et al. (2015) Oral migalastat HCl leads to greater systemic exposure and tissue levels of active alpha-galactosidase A in Fabry patients when co-administered with infused agalsidase. PLoS One, 10, e0134341. [DOI] [PMC free article] [PubMed] [Google Scholar]
- 43. Kasperzyk J.L., d'Azzo A., Platt F.M., Alroy J. and Seyfried T.N. (2005) Substrate reduction reduces gangliosides in postnatal cerebrum-brainstem and cerebellum in GM1 gangliosidosis mice. J. Lipid Res., 46, 744–751. [DOI] [PubMed] [Google Scholar]
- 44. Xu M., Liu K., Swaroop M., Sun W., Dehdashti S.J., McKew J.C. and Zheng W. (2014) A phenotypic compound screening assay for lysosomal storage diseases. J. Biomol. Screen., 19, 168–175. [DOI] [PMC free article] [PubMed] [Google Scholar]
- 45. Itier J.M., Ret G., Viale S., Sweet L., Bangari D., Caron A., Le-Gall F., Benichou B., Leonard J. and Deleuze J.F. et al. (2014) Effective clearance of GL-3 in a human iPSC-derived cardiomyocyte model of Fabry disease. J. Inherit. Metab. Dis., 37, 1013–1022. [DOI] [PubMed] [Google Scholar]
- 46. Asfaw B., Ledvinova J., Dobrovolny R., Bakker H.D., Desnick R.J., van Diggelen O.P., de Jong J.G., Kanzaki T., Chabas A. and Maire I. et al. (2002) Defects in degradation of blood group A and B glycosphingolipids in Schindler and Fabry diseases. J. Lipid Res., 43, 1096–1104. [DOI] [PubMed] [Google Scholar]
- 47. Dean K.J. and Sweeley C.C. (1979) Studies on human liver alpha-galactosidases. II. Purification and enzymatic properties of alpha-galactosidase B (alpha-N-acetylgalactosaminidase). J. Biol. Chem., 254, 10001–10005. [PubMed] [Google Scholar]
- 48. Ridley C.M., Thur K.E., Shanahan J., Thillaiappan N.B., Shen A., Uhl K., Walden C.M., Rahim A.A., Waddington S.N. and Platt F.M. et al. (2013) beta-Glucosidase 2 (GBA2) activity and imino sugar pharmacology. J. Biol. Chem., 288, 26052–26066. [DOI] [PMC free article] [PubMed] [Google Scholar]
- 49. Marques A.R., Aten J., Ottenhoff R., Roomen C.P., Herrera Moro D., Claessen N., Vinueza Veloz M.F., Zhou K., Lin Z., Mirzaian M. et al. (2015) Reducing GBA2 activity ameliorates neuropathology in Niemann-Pick type C mice. PLoS One, 10, e0135889. [DOI] [PMC free article] [PubMed] [Google Scholar]
- 50. Mistry P.K., Liu J., Sun L., Chuang W.L., Yuen T., Yang R., Lu P., Zhang K., Li J. and Keutzer J. et al. (2014) Glucocerebrosidase 2 gene deletion rescues type 1 Gaucher disease. Proc. Natl. Acad. Sci. U S A, 111, 4934–4939. [DOI] [PMC free article] [PubMed] [Google Scholar]
- 51. Ashe K.M., Bangari D., Li L., Cabrera-Salazar M.A., Bercury S.D., Nietupski J.B., Cooper C.G., Aerts J.M., Lee E.R. and Copeland D.P. et al. (2011) Iminosugar-based inhibitors of glucosylceramide synthase increase brain glycosphingolipids and survival in a mouse model of Sandhoff disease. PLoS One, 6, e21758. [DOI] [PMC free article] [PubMed] [Google Scholar]
- 52. Kytidou K., Beenakker T.J.M., Westerhof L.B., Hokke C.H., Moolenaar G.F., Goosen N., Mirzaian M., Ferraz M.J., de Geus M. and Kallemeijn W.W. et al. (2017) Human alpha galactosidases transiently produced in nicotiana benthamiana leaves: new insights in substrate specificities with relevance for Fabry disease. Front Plant Sci., 8, 1026. [DOI] [PMC free article] [PubMed] [Google Scholar]
- 53. Lenders M., Weidemann F., Kurschat C., Canaan-Kuhl S., Duning T., Stypmann J., Schmitz B., Reiermann S., Kramer J., Blaschke D. et al. (2016) Alpha-galactosidase A p.A143T, a non-Fabry disease-causing variant. Orphanet J. Rare Dis., 11, 54. [DOI] [PMC free article] [PubMed] [Google Scholar]
- 54. Hamler R., Brignol N., Clark S.W., Morrison S., Dungan L.B., Chang H.H., Khanna R., Frascella M., Valenzano K.J. and Benjamin E.R. et al. (2017) Glucosylceramide and glucosylsphingosine quantitation by liquid chromatography-tandem mass spectrometry to enable in vivo preclinical studies of neuronopathic Gaucher disease. Anal. Chem., 89, 8288–8295. [DOI] [PubMed] [Google Scholar]
Associated Data
This section collects any data citations, data availability statements, or supplementary materials included in this article.