

ABSTRACT
Epigenetic mechanisms of gene regulation, including DNA methylation and histone modifications, call increasing attention in the context of development and human health. Thereby, interactions between DNA methylating enzymes and histone modifications tremendously multiply the spectrum of potential regulatory functions. Epigenetic networks are critically involved in the establishment and functionality of neuronal circuits that are composed of gamma-aminobutyric acid (GABA)-positive inhibitory interneurons and excitatory principal neurons in the cerebral cortex. We recently reported a crucial role of the DNA methyltransferase 1 (DNMT1) during the migration of immature POA-derived cortical interneurons by promoting the migratory morphology through repression of Pak6. However, the DNMT1-dependent regulation of Pak6 expression appeared to occur independently of direct DNA methylation. Here, we show that in addition to its DNA methylating activity, DNMT1 can act on gene transcription by modulating permissive H3K4 and repressive H3K27 trimethylation in developing inhibitory interneurons, similar to what was found in other cell types. In particular, the transcriptional control of Pak6, interactions of DNMT1 with the Polycomb-repressor complex 2 (PCR2) core enzyme EZH2, mediating repressive H3K27 trimethylations at regulatory regions of the Pak6 gene locus. Similar to what was observed upon Dnmt1 depletion, inhibition of EZH2 caused elevated Pak6 expression levels accompanied by increased morphological complexity, which was rescued by siRNA-mediated downregulation of Pak6 expression. Together, our data emphasise the relevance of DNMT1-dependent crosstalk with histone tail methylation for transcriptional control of genes like Pak6 required for proper cortical interneuron migration.
KEYWORDS: Interneurons, H3K27me3, DNMT1, EZH2, morphology, PAK6
Introduction
The precise balance between excitation and inhibition is crucial for neuronal information processing in the cerebral cortex [1–4], whereby the inhibitory actions of cortical GABAergic interneurons shape and synchronize the responses of excitatory projection neurons [5,6]. Due to their relevance for, circuits, defects in inhibitory interneuron development and function are associated with various neuropsychiatric diseases [4,7–16]. Hence, revealing key regulators that orchestrate cortical interneuron development is crucial to reveal critical events that lead to cortical dysfunction.
Brain development is a complex process through which immature cortical GABAergic interneurons undergo a prolonged period of post-mitotic differentiation and maturation [5,6,17–21]. The long-range tangential migration from their subpallial sites of origin, including the medial and caudal ganglionic eminences as well as the preoptic area (POA) [22–30], into cortical areas represents a critical developmental step. Proper migration relies on the adaption and preservation of a typical migratory morphology capable for directional adjustments induced by extrinsic cues, as well as the maintenance of their viability [29,31–39]. The orchestration of the underlying complex and dynamic subcellular processes requires flexible gene regulation [40–42].
Epigenetic mechanisms like DNA methylation and histone tail modifications provide in part higher ordered regulatory features allowing for adaptive gene expression modifying developmental programs in response to external stimuli [40–45]. In addition to cytosine methylation in dividing progenitors, the DNA methylation-dependent and independent functions of the DNA methyltransferase 1 (DNMT1) seem to regulate transcription in developing as well as adult neurons [29,43,44,46].
In this context, we previously reported in Pensold et al. (2016) [29] that DNMT1 promotes the migration and survival of Hmx3-expressing cortical interneurons generated in the preoptic area (POA) by repressing Pak6 expression, coding for a p21-activated serine/threonine protein kinase [47]. Conditional deletion of Dnmt1 causes increased expression levels of Pak6, which are associated with morphological alterations of migrating interneurons characterized by higher cellular complexity and increased cell death rates. This significantly reduces the number of interneurons reaching the cortex [29]. However, the underlying mechanism by which DNMT1 represses Pak6 gene expression remains unclear and seems independent of direct DNA methylation of the Pak6 locus or of genes encoding for potential regulatory factors [29]. Hence, we hypothesized a crosstalk of DNMT1 with histone modifying enzymes in mediating the transcriptional silencing of Pak6 in cortical interneurons, which we addressed in the present study.
Our results suggested a bivalent regulation of Pak6 by simultaneous association of repressive H3K27me3 and permissive H3K4me3 close to the transcription start site. While the association of H3K4me3 at the Pak6 gene locus appeared DNMT1-independently regulated, we provided evidence for interactions of DNMT1 with the H3K27-methyltransferase EZH2 in modulating transcriptional. In particular, we found that the DNMT1-dependent establishment of repressive H3K27me3 by EZH2 contributes to the regulation of Pak6 expression. Thus, our study underlines the importance of the crosstalk between different epigenetic key regulators for transcriptional networks underlying cortical interneuron development.
Results
DNA methylation-independent transcriptional control of DNMT1
Our previous study revealed a prominent role of DNMT1 in promoting cortical interneuron migration and survival through the transcriptional regulation of genes involved in cytoskeletal remodeling and cell death such as Pak6, encoding for the p21-activated protein kinase PAK6 [29]. Correlative RNA and MeDIP sequencing on FACS-enriched Hmx3-Cre/tdTomato/Dnmt1 wild-type (Dnmt1 WT) and Hmx3-Cre/tdTomato/Dnmt1 loxP2 (Dnmt1 KO) mice at embryonic day (E) 16, when POA-derived interneuron migration takes place [28,29], was performed in a previous study [29]. The results suggested a DNA methylation-independent regulation of Pak6 expression by DNMT1. Indeed, the majority of genes with altered expression in Dnmt1-deficient POA interneurons did not display changes in gene methylation and vice versa (Figure 1(A)). This strongly suggested DNA methylation-independent actions of DNMT1 mediating transcriptional control in developing cortical interneurons, in addition to potential secondary effects of Dnmt1 deletion. GO analysis of the 1050 genes displaying increased expression without respective changes in DNA methylation in Dnmt1-deficient interneurons (obtained from the dataset of Pensold et al., 2016 [29]), resulted in a significant enrichment of membrane and cell shape-associated genes, as well as genes related to protein phosphorylation (Figure 1(B)). In agreement with this, the protein kinase PAK6 is involved in phosphate transfer as well as the regulation of neurite branching in post-mitotic neurons [29,48,49].
Figure 1.

DNA methylation-independent functions of DNMT1. (A) Venn diagram indicating differentially expressed genes (DEG, purple circle) and differentially methylated genes (DMG, red circle) as well as their overlap (magenta) between E16 FACS-enriched Hmx3-Cre/tdTomato/Dnmt1 wild-type (Dnmt1 WT) and Hmx3-Cre/tdTomato/Dnmt1 loxP2 (Dnmt1 KO) POA cells determined by correlative RNA and MeDIP sequencing. (B) Gene ontology (GO) analysis of genes that were significantly up-regulated in FAC-sorted E16 Dnmt1-deleted Hmx3-Cre/tdTomato POA cells (P < 0.05; Benjamini adjusted, foldchange > 1.3) and which did not display changes in gene methylation compared with E16 Hmx3-Cre/tdTomato/Dnmt1 wild-type POA cells. (C-G) Representative microphotographs of dissociated E16 (+ 2 DIV) POA cells (C, D) and neuroblastoma (N2a) cells (E, F) treated either to control (C, E) or Dnmt1 siRNA (D, F), and stained for H3K4me3, shown as fluorescence intensity in black/white code and as thermal color-code (thermal LUT). The mean grey value is quantified relative to controls in G (n = 26 POA and 345 N2a cells for ctrl siRNA, n = 24 POA and 245 N2a cells for Dnmt1 siRNA). (H) Schematic illustration of the Pak6 gene locus with promoter (red), promoter flanking (light red), enhancer (yellow) and non-regulatory (white) sites according to UCSC genome browser showing DNA primer positions (#1, #2, #3) in regulatory (#1, #2) and non-regulatory (#3) gene regions. (I, J) ChIP-analysis of control and Dnmt1 siRNA-treated N2a cells with a specific H3K4me3 antibody reveals the association of H3K4me3 to specific primer locations (#1–3 in H) in the Pak6 gene (I), analyzed by quantitative PCR and normalized to the amount of input DNA (J; three individual experiments with four technical replicates each). IgG controls were included to determine non-specifically bound DNA. ‘n’ refers to the number of analyzed cells. **P < 0.01; ***P < 0.001; Student’s t-test. Scale bars: 10 μm in (C-F). Ctrl, control; siR, siRNA; POA, preoptic area.
Besides cytosine methylation, DNMT1 contributes to the complex epigenetic network of gene regulation by modulating permissive and repressive chemical modifications of amino acids on histone tails via interactions with histone-modifying enzymes [50,51]. As such interactions were already shown to regulate relevant gene transcription in non-neuronal cells [52,53], we next investigated potential alterations in histone modifications after Dnmt1 deletion.
Global H3K4 trimethylation was increased in Dnmt1-depleted neuronal cells
Modifications at specific residues of histone amino acid tails affect gene accessibility [54–57]. Dependent on the modified lysine residue, histone methylation can either lead to permissive or repressive gene expression states [54–57]. Dnmt1-deficient embryonic POA-interneurons displayed transcriptional changes of diverse genes involved in the trimethylation of H3K4, which is associated to permissive chromatin structure. In detail, an increased expression of Kmt2d and Kmt2g coding for histone-lysine N-methyltransferases (HMT [58–60]) was observed in embryonic FACS-enriched Hmx3-Cre/tdTomato/Dnmt1 loxP2 cells (Supp. Figure 1). Both HMTs are classified as trithorax-group proteins with important function in maintaining gene expression and in promoting the methylation of H3K4 [58,59,61]. Mono-, di- and tri-methylation at H3K4, often correlated with enhanced gene transcription, are regulated by MLL-complexes that include the WDR5 protein [62–64]. The stability of WDR5 was reported to be increased by reduced expression of Cul4b [65,66], which we also found diminished in Dnmt1-deficient POA cells (Supp. Figure 1). Together, the expressional changes detected in Dnmt1-deficient interneurons pointed to changes in the H3K4 methylation machinery. Hence, we next asked whether the methylation of H3K4 was altered in Dnmt1-deficient cells with potential implications for the DNA methylation-independent transcriptional up-regulation of genes like Pak6. For this, we transfected dissociated POA cells isolated from E16 wild-type mice either with control or Dnmt1 siRNA and performed immunostaining against H3K4me3. Fluorescence intensity measurements indeed showed enhanced global trimethylation of H3K4 in Dnmt1-depleted POA cells (Figure 1(C,D,G)), which could be associated to an increase in gene transcription [62–64]. Hence, these data point to a DNMT1-dependent modulation of H3K4 methylation possibly by regulating the expression of histone methyltransferases or MLL-complex members.
The regulation of Pak6 expression seemed independent of DNMT1-induced changes in H3K4me3 levels
As we detected a global increase in permissive H3K4 trimethylation, we asked whether the elevated Pak6 expression observed after Dnmt1 depletion is caused by an enhanced association of trimethylated H3K4 to the Pak6 gene locus. To this end, we applied chromatin-immunoprecipitation (ChIP) with an H3K4me3-specific antibody. Due to low cell counts of Hmx3-Cre expressing POA cells in embryonic brains, we switched to neuroblastoma (N2a) cells, proven as reliable cell culture model [29]. Similar to POA-derived interneurons [29], N2a cells showed up-regulated Pak6 expression upon Dnmt1 depletion and a comparable increase in their morphological complexity (Supp. Figure 2). Additionally, Dnmt1-depleted N2a cells displayed a global increase in H3K4 trimethylation levels determined by fluorescence intensity measurements of Dnmt1 siRNA and control-treated cells (Figure 1(E-G)).
To quantitatively assess the association of trimethylated H3K4 to the Pak6 gene we performed qPCR of ChIP products of control and Dnmt1 siRNA-treated N2a cells using specific primers for promoter-flanking and non-regulatory sites of the Pak6 gene locus (Figure 1(H)). A promoter region in the Gapdh gene locus was used to validate the method, as Gapdh is often associated with H3K4me3 [67,68]. The qPCR results were normalized against the amount of input DNA and control IgG was used to display unspecific antibody binding properties. Under control conditions we detected a prominent association of H3K4me3 within the promoter flanking region (#1 and #2 in Figure 1(I,J)) similar to Gapdh, as well as within the non-regulatory region (#3 in Figure 1(I,J)). However, we did not observe any changes in H3K4me3 association upon Dnmt1 depletion in all regions analyzed (Figure 1(I,J)). Therefore, our data suggest that the transcription of Pak6 is not regulated by DNMT1-dependent changes in H3K4 trimethylation, even if other genes might be modulated that way, as suggested by the global increase in H3K4me3 revealed by immunostaining after Dnmt1 depletion (Figure 1(C,G)).
Figure 2.
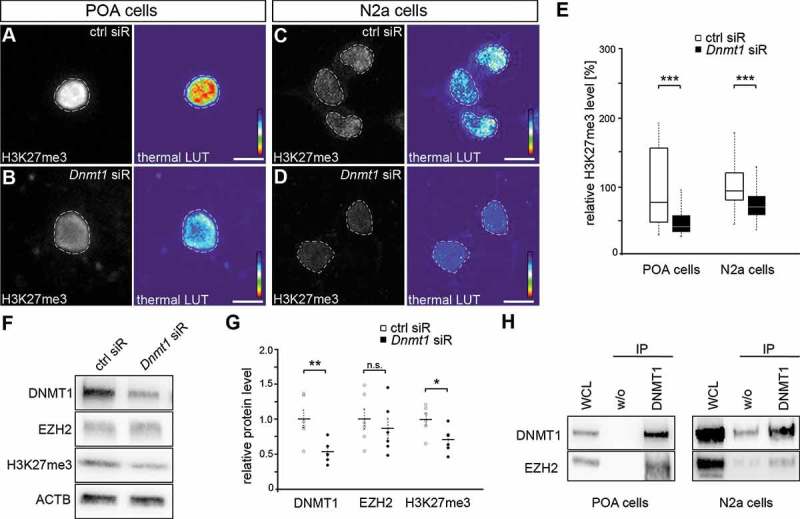
Repressive H3K27 trimethylation is reduced in Dnmt1-deficient cells. (A-E) Representative microphotographs of dissociated E16 (+ 2 DIV) POA cells (A, B) and N2a cells (C, D) treated either with control (A, C) or Dnmt1 siRNA (B, D) and stained for H3K7me3, presented as fluorescence intensity in black/white code and as thermal color-code (thermal LUT). The mean grey value relative to control is quantified in E (n = 34 POA and 118 N2a cells for ctrl siRNA, n = 32 POA and 144 N2a cells for Dnmt1 siRNA). (F, G) Protein levels of DNMT1, EZH2 and H3K27me3 in control and Dnmt1 siRNA-treated N2a cells analyzed with Western blot (G), normalized to ACTB and quantified in relation to control (G; five individual experiments). (H) Co-immunoprecipitation with a DNMT1-specific antibody revealed a protein-protein interaction with EZH2 in E16 POA and N2a cell samples analyzed by Western blot (three individual experiments, two animals per experiment for POA cells). ‘n’ refers to the number of analyzed cells. *P < 0.05;**P < 0.01;***P < 0.001; Student’s t-test. Scale bars: 10 μm in (A-D). Ctrl, control; siR, siRNA; POA, preoptic area.
Repressive H3K27 trimethylation was decreased in Dnmt1-depleted neurons
To realize an optimal and fast transition between transcriptional states during development, genes are often marked bivalently by a co-occurrence of permissive H3K4me3 and repressive H3K27me3 modifications [69–74], and the ratio of H3K4me3 and H3K27me3 often decides about gene transcription [72]. H3K27 trimethylation is regulated by the polycomb repressor complex 2 (PCR2) through its core enzyme EZH2, and diverse effector proteins mediate complex stability and specificity [75–81].
Interestingly, fluorescence intensity measurements of H3K27me3 in both embryonic POA-derived interneurons as well as N2a cells, treated either with control or Dnmt1 siRNA, revealed a global reduction of H3K27me3 upon Dnmt1 depletion (Figure 2(A-E)). This is in line with other studies showing diminished H3K27 trimethylation levels upon Dnmt1 deletion as well as after inhibition of EZH2 [53,82–85].
It was reported that DNMT1 can affect H3K27me3 through the transcriptional control over genes encoding for members of the H3K27 trimethylation machinery like EZH2. However, we did not detect any transcriptional changes in PCR2-related transcripts between Dnmt1 wild-type and knockout POA-derived interneurons of E16 mice (Supp. Figure 3A). In agreement with this, neither Dnmt1 depletion by siRNA nor blocking the DNA methylating function of DNMT1 by RG108 treatment in cultured N2a cells resulted in reduced EZH2 protein levels (Figure 2(F,G); Supp. Figure 3(B,C)). In contrast to EZH2, H3K27me3 levels were found reduced by Western blot analysis upon Dnmt1 depletion (Figure 2(F,G)), confirming the results of the immunocytochemistry analysis (Figure 2(A-E)). However, blocking DNA methylation with RG108 did not cause changes in the global H3K27me3 protein levels (Supp. Figure 3(B,C)). Together, these results indicate that DNMT1 modulates H3K27 trimethylation independently of the transcriptional control over PCR2 components like EZH2.
Figure 3.
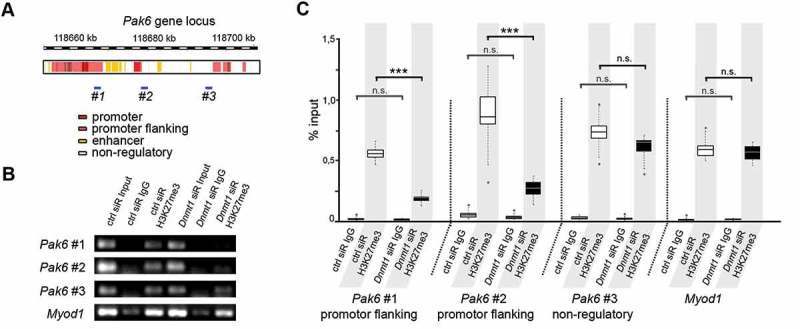
Dnmt1-depletion causes a reduced association of trimethylated H3K27 with Pak6 regulatory regions. (A) Schematic illustration of the Pak6 gene locus with promoter (red), promoter flanking (light red), enhancer (yellow) and non-regulatory (white) sites according to UCSC genome browser showing specific DNA primer positions (#1, #2, #3) in regulatory (#1, #2) and non-regulatory (#3) gene regions. (B, C) ChIP-analysis of control and Dnmt1 siRNA-treated N2a cells with a H3K27me3-specific antibody shows the association of H3K27me3 to the indicated primer locations (#1–3 in A) in the Pak6 gene (B), analyzed by quantitative PCR and normalized to the amount of input (C; three individual experiments with four technical replicates each). IgG controls indicate the amount of non-specifically bound DNA. ***P < 0.001; Student’s t-test. Ctrl, control; siR, siRNA.
For non-neuronal cells direct interactions of DNMT1 and EZH2 at protein level are described to realize a repressive transcriptional state [52,82]. Indeed, co-immunoprecipitation experiments performed with isolated POA cells of E16 wild-type brains as well as N2a cells confirmed an interaction of DNMT1 and EZH2 in both cell types (Figure 2(H)). Thus, these data point to a DNMT1-dependent modulation of H3K27 trimethylation via protein-protein interaction with EZH2 in developing POA-derived interneurons and neuron-like cells.
DNMT1 represss Pak6 expression by promoting the association of repressive H3K27me3 marks in promoter flanking regions
To elucidate whether DNMT1-dependent modulation of H3K27me3 is involved in the regulation of Pak6 expression, we next performed ChIP with a H3K27me3-specific antibody using control and Dnmt1 siRNA-treated N2a cells. The immunoprecipitated DNA was quantitatively analyzed for Pak6 gene fragments using the same primer as for H3K4me3 analysis directed against promoter-flanking regions as well as non-regulatory gene regions of Pak6 (Figure 3(A)). Primer against a promoter region of Myod1 were used as control, as this muscle-specific gene is usually strongly associated with H3K27me3 in neuronal cells to repress its transcription [86].
In control siRNA-treated cells, we detected a strong association of H3K27me3 at the promoter-flanking positions of the Pak6 gene locus (Figure 3(B,C), #1 and #2), as well as at the non-regulatory region (Figure 3(B,C), #3). Upon Dnmt1 depletion, we found significantly decreased levels of H3K27me3 within the regulatory gene regions of the Pak6 gene locus (Figure 3(B,C), #1 and #2). Apart from that, we did not detect any relevant changes within the non-regulatory site (Figure 3(B,C), #3). This reduced association of trimethylated H3K27 induced by Dnmt1 depletion was in line with the observed increase in Pak6 expression.
As an association of H3K27me3 near gene promoter regions often suppresses transcription of the respective genes [76,77,87], our results emphasize a DNMT1-dependent repression of Pak6 transcription through the modulation of EZH2-mediated H3K27 trimethylation.
EZH2 inhibition lead to changes in morphology similar to the effects induced by Dnmt1 depletion
The experiments described so far indicated that DNMT1 represses Pak6 expression through interactions with EZH2, thereby affecting H3K27me3 marks. To functionally verify the EZH2-dependent transcriptional regulation of Pak6, we treated cultured N2a cells with the inhibitor 3-Deazaneplanocin A (DZNep), shown to increase protein degradation of EZH2 [88,89]. In line with other studies [89–91], we detected decreased levels of global H3K27me3 compared to DMSO-treated controls in both, embryonic POA-derived primary neurons (Figure 4(A,B)) and N2a cells (Figure 4(C,D)) upon DZNep-mediated degradation of EZH2, as analyzed by intensity measurements of immunocytochemical stainings (Figure 4(E)). Furthermore, in comparison to DMSO controls quantitative measurements revealed enhanced Pak6 expression after DZNep-induced EZH2 degradation (Figure 4(F)), confirming the relevance of this histone methyltransferase for the transcriptional control of Pak6.
Figure 4.
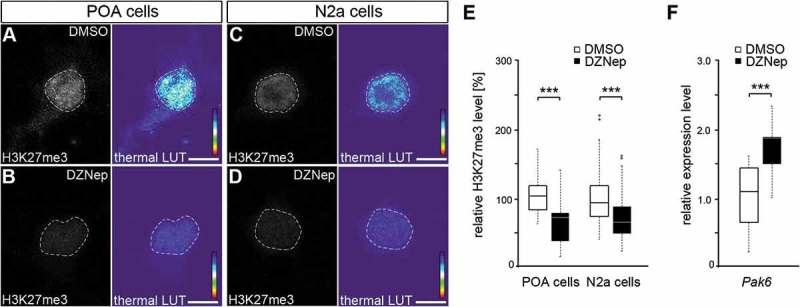
EZH2 inhibition by DZNep reduces global H3K27me3 levels and elevates Pak6 gene expression. (A-E) Representative microphotographs of dissociated E16 (+ 2 DIV) POA cells (A, B) and N2a cells (C, D) treated either with DMSO (A, C) or the EZH2 inhibitor DZNep (B, D) and stained with a H3K7me3-specific antibody, shown as fluorescence intensity in black/white code and as thermal color-code (thermal LUT). The mean grey value is quantified relative to DMSO controls in E (n = 37 POA and 120 N2a cells for DMSO, n = 36 POA and 102 N2a cells for DZNep). (F) Quantitative PCR displays increased Pak6 expression in DZNep-treated N2a cells compared to DMSO controls, normalized against Rps29 and Actb (three individual experiments with four technical replicates each). ‘n’ refers to the number of analyzed cells. ***P < 0.001; Student’s t-test.
A Dnmt1 deletion-induced elevation of Pak6 expression in migrating POA-derived interneurons was shown to change their morphological characteristics from a polarized migratory shape to an atypical complex morphology reminiscent of mature interneurons. This was assessed by measuring the leading and trailing process length, neurite numbers as well as branching frequencies [29]. To validate whether EZH2 inhibition that caused increased Pak6 expression induces similar effects, we analyzed the morphology of dissociated POA-derived interneurons and N2a cells treated with DZNep (Figure 5A-E). Consistent with previous studies, in which forced PAK6 expression was induced [29], DZNep treatment lead to a substantial increase in cellular complexity of both cell types, characterized by augmented lengths of non-leading processes and a higher branch point occurrence (Figure 5(A-E)). To directly control whether the elevated Pak6 expression contributes to this gain in cellular complexity, depletion of Pak6 with target-specific siRNA was achieved in DZNep and DMSO-treated cells and compared to control transfections. Indeed, Pak6 siRNA treatment rescued the DZNep-induced defects in POA cell morphology (Figure 5(F,J)), indicating that Pak6 expression regulation in neurons depends on EZH2-mediated repressive H3K27 trimethylation in regulatory gene regions.
Figure 5.
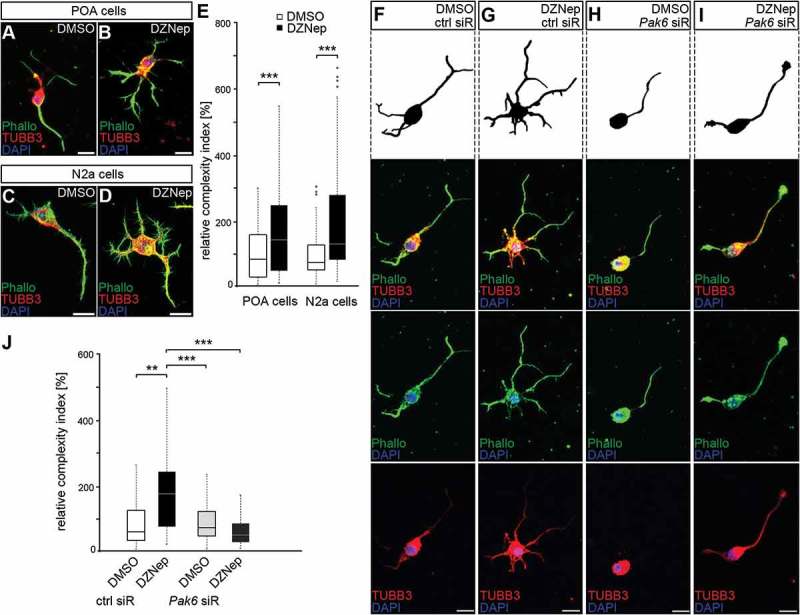
Enhanced Pak6 expression induced by EZH2 inhibition results in increased morphological complexity. (A-E) Representative microphotographs of dissociated E16 (+ 2 DIV) POA cells (A, B) and N2a cells (C, D) treated either with DMSO (A, C) or DZNep (B, D) and stained against TUBB3 (green channel) with a specific antibody, ACTB (red channel) with fluorescently labeled phalloidin and DAPI (blue channel). Quantification of cell morphology is shown in (E) as complexity index relative to DMSO controls. The complexity index is a product of primary neurite number, the branch point number of the longest process and the ratio between longest process length and the mean length of all other neurites. (E; n = 52 POA and 85 N2a cells for DMSO, n = 69 POA and 93 N2a cells for DZNep). (F-J) Representative microphotographs of dissociated E16 (+ 2 div) POA cells treated either with DMSO (F, H) or DZNep (G, I) in addition to control (F, G) or Pak6 siRNA (H, I), then stained against TUBB3 (green channel) with a specific antibody, ACTB (red channel) with fluorescently labeled phalloidin and DAPI (blue channel). The complexity index is quantified in (J) relative to DMSO + ctrl siRNA cell parameters (n = 39 POA cells for DMSO + ctrl siRNA, n = 43 POA cells for DZNep + ctrl siRNA, n = 51 POA cells for DMSO + Pak6 siRNA, n = 68 POA cells for DZNep + Pak6 siRNA). ‘n’ refers to the number of analyzed cells. **P < 0.01;***P < 0.001; Student’s t-test. Ctrl, control; siR, siRNA; POA, preoptic area.
Together, the results presented here demonstrate that DNMT1 acts in concert with histone modifying mechanisms in developing POA-derived interneurons. In particular, Pak6 repression in immature interneurons seems to rely on a DNMT1-dependent modulation of repressive H3K27 trimethylations mediated by interactions between DNMT1 and EZH2.
Discussion
Developmental processes in neurons underlie a multifaceted epigenetic regulation triggering stage and cell type-specific transcriptional programs [92–95]. While stable gene repression potentially restricts cell fate, flexible and fast gene regulation allows the adaption to transient intrinsic and extrinsic cues [40–42]. DNMT-mediated DNA methylation was initially considered as a stable repressive mark and as a key mechanism for permanent gene silencing during development and over lifetime [96–99]. However, active and selective DNA demethylation processes enable dynamic DNA methylation and contribute to an adjustable transcriptional control in neuronal cell types [100–106]. Although, DNMT1 was classified as maintenance methyltransferase with a high affinity to hemimethylated DNA strands after replication [107–109], there are many studies reporting additional functions during post-mitotic neuronal development as well as in the adult brain [29,43,46,110–113].
In our previous study, we highlighted the function of DNMT1 in facilitating the migration and survival of immature inhibitory interneurons in part by transcriptional repression of the gene coding for the serine/threonine-protein kinase PAK6 [29]. However, our data pointed to a DNA methylation-independent regulation of Pak6 expression by DNMT1 [29]. In the present study, we provided evidence that the transcriptional control of Pak6 relies on a DNMT1-dependent establishment of repressive histone marks through interactions with histone-modifying enzymes.
This is consistent with the results obtained by RNA and MeDIP sequencing of Hmx3-expressing Dnmt1 wild-type and knockout POA cells, showing no correlation between transcriptional changes and alterations in gene methylation for many membrane-, cell shape- and protein phosphorylation-associated genes. Immature interneurons have to quickly adapt their morphology in regard to changing external guidance cues during their migration from their sites of origin in the basal telencephalon towards cortical targets [114–117]. Therefore, the expression of genes important for the composition and arrangement of cytoskeletal compartments as well as membrane-bound proteins like specific guidance receptors has to be rapidly adapted upon signal detection and integration [116,118–122]. Often, these processes are regulated by protein phosphorylation [123–126], which also necessitates a flexible regulation of respective protein kinases like the PAKs [47,127,128]. Although active DNA demethylation is shown to realize rapid activity-dependent transcriptional changes in post-mitotic neurons [101], DNA methylation and demethylation seem rather regulate temporally orchestrated programs in neurons facilitating subtype-specific differentiation and maturation over the developmental time course [129].
However, DNMT1 additionally appears to contribute to the transcriptional control of genes important for highly dynamic processes like cell shape modulation through distinct mechanisms apart from direct DNA methylation. Several studies already emphasize the relevance of non-canonical DNMT1 functions in regulating gene activity showing that the enzyme is also repressively active without its catalytic domain [130–132]. In addition to the transcriptional control over genes encoding for proteins involved in the methylation of histone tail amino acids, DNMT1 directly interacts with these proteins, thereby coordinately determining the chromatin status and allowing for transient gene expression [50,51,133,134].
In agreement with this, we found elevated global H3K4me3 and diminished H3K27me3 levels upon Dnmt1 depletion, proposing a function for DNMT1 in modulating these histone tail modifications in POA-derived interneurons. H3K4me3 marks, mostly detected at transcription start sites of gene promoters and other regulatory gene regions together with the RNA polymerase II [135–137], are strongly associated with active gene transcription [62]. In turn, H3K27me3 sites were predominantly found within inactive chromatin regions [76,77,87].
Consistent with changes in H3K4me3 levels, we found an elevated expression of components facilitating H3K4 trimethylation upon Dnmt1 deletion by screening the RNA sequencing dataset published in Pensold et al., 2016 [29]. This included transcripts coding for the histone-lysine-N-methyltransferases (HKMT) KMT2D and KMT2G (SETD1B), which specifically perform mono- and tri-methylation at H3K4 [58–60]. Hence, altered expression of HKMT like KMT2D or KMT2G may facilitate DNA methylation-independent alterations in gene transcription in POA-derived Dnmt1-deficient interneurons.
Although we collected evidence for a DNMT1-mediated control of H3K4me3 marks, transcriptional levels of Pak6 in immature POA-derived interneurons rather rely on a DNMT1-dependent regulation of H3K27 trimethylation. While associations of H3K4me3 with regulatory regions at the Pak6 gene locus were observed, we did not detect an increase upon Dnmt1 depletion, neither at regulatory nor non-regulatory Pak6 gene sites. However, we can not exclude that more distanced regulatory regions up- or down-stream are possibly changed in their association with H3K4me3.
In contrast to H3K4me3, the association of repressive H3K27me3 histone marks in Pak6 regulatory regions was diminished upon Dnmt1 depletion consistent with the global decrease. This indicates that in addition to H3K4me3, DNMT1 affects trimethylation of H3K27 in neuronal cells and that Pak6 expression is regulated through DNMT1-induced changes in H3K27me3 association. Comprehensive studies in mice analyzing methylated lysine residues of H3 already revealed a bivalent regulation of many developmental genes by permissive H3K4me3 and repressive H3K27me3 residues adopting a ‘winner-takes-all’ principle [71,72,138]. That means, the decision about the transcriptional activity of these genes depends on the proportion of both histone marks.
Trimethylations at lysines 27 of histone 3 proteins are performed by the Polycomb repressor complex 2 (PCR2) [76,139], consisting of the core enzyme enhancer of zeste (EZH2) and diverse accessory components [77,78]. During early brain development, EZH2 is the main methyltransferase of PCR2 [79–81]. With neuronal maturation its expression decreases and the repressive function is taken over by EZH1 in a similar polycomb protein complex [140,141].
For non-neuronal cells, an interplay of DNMT1 and EZH2 was already shown [53,82,84,85,142–144] and the global decrease of H3K27me3 we detected in neurons with diminished Dnmt1 expression is consistent with other studies [53,82,83]. Some studies suggest a modulation of DNMT1 function by EZH2, as it is found to bind and recruit the DNA methyltransferase to specific gene sites and to regulate DNA methylation properties [82,142–144]. Vice versa, a widespread H3K27me3 redistribution and the re-expression of Polycomb-target genes upon DNA hypomethylation is reported [83], suggesting that DNMT1 potentially acts upstream of EZH2. In this context, DNMT1 is already described to affect the expression of the Polycomb methyltransferase and other PCR2 components as well as H3K27 trimethylation [53,83–85]. Thereby, manipulation of DNMT1 function or expression induces an increased generation of miR-214, which targets Ezh2 leading to its degradation [53,145,146]. MiR-214 is further suggested to support DNMT1 via a self-regulatory feedback mechanism, as it triggers the degradation of a DNMT1 repressor protein [146]. However, as EZH2 also targets miR-214 for gene silencing [145], more work needs to be done to uncover all aspects of the complex relationship between DNMT1, EZH2 and further regulatory components.
In contrast to studies in cancer cells [53,84], we neither detected changes in EZH2 expression nor in the expression of accessory PCR2 components upon Dnmt1 depletion in POA interneurons and neuron-like N2a cells, although they revealed significantly diminished H3K27 trimethylation. Our data emphasize that in POA neurons and neurons-like N2a cells the H3K27me3 marks rather depend on the interaction of DNMT1 and EZH2 proteins than on DNMT1-dependent transcriptional control of PCR2 components.
How is the target-specificity of such complexes regulated? Recent studies highlight an important function of non-coding RNA derivatives in mediating EZH2 binding to specific gene regions [147]. For example, in a complex with DNMT1, the lncRNAs LINC00673 and HOXA-11-AS participate in the recruitment of EZH2 [148,149]. Thus, DNMT1 possibly modulates H3K27 trimethylation not only through the direct interaction with EZH2, but also via the assembly of further components like lncRNAs that in turn determine target specificity. Moreover, the demethylase LSD1 is found in a close relation to HOXA-11-AS and DNMT1, removing H3K4 methylation and contributing to gene silencing [149]. This supports the role of DNMT1 in mediating gene accessibility through the recruitment and regulation of many epigenetic key players and its involvement in bivalent gene regulation.
Among those genes regulated by DNMT1-EZH2 interactions, we also suspected Pak6, which was confirmed by chromatin-immunoprecipitation experiments and pharmacological inhibition of EZH2 with DZNep, inducing an up-regulation of Pak6 gene transcription along with a down-regulation of H3K27 trimethylation. Similar to morphological alterations seen in Dnmt1-deficient cells [29], DZNep-treated POA neurons also displayed increasing cellular complexity mimicking the morphological phenotype of Dnmt1-deficient POA-derived interneurons. DZNep treatment was already shown to induce morphological alterations as it possibly affects the expression of many genes [150,151]. However, the siRNA-mediated downregulation of Pak6 levels in DZNep-treated POA cells rescued their cell morphology, underlining our hypothesis of a DNMT1-dependent regulation of Pak6 through EZH2-dependent alterations in H3K27 trimethylations.
Moreover, based on the simultaneous association of H3K27me3 and H3K4me3 at the investigated positions of the Pak6 gene locus, we hypothesize a bivalent regulation of Pak6 expression. Although H3K4me3 levels were not changed in Dnmt1-depleted cells, the reduced trimethylation of H3K27 might allow a fast up-regulation of Pak6 expression due to a proportional higher association of H3K4me3. This could facilitate transcriptional activity, which was already reported for several developmental genes [62]. This bivalent mechanism might be of relevance for the observed switch between the repressive Pak6 gene state during interneuron migration in developing embryos and the increased transcription of Pak6 in cortical interneurons of newborn pubs [29]. As PAK6 was reported to be important for neurite outgrowth during differentiation of excitatory neurons in the cortex [48], a ‘switched-on’ expression in interneurons that have reached their cortical target area would favor their maturation.
In conclusion, our study highlighted the importance of DNMT1 for regulating gene expression in immature interneurons via DNA methylation-independent mechanisms. Thereby, changes in repressive H3K27 trimethylation seem to rely on the interaction of DNMT1 with the PCR2 core histone methyltransferase EZH2. Moreover, our data revealed that Pak6 regulatory gene regions are associated with both repressive H3K27me3 and permissive H3K4me3, proposing a bivalent regulation.
Material and methods
Animals
Wild-type mice on a C57BL/6 background were used for all experiments. All animal procedures were performed in strict compliance with the EU directives 86/609/EWG and 2007/526/EG guidelines for animal experiments and were approved by the local government (Thueringer Landesamt, Bad Langensalza, Germany). Animals were housed under 12 h light/dark conditions with ad libitum access to food and water.
Preparation of embryonic single cells from the POA
For the preparation of embryonic POA cells, timed pregnant mice were killed by an intraperitoneal injection of 50% chloral hydrate in phosphate-buffered saline (PBS; pH 7.4). Embryos were removed and decapitated, brains prepared and embedded in 4% low-melt agarose (Sigma-Aldrich). Coronal living brain sections (300 µm) from embryonic brains were prepared at the vibratome (VT1000S, Leica) at 4°C in Krebs’ buffer (126 mM NaCl, 2.5 mM, KCL, 1.2 mM NaH2PO4, 1.2 mM MgCl2, 2.1 mM CaCl2, 10 mM D-Glucose, 12.5 mM NaHCO3). Slices were collected in post holding buffer (Krebs’ buffer with 1 M HEPES, 100 U/mL penicillin and 100 μg/mL streptomycin). POA domains were prepared under visual control. Brain tissue was incubated with 0.025% trypsin (Thermo Fisher Scientific) in Hank's balanced salt solution (Invitrogen) for 17 min at 37°C. Cells were then dissociated by trituration and cell aggregates were removed by filtering through a nylon gauze (200 µm). Single cells were seeded at densities of 300 cells/mm2 on coverslips (Ø 12 mm) coated with 19 µg/µL laminin (Sigma-Aldrich) and 5 µg/µL poly-L-lysine (Sigma-Aldrich) in Grey´s balanced salt solution (GBSS) and incubated in DMEM/F12 (1:1, Invitrogen), 10% fetal bovine serum (FBS; Biowest), 100 U/mL penicillin (Gibco), 100 g/mL streptomycin (Gibco), 0.4 mM L-glutamine (Gibco), 0.15% D-glucose at 37°C, 5% CO2, and 95% humidity for 1 day in vitro (div) before further treatment. For co-immunoprecipitation, POA cells were washed in PBS and pelleted by centrifugation (1000 g at 4°C for 5 min) before further treatment.
N2a cell culture
Neuro-2a (N2a) cells were cultured in DMEM (Invitrogen), 2% FBS (Biowest), 100 U/mL penicillin (Gibco), 100 g/mL streptomycin (Gibco) at 37°C, 5% CO2, and 95% humidity. When reaching 75% confluence, N2a cells were mechanically dissociated and divided by the ratio 1:4. Before further treatment, N2a cells were seeded at densities of 100 cells/mm2 on coverslips (Ø 12 mm) coated with 19 µg/µL laminin (Sigma-Aldrich) und 5 µg/µL poly-L-lysine (Sigma-Aldrich) in GBSS and incubated in DMEM (Thermo Fisher Scientific), 2% FBS, 100 U/mL penicillin, 100 g/mL streptomycin at 37°C, 5% CO2, and 95% humidity for 24 h.
Transfection of primary neuron culture and N2a cells with siRNA
Transfection of dissociated embryonic POA cells of C57BL/6 wild-type mice and N2a cells with siRNA was performed via lipofection using Lipofectamine RNAiMAX (Thermo Fisher Scientific), according to the manufacturer’s protocol and as described in Zimmer et al. (2011) [152]. Mouse Dnmt1 siRNA oligos (50 nM) or mouse Pak6 siRNA oligos (50 nM), containing a pool of at least three target-specific 19–25 nt siRNAs to knockdown gene expression (Dnmt1 siRNA sc-35,203; Pak6 siRNA sc-44,879; Santa Cruz Biotechnology) or 50 nM control siRNA (BLOCK-iT Alexa Fluor red/green fluorescent oligo; Invitrogen) were applied for 5 h in antibiotic-free Opti-MEM I Reduced Serum Medium (Thermo Fisher Scientific) at 37°C, 5% CO2, and 95% humidity. Then, primary cells were incubated in DMEM/F12 (1:1, Invitrogen), 10% FBS (Biowest), 100 U/mL penicillin (Gibco), 100 g/mL streptomycin (Gibco), 0.4 mM L-glutamine (Gibco), 0.15% D-glucose and N2a cells in DMEM (Invitrogen), 2% FBS (Biowest), 100 U/mL penicillin (Gibco), 100 g/mL streptomycin (Gibco) for 24 h at 37°C, 5% CO2, and 95% humidity.
DZNep and RG108 treatment
To inhibit EZH2 function, dissociated POA cells were treated with 1.5 µM 3-Deazaneplanocin A (DZNep, Sigma-Aldrich) in DMEM/F12 (1:1, Invitrogen), 10% FBS, 100 U/mL penicillin, 100 g/mL streptomycin, 0.4 mM L-glutamine, 0.15% D-glucose. N2a cells were treated with 100 nM DZNep (Sigma-Aldrich) in DMEM (Invitrogen), 2% FBS, 100 U/mL penicillin, 100 g/mL streptomycin for 24 h at 37°C, 5% CO2, and 95% humidity. N-phthalyl-L-tryptophan (20 µM, RG108, Sigma-Aldrich) was used to block DNA methylation in N2a cells cultured in DMEM (Thermo Fisher Scientific), 2% FBS, 100 U/mL penicillin, 100 g/mL streptomycin for 24 h at 37°C, 5% CO2, and 95% humidity. As control, POA and N2a cells were treated with dimethyl sulfoxide (DMSO).
RNA preparation and expression analysis
For RNA expression analysis, siRNA- or DZNep-treated N2a cells cultured in 6 well plates were harvested in Trizol Reagent (Life Technologies), frozen and stored at −20°C. N2a cells were subjected to standard RNA isolation procedure in Trizol Reagent (Life Technologies), digested with RNase-free DNase (Qiagen) and quality and RNA quantities were measured with the NanoDropTM1000 (Thermo Fisher Scientific). RNA was analyzed in a one-step qRT-PCR using the SuperScript III Platinum SYBR Green One-Step qRT-PCR Kit (Thermo Fisher Scientific) with the following primer sequences (indicated as 5′ to 3′; fw, forward; rev, reverse): Dnmt1 fw TGAGCATCGATGAGGAGATG, Dnmt1 rev CGCATGGAACATCATCTGAC, Pak6 fw CTGTACGCTACTGAGGTGGA, Pak6 rev GTACCAGCATCCGATCCAGG, Rps29 fw GAAGTTCGGCCAGGGTTCC, Rps29 rev GAAGCCTATGTCCTTCGCGT, bAct fw AGAGGGAAATCGTGCGTGAC, bAct rev CAATAGTGATGACCTGGCCGT.
Immunocytochemistry and immunohistochemistry
POA and N2a cells cultured on coverslips and used for immunohistochemical stainings were fixed with 4% PFA for 10 min and stored in PBS at 4°C. Immunocytochemistry of fixed dissociated cells was performed as previously described in Zimmer et al. (2011 [152]). Briefly, cells were washed in PBS with 0.1% Triton X-100 and treated with the blocking reagent (4% bovine serum albumin in PBS with 0.1% Triton X-100) for 30 min at room temperature. Primary antibody incubation was performed for 3 h and secondary antibody incubation for 1 h at room temperature in blocking solution. Incubation with Alexa Fluor™ 488 Phalloidin (Thermo Fisher Scientific) to stain F-actin was performed according to the manufacturer’s guidelines. Cells were stained with DAPI for 5 min at room temperature. Following primary antibodies were used: rabbit anti-β-III-tubulin (TUBB3, Sigma-Aldrich; 1:500), rabbit anti-H3K4me3 (Abcam, 1:500), rabbit anti-H3K27me3 (Millipore, 1:500). Cy3 goat anti-rabbit IgG (1:1000; Jackson Laboratory) was used as secondary antibody.
Co-immunoprecipitation
For analysis of protein interactions, N2a cells cultured in 6 well plates were harvested and similar to dissociated POA cells pelleted by centrifugation (1000 g at 4°C for 5 min). Cell pellets were resuspended in RIPA buffer (50 mM Tris/HCl pH 8.0, 150 mM NaCl, 0.5% NP-40, 0.1% SDS, 0.1% sodium deoxycholate, 1 mM PMSF, 500 µM leupeptine) and lysed for 10 min on ice with subsequent treatment in an ultrasonic water bath (Sonorex super 10P, Bandelin) for 1 min. Lysates were centrifuged for 20 min at 20,000 g and 4°C. The supernatant (whole cell lysate) was applied for co-immunoprecipitation. Five percent of the supernatant was boiled for 10 min at 95°C in 4x sample buffer (200 mM Tris pH 6.8, 4% SDS, 10% β-mercaptoethanol, 40% glycerol, 0.002% bromophenol blue) and stored at −20°C used later as positive control for protein incidence in the lysate.
For co-immunoprecipitation, protein A agarose beads (Millipore) were washed in RIPA buffer and incubated at 4°C for 1 h with 4 µg antibody directed against rabbit anti-DNMT1 (CosmoBio). Control beads were incubated without antibody. Empty binding sites were blocked by adding 45 µg bovine serum albumin (Serva). After 1 h incubation, the supernatant was removed and whole cell lysates were added to the beads for 2 h at 4°C. Then, beads were washed six times in RIPA buffer, boiled for 10 min at 95°C in 4x sample buffer (200 mM Tris pH 6.8, 4% SDS, 10% β-mercaptoethanol, 40% glycerol, 0.002% bromophenol blue) and stored at −20°C for protein detection.
Protein preparation and expression analysis
To quantitatively assess protein expression, N2a cells were cultured in 6 well plates and harvested after 24 h of siRNA or RG108 treatment, washed in PBS and pelleted by centrifugation (1000 g at 4°C for 5 min). N2a cell pellets were lysed for 1 h on ice in lysis buffer containing 0.1 M Na2HPO4, 0.1 M NaH2PO4, 5 mM EDTA, 2 mM MgCl2, 0.1 mM phenylmethylsulphonyl fluoride (PMSF, Serva), 500 µM Leupeptin (Serva) and 0.1% 3-[(3-cholamidopropyl) dimethylammonium]-1-propanesulfonate (CHAPS, Carl Roth). Cell lysates were treated for 1 min in an ultrasonic water bath (Sonorex super 10P, Bandelin) and centrifuged for 20 min at 20,000 g and 4°C. Supernatants were collected in new tubes and protein concentration was determined using the NanoDropTM1000 (Thermo Fisher Scientific). Lysates with a protein amount of 30 µg were boiled at 95°C for 10 min in 4x sample buffer containing 200 mM Tris pH 6.8, 4% SDS, 10% β-mercaptoethanol, 40% glycerol and 0.002% bromophenol blue and were stored at −20°C.
In 4x sample buffer frozen protein samples were separated on a ready-to-use 4–12% gradient gel (Serva) using 1x SDS-running buffer (Laemmli buffer, Serva) following manufacturer’s instructions. For transfer of proteins to a nitrocellulose membrane in a semi-dry blot procedure a Towbin blotting kit (Serva) was used following the manufacturer’s instructions. Subsequently, the membranes were blocked in 1x BlueBlock-reagent (Serva) for 1 h. Incubation with the following primary antibodies occurred over night: rabbit-anti-DNMT1 (CosmoBio, 1:1000), rabbit-anti-EZH2 (CellSignaling, 1:1000), rabbit-anti-H3K27me3 (Millipore, 1:1000), mouse-anti-β-actin (Abcam, 1:5000). The following secondary antibodies coupled to horseradish peroxidase (HRP) were applied for 1 h: sheep anti-mouse (GE Healthcare, 1:4000), donkey anti-rabbit (GE Healthcare, 1:4000). Membranes were washed after each incubation step three times for 5 min in TBS-T buffer (25 mM Tris/HCl pH 7.5, 137 mM NaCl, 2.7 mM KCl, 0.05% Tween-20). Chemo-luminescent detection of protein bands was performed at the blot documentation system ImageQuant LAS4000 (GE Healthcare) after applying the HRP substrate solution (Serva). Protein levels were normalized to β-actin.
Chromatin-immunoprecipitation and quantitative PCR
For chromatin-immunoprecipitation, N2a cells with a confluence of 75% were transfected with siRNA in 10 cm well plates. Twenty-four hours after transfection, N2a cells were washed with 37°C pre-warmed PBS and cross-linking of protein-DNA interactions was performed in 1% formaldehyde in PBS. The reaction was terminated by adding 0.125 M glycine. Cells were washed with PBS including 1 mM PMSF, 1 μg/mL aprotinine, 1 μg/mL pepstatine A (all from Serva), harvested with a cell scraper, aliquoted with a cell number of 1 × 10⁶ cells per tube and centrifuged for 5 min at 1000 g at 4°C. Cell pellets were frozen in liquid nitrogen and stored at −80°C before further treatment.
Protein-DNA cross-linked N2a cell pellets were resuspended and lysed in 50 mM Tris-HCl pH 8.1, 10 mM EDTA pH 8.0, 1% SDS including protease inhibitors (1 mM PMSF, 1 μg/ml aprotinine, 1 μg/ml pepstatine A; all from Serva) for 10 min at 4°C. DNA fragmentation was performed in an ultrasonic water bath (Sonorex super 10P, Bandelin) at 4°C with 30 cycles at 100% power setting and 30 s break between each cycle. After centrifugation for 10 min with 13.000 g at 4°C, supernatant was diluted in ChIP dilution buffer (16.7 mM Tris-HCl pH 8.1, 167 mM NaCl, 1.2 mM EDTA pH 8.0, 1.1% Triton X-100, 0.01% SDS) including protease inhibitors (1 mM PMSF, 1 μg/ml aprotinine, 1 μg/ml pepstatine A; all from Serva). 1% was taken as input control and stored at −20°C. To reduce unspecific binding to the agarose beads, probes were incubated for 30 min at 4°C with 3% protein A agarose/salmon sperm DNA (50% slurry; Merck Millipore). After centrifugation (1 min, 1000 g, 4°C), supernatant was incubated with 4 μg/mL antibody for 12 h at 4°C. Following antibodies were used for precipitation: rabbit anti-H3K4me3 (Abcam), rabbit anti-H3K27me3 (Millipore) and rabbit anti-IgG (Abcam). For detection of antibody-bound DNA fragments, probes were incubated for 1 h at 4°C with 3% protein A agarose/salmon sperm DNA (50% slurry; Merck Millipore). After centrifugation (1 min, 1000 g, 4°C), agarose pellets were washed for 5 min each with following solutions: low salt immune complex-wash buffer (20 mM Tris-HCl pH 8.1, 150 mM NaCl, 2 mM EDTA pH 8.0, 1% Triton X-100, 0.1% SDS), high salt immune complex-wash buffer (20 mM Tris-HCl pH 8.1, 500 mM NaCl, 2 mM EDTA pH 8.0, 1% Triton X-100, 0.1% SDS), LiCl immune complex-wash buffer (16.7 mM Tris-HCl pH 8.1, 250 mM LiCl, 1 mM EDTA pH 8.0, 1% sodium deoxycholate, 1% IGEPAL CA630) and 2 x TE buffer (10 mM Tris-HCl pH 8.1, 1 mM EDTA pH 8.0). For elution of DNA, pelleted agarose was incubated with elution buffer (1% SDS, 0.1 M NaHCO3) for 15 min at room temperature. The supernatant was collected in a new tube after centrifugation (1 min, 1000 g, 4°C). The elution was repeated. Protein-DNA cross-linking of the eluate and input control probes were removed for 4 h at 65°C with 200 mM NaOH. Finally, proteins were digested for 1 h at 45°C in 10 mM EDTA, 40 mM Tris-HCl pH 6.5 und 20 µg/µl proteinase K (Merck Millipore). DNA was precipitated with standard phenol-chloroform isoamyl alcohol (25:24:1) extraction and purified with the DNA Clean & Concentrator-5 Kit (Zymo Research) according to the manufacturer’s guidelines.
To quantitatively asses the amount of specific DNA fragments, primer-specific pre-amplification of probes was performed in the T-gradient PCR Cycler (Bio-Rad) for 20 cycles prior quantitative analysis with the Real-Time PCR-System qTOWER3/G (Analytik Jena). For both PCR reactions the innuMIX qPCR MasterMix SyGreen qPCR Kit (Analytik Jena) was used according to the manufacturer’s guidelines. Following primer sequences were used (indicated as 5′ to 3′; fw, forward; rev, reverse): Pak6-1 fw TCTCACTCTCAGAAGCCAGG, Pak6-1 rev AGCGTAGATCAGAGTGGGTG, Pak6-2 fw ACACTGTGCTTCTCCCTAGG, Pak6-2 rev TTCTCTCCGCTCCTTTCTCC, Pak6-3 fw CGCTGCTGAAGTTCTTCTGG, Pak6-3 rev GGCCCTTCTTACCGTCAGAT. Normalization of DNA content was performed according to the percent-input method in relation to the analyzed input probes [153].
Microscopy and data analysis
Fluorescent images were either taken with the inverted confocal laser scanning microscope TCS SP5 (Leica) or with the inverted Axio Cellobserver Z1 fluorescence microscope with a MosaiX module and Apotome (Carl Zeiss Microscopy). Photographs were analyzed with Fiji software (Schindelin, 2012). For fluorescence intensity measurement, each experimental design was imaged at one particular microscope with same settings regarding exposure time and light intensity at the CellObserver Z1, or laser power, gain and spectral settings at Zeiss SP5. Fluorescence intensity measurement of the cell nucleus of was applied for the H3K4me3 and H3K27me3 staining. Background correction was performed. Mean fluorescent intensity of the Dnmt1 siRNA- or DZNep-treated cells was normalized to control siRNA- or dimethyl sulfoxide (DMSO)-treated cells. Quantitative RNA results were analyzed by ∆Ct method and presented in relation to control samples.
The dataset of the RNA and MeDIP-analysis performed and published in Pensold et al., 2016 [29] was used for the analysis presented here. Here, FAC-sorted cells of transgenic mice on the C57BL/6 background including Hmx3-Cre/tdTomato/Dnmt1 wild-type as well as Hmx3-Cre/tdTomato/Dnmt1 loxP2 mice were used. The transgenic mice were established by crossing the Hmx3-Cre line (obtained from Oscar Marin, King’s College, London, UK and described in Gelman et al. 2009 [28]) with the tdTomato transgenic reporter mice (obtained from Christian Hübner, University Hospital Jena, Germany, and described in Madisen et al. 2010 [154]), and Dnmt1 LoxP2 mice (B6;129Sv-Dnmt1tm4Jae/J, Jaenisch laboratory, Whitehead Institute, USA). Cre-mediated deletion leads to out-of-frame splicing from exon 3 to exon 6 of the Dnmt1 gene, resulting in a null allele [155]. Data analysis was performed as described in Pensold et al., 2016 [29].
Photoshop CC was applied for image illustration. Significance was analyzed with two-tailed Student’s t-test. Significance levels: P value < 0.05 *; P value < 0.01 **; P value < 0.001 ***. If not stated differently, experiments were repeated three times.
Supplementary Material
Funding Statement
This work was funded by the DFG (Deutsche Forschungsgemeinschaft-German Research Foundation; ZI1224/4-1), and the IZKF (Interdisziplinäres Zentrum für Klinik und Forschung-Interdisciplinary Center for Clinic and Research) Jena.
Authors´ contribution
JS: designed and performed experiments, data analysis, figure illustration, conceptual design of the study, wrote the manuscript; CB: performed experiments, manuscript correction; CS: performed experiments, data analysis, assisted in writing the manuscript; AH: data analysis; DP: data analysis, manuscript correction; GZ, conceptual design of the study, wrote the manuscript.
Disclosure statement
No potential conflict of interest was reported by the authors.
References
- 1.Zhou S, Yu Y.. Synaptic E-I balance underlies efficient neural coding. Front Neurosci. 2018;12:46 PubMed PMID: 29456491; PubMed Central PMCID: PMC5801300. [DOI] [PMC free article] [PubMed] [Google Scholar]
- 2.Hennequin G, Agnes EJ, Vogels TP.. Inhibitory plasticity: balance, control, and codependence. Annu Rev Neurosci. 2017. July 25;40:557–579. [DOI] [PubMed] [Google Scholar]
- 3.Sprekeler H. Functional consequences of inhibitory plasticity: homeostasis, the excitation-inhibition balance and beyond. Curr Opin Neurobiol. 2017. April;43:198–203. PubMed PMID: 28500933. [DOI] [PubMed] [Google Scholar]
- 4.Tatti R, Haley MS, Swanson OK, et al. Neurophysiology and Regulation of the Balance Between Excitation and Inhibition in Neocortical Circuits. Biol Psychiatry. 2017. May 15;81(10):821–831. PubMed PMID: 27865453; PubMed Central PMCID: PMC5374043. [DOI] [PMC free article] [PubMed] [Google Scholar]
- 5.Kepecs A, Fishell G. Interneuron cell types are fit to function. Nature. 2014. January 16;505(7483):318–326. . PubMed PMID: 24429630; PubMed Central PMCID: PMC4349583. [DOI] [PMC free article] [PubMed] [Google Scholar]
- 6.Tremblay R, Lee S, Rudy B. GABAergic Interneurons in the Neocortex: from Cellular Properties to Circuits. Neuron. 2016. July 20;91(2):260–292. . PubMed PMID: 27477017; PubMed Central PMCID: PMC4980915. [DOI] [PMC free article] [PubMed] [Google Scholar]
- 7.Rubenstein JL, Merzenich MM. Model of autism: increased ratio of excitation/inhibition in key neural systems. Genes Brain Behav. 2003. October;2(5):255–267. PubMed PMID: 14606691. [DOI] [PMC free article] [PubMed] [Google Scholar]
- 8.Levitt P, Eagleson KL, Powell EM. Regulation of neocortical interneuron development and the implications for neurodevelopmental disorders. Trends Neurosci. 2004. July;27(7):400–406. . PubMed PMID: 15219739. [DOI] [PubMed] [Google Scholar]
- 9.Levitt P. Disruption of interneuron development. PubMed PMID: 16201992 Epilepsia. 2005;46Suppl 7:22–28. [DOI] [PubMed] [Google Scholar]
- 10.Rossignol E. Genetics and function of neocortical GABAergic interneurons in neurodevelopmental disorders. Neural Plast. 2011;2011:649325 PubMed PMID: 21876820; PubMed Central PMCID: PMC3159129. [DOI] [PMC free article] [PubMed] [Google Scholar]
- 11.Rubenstein JL. Annual Research Review: development of the cerebral cortex: implications for neurodevelopmental disorders. J Child Psychol Psychiatry. 2011. April;52(4):339–355. . PubMed PMID: 20735793; PubMed Central PMCID: PMC3429600. [DOI] [PMC free article] [PubMed] [Google Scholar]
- 12.Chattopadhyaya B, Cristo GD. GABAergic circuit dysfunctions in neurodevelopmental disorders. Front Psychiatry. 2012;3:51 PubMed PMID: 22666213; PubMed Central PMCID: PMC3364508. [DOI] [PMC free article] [PubMed] [Google Scholar]
- 13.Goulburn AL, Stanley EG, Elefanty AG, et al. Generating GABAergic cerebral cortical interneurons from mouse and human embryonic stem cells. Stem Cell Res. 2012. May;8(3):416–426. PubMed PMID: 22280980. [DOI] [PubMed] [Google Scholar]
- 14.Marin O. Interneuron dysfunction in psychiatric disorders. Nat Reviews Neurosci. 2012. January 18;13(2):107–120. . PubMed PMID: 22251963. [DOI] [PubMed] [Google Scholar]
- 15.Volk DW, Matsubara T, Li S, et al. Deficits in transcriptional regulators of cortical parvalbumin neurons in schizophrenia. Am J Psychiatry. 2012. October;169(10):1082–1091. PubMed PMID: 22983435; PubMed Central PMCID: PMC3513625. [DOI] [PMC free article] [PubMed] [Google Scholar]
- 16.Ye H, Kaszuba S. Inhibitory or excitatory? Optogenetic interrogation of the functional roles of GABAergic interneurons in epileptogenesis. J Biomed Sci. 2017. December 5;24(1):93 . PubMed PMID: 29202749; PubMed Central PMCID: PMC5715558. [DOI] [PMC free article] [PubMed] [Google Scholar]
- 17.Wonders CP, Anderson SA. The origin and specification of cortical interneurons. Nat Reviews Neurosci. 2006. September;7(9):687–696. . PubMed PMID: 16883309. [DOI] [PubMed] [Google Scholar]
- 18.Druga R. Neocortical inhibitory system. Folia Biol (Krakow). 2009;55(6): 201–217. PubMed PMID: 20163769. [PubMed] [Google Scholar]
- 19.Gelman DM, Marin O. Generation of interneuron diversity in the mouse cerebral cortex. Eur J Neurosci. 2010. June;31(12):2136–2141. . PubMed PMID: 20529125. [DOI] [PubMed] [Google Scholar]
- 20.Sultan KT, Brown KN, Shi SH. Production and organization of neocortical interneurons. Front Cell Neurosci. 2013. November 21;7:221. [DOI] [PMC free article] [PubMed] [Google Scholar]
- 21.Laclef C, Metin C. Conserved rules in embryonic development of cortical interneurons. Semin Cell Dev Biol. 2017. September 14 PubMed PMID: 28918121. doi: 10.1016/j.semcdb.2017.09.017 [DOI] [PubMed] [Google Scholar]
- 22.Wichterle H, Garcia-Verdugo JM, Herrera DG, et al. Young neurons from medial ganglionic eminence disperse in adult and embryonic brain. Nat Neurosci. 1999. May;2(5):461–466. PubMed PMID: 10321251. [DOI] [PubMed] [Google Scholar]
- 23.Anderson SA, Marin O, Horn C, et al. Distinct cortical migrations from the medial and lateral ganglionic eminences. Development. 2001. February;128(3):353–363. PubMed PMID: 11152634. [DOI] [PubMed] [Google Scholar]
- 24.Wichterle H, Turnbull DH, Nery S, et al. In utero fate mapping reveals distinct migratory pathways and fates of neurons born in the mammalian basal forebrain. Development. 2001. October;128(19):3759–3771. PubMed PMID: 11585802. [DOI] [PubMed] [Google Scholar]
- 25.Flames N, Pla R, Gelman DM, et al. Delineation of multiple subpallial progenitor domains by the combinatorial expression of transcriptional codes. J Neuroscience: Official Journal Soc Neurosci. 2007. September 05;27(36):9682–9695. PubMed PMID: 17804629; PubMed Central PMCID: PMC4916652. [DOI] [PMC free article] [PubMed] [Google Scholar]
- 26.Corbin JG, Butt SJ. Developmental mechanisms for the generation of telencephalic interneurons. Dev Neurobiol. 2011. August;71(8):710–732. . PubMed PMID: 21485015. [DOI] [PubMed] [Google Scholar]
- 27.Marin O. Cellular and molecular mechanisms controlling the migration of neocortical interneurons. Eur J Neurosci. 2013. July;38(1):2019–2029. . PubMed PMID: 23651101. [DOI] [PubMed] [Google Scholar]
- 28.Gelman DM, Martini FJ, Nobrega-Pereira S, et al. The embryonic preoptic area is a novel source of cortical GABAergic interneurons. J Neuroscience: Official Journal Soc Neurosci. 2009. July 22;29(29):9380–9389. PubMed PMID: 19625528. [DOI] [PMC free article] [PubMed] [Google Scholar]
- 29.Pensold D, Symmank J, Hahn A, et al. The DNA methyltransferase 1 (DNMT1) control the shape and dynamics of migrating POA-derived interneurons fated for the murine cerebral cortex. Cereb Cortex. 2016. Dec 1;27(12):5696–5714. PubMed PMID: 29117290. [DOI] [PubMed] [Google Scholar]
- 30.Symmank J, Goelling V, Gerstmann K, et al. The Transcription Factor LHX1 Regulates the Survival and Directed Migration of POA-derived Cortical Interneurons. Cereb Cortex. 2018. doi: 10.1093/cercor/bhy063. [DOI] [PubMed] [Google Scholar]
- 31.Nadarajah B, Parnavelas JG. Modes of neuronal migration in the developing cerebral cortex. Nat Reviews Neurosci. 2002. June;3(6):423–432. . PubMed PMID: 12042877. [DOI] [PubMed] [Google Scholar]
- 32.Marin O, Rubenstein JL. A long, remarkable journey: tangential migration in the telencephalon. Nat Reviews Neurosci. 2001. November;2(11):780–790. . PubMed PMID: 11715055. [DOI] [PubMed] [Google Scholar]
- 33.Metin C, Baudoin JP, Rakic S, et al. Cell and molecular mechanisms involved in the migration of cortical interneurons. Eur J Neurosci. 2006. February;23(4):894–900. PubMed PMID: 16519654. [DOI] [PubMed] [Google Scholar]
- 34.Miller MW. Relationship of the time of origin and death of neurons in rat somatosensory cortex: barrel versus septal cortex and projection versus local circuit neurons. J Comp Neurol. 1995. April 24;355(1):6–14. . PubMed PMID: 7636014. [DOI] [PubMed] [Google Scholar]
- 35.Southwell DG, Paredes MF, Galvao RP, et al. Intrinsically determined cell death of developing cortical interneurons. Nature. 2012. November 01;491(7422):109–113. PubMed PMID: 23041929; PubMed Central PMCID: PMC3726009. [DOI] [PMC free article] [PubMed] [Google Scholar]
- 36.Uribe E, Wix R. Neuronal migration, apoptosis and bipolar disorder. Rev Psiquiatr Salud Ment. 2012. Apr-Jun;5(2):127–133. . PubMed PMID: 22854584. [DOI] [PubMed] [Google Scholar]
- 37.Denaxa M, Neves G, Rabinowitz A, et al. Modulation of Apoptosis Controls Inhibitory Interneuron Number in the Cortex. Cell Rep. 2018. February 13;22(7):1710–1721. PubMed PMID: 29444425. [DOI] [PMC free article] [PubMed] [Google Scholar]
- 38.Hu JS, Vogt D, Sandberg M, et al. Cortical interneuron development: a tale of time and space. Development. 2017. November 1;144(21):3867–3878. PubMed PMID: 29089360; PubMed Central PMCID: PMC5702067. [DOI] [PMC free article] [PubMed] [Google Scholar]
- 39.Symmank J, Zimmer G. Regulation of neuronal survival by DNA methyltransferases. Neural Regeneration Research. 2017. November;12(11):1768–1775. . PubMed PMID: 29239313. [DOI] [PMC free article] [PubMed] [Google Scholar]
- 40.Jaenisch R, Bird A. Epigenetic regulation of gene expression: how the genome integrates intrinsic and environmental signals. Nat Genet. 2003. March;33:245–254. PubMed PMID: 12610534. [DOI] [PubMed] [Google Scholar]
- 41.Feng J, Fouse S, Fan G. Epigenetic regulation of neural gene expression and neuronal function. Pediatr Res. 2007. May;61(5 Pt 2):58R–63R. . PubMed PMID: 17413844. [DOI] [PubMed] [Google Scholar]
- 42.Cholewa-Waclaw J, Bird A, Von Schimmelmann M, et al. The Role of Epigenetic Mechanisms in the Regulation of Gene Expression in the Nervous System. J Neuroscience: Official Journal Soc Neurosci. 2016. November 09;36(45):11427–11434. PubMed PMID: 27911745; PubMed Central PMCID: PMC5125210. [DOI] [PMC free article] [PubMed] [Google Scholar]
- 43.Akbarian S, Beeri MS, Haroutunian V. Epigenetic Determinants of Healthy and Diseased Brain Aging and Cognition In: JAMA Neurology. 2013. doi: 10.1001/jamaneurol.2013.1459 [DOI] [PMC free article] [PubMed] [Google Scholar]
- 44.Fagiolini M, Jensen CL, Champagne FA. Epigenetic influences on brain development and plasticity. Curr Opin Neurobiol. 2009. April;19(2):207–212. . PubMed PMID: 19545993; PubMed Central PMCID: PMC2745597. [DOI] [PMC free article] [PubMed] [Google Scholar]
- 45.Mitchell AC, Bharadwaj R, Whittle C, et al. The genome in three dimensions: a new frontier in human brain research. Biol Psychiatry. 2014. June 15;75(12):961–969. PubMed PMID: 23958183; PubMed Central PMCID: PMC3925763. [DOI] [PMC free article] [PubMed] [Google Scholar]
- 46.Lv J. The Epigenetic Switches for Neural Development and Psychiatric Disorders. J Genet Genomics. 2013 Jul 20;40(7):339–346. PubMed PMID: 23876774.. [DOI] [PubMed] [Google Scholar]
- 47.Kumar R, Sanawar R, Li X, et al. Structure, biochemistry, and biology of PAK kinases. Gene. 2017. March 20;605:20–31. PubMed PMID: 28007610; PubMed Central PMCID: PMC5250584. [DOI] [PMC free article] [PubMed] [Google Scholar]
- 48.Civiero L, Cirnaru MD, Beilina A, et al. Leucine-rich repeat kinase 2 interacts with p21-activated kinase 6 to control neurite complexity in mammalian brain. J Neurochem. 2015. December;135(6):1242–1256. PubMed PMID: 26375402; PubMed Central PMCID: PMC4715492. [DOI] [PMC free article] [PubMed] [Google Scholar]
- 49.Civiero L, Cogo S, Kiekens A, et al. PAK6 Phosphorylates 14-3-3gamma to Regulate Steady State Phosphorylation of LRRK2. Front Mol Neurosci. 2017;10:417 PubMed PMID: 29311810; PubMed Central PMCID: PMC5735978. [DOI] [PMC free article] [PubMed] [Google Scholar]
- 50.Du J, Johnson LM, Jacobsen SE, et al. DNA methylation pathways and their crosstalk with histone methylation. Nature Reviews Molecular Cell Biology. 2015. September;16(9):519–532. PubMed PMID: 26296162; PubMed Central PMCID: PMC4672940. [DOI] [PMC free article] [PubMed] [Google Scholar]
- 51.Rose NR, Klose RJ. Understanding the relationship between DNA methylation and histone lysine methylation. Biochim Biophys Acta. 2014. December;1839(12):1362–1372. . PubMed PMID: 24560929; PubMed Central PMCID: PMC4316174. [DOI] [PMC free article] [PubMed] [Google Scholar]
- 52.Vire E, Brenner C, Deplus R, et al. The Polycomb group protein EZH2 directly controls DNA methylation. Nature. 2006. February 16;439(7078):871–874. PubMed PMID: 16357870. [DOI] [PubMed] [Google Scholar]
- 53.So AY, Jung JW, Lee S, et al. DNA methyltransferase controls stem cell aging by regulating BMI1 and EZH2 through microRNAs. PloS One. 2011. May 10;6(5):e19503 PubMed PMID: 21572997; PubMed Central PMCID: PMC3091856. [DOI] [PMC free article] [PubMed] [Google Scholar]
- 54.Jenuwein T, Allis CD. Translating the histone code. Science. 2001. August 10;293(5532):1074–1080. . PubMed PMID: 11498575. [DOI] [PubMed] [Google Scholar]
- 55.Bannister AJ, Kouzarides T. Regulation of chromatin by histone modifications. Cell Res. 2011. March;21(3):381–395. . PubMed PMID: 21321607; PubMed Central PMCID: PMC3193420. [DOI] [PMC free article] [PubMed] [Google Scholar]
- 56.Lawrence M, Daujat S, Schneider R. Lateral Thinking: how Histone Modifications Regulate Gene Expression. Trends in Genetics: TIG. 2016. January;32(1):42–56. . PubMed PMID: 26704082. [DOI] [PubMed] [Google Scholar]
- 57.Harr JC, Gonzalez-Sandoval A, Gasser SM. Histones and histone modifications in perinuclear chromatin anchoring: from yeast to man. EMBO Rep. 2016. February;17(2):139–155. . PubMed PMID: 26792937; PubMed Central PMCID: PMC4783997. [DOI] [PMC free article] [PubMed] [Google Scholar]
- 58.Guo C, Chen LH, Huang Y, et al. KMT2D maintains neoplastic cell proliferation and global histone H3 lysine 4 monomethylation. Oncotarget. 2013. November;4(11):2144–2153. PubMed PMID: 24240169; PubMed Central PMCID: PMC3875776. [DOI] [PMC free article] [PubMed] [Google Scholar]
- 59.Froimchuk E, Jang Y, Ge K. Histone H3 lysine 4 methyltransferase KMT2D. Gene. 2017. September 05;627:337–342. [DOI] [PMC free article] [PubMed] [Google Scholar]
- 60.Brici D, Zhang Q, Reinhardt S, et al. Setd1b, encoding a histone 3 lysine 4 methyltransferase, is a maternal effect gene required for the oogenic gene expression program. Development. 2017. July 15;144(14):2606–2617. PubMed PMID: 28619824. [DOI] [PubMed] [Google Scholar]
- 61.Lee JH, Tate CM, You JS, et al. Identification and characterization of the human Set1B histone H3-Lys4 methyltransferase complex. J Biol Chem. 2007. May 4;282(18):13419–13428. PubMed PMID: 17355966. [DOI] [PubMed] [Google Scholar]
- 62.Eissenberg JC, Shilatifard A. Histone H3 lysine 4 (H3K4) methylation in development and differentiation. Dev Biol. 2010. March 15;339(2):240–249. . PubMed PMID: 19703438; PubMed Central PMCID: PMC3711867. [DOI] [PMC free article] [PubMed] [Google Scholar]
- 63.Shen E, Shulha H, Weng Z, et al. Regulation of histone H3K4 methylation in brain development and disease. Philosophical Transactions of the Royal Society of London Series B, Biological Sciences. 2014. September 26;369(1652). PubMed PMID: 25135975; PubMed Central PMCID: PMC4142035. [DOI] [PMC free article] [PubMed] [Google Scholar]
- 64.Vallianatos CN, Iwase S. Disrupted intricacy of histone H3K4 methylation in neurodevelopmental disorders. PubMed PMID: 26077434; PubMed Central PMCID: PMC4501478 Epigenomics. 2015;73:503–519. [DOI] [PMC free article] [PubMed] [Google Scholar]
- 65.Nakagawa T, Xiong Y. X-linked mental retardation gene CUL4B targets ubiquitylation of H3K4 methyltransferase component WDR5 and regulates neuronal gene expression. Mol Cell. 2011. August 05;43(3):381–391. . PubMed PMID: 21816345; PubMed Central PMCID: PMC3230935. [DOI] [PMC free article] [PubMed] [Google Scholar]
- 66.Nakagawa T, Xiong Y. Chromatin regulation by CRL4 E3 ubiquitin ligases: CUL4B targets WDR5 ubiquitylation in the nucleus. Cell Cycle. 2011. December 15;10(24):4197–4198. . PubMed PMID: 22107965; PubMed Central PMCID: PMC5442879. [DOI] [PMC free article] [PubMed] [Google Scholar]
- 67.Wang P, Lin C, Smith ER, et al. Global analysis of H3K4 methylation defines MLL family member targets and points to a role for MLL1-mediated H3K4 methylation in the regulation of transcriptional initiation by RNA polymerase II. Mol Cell Biol. 2009. November;29(22):6074–6085. PubMed PMID: 19703992; PubMed Central PMCID: PMC2772563. [DOI] [PMC free article] [PubMed] [Google Scholar]
- 68.Bhandare R, Schug J, Le Lay J, et al. Genome-wide analysis of histone modifications in human pancreatic islets. Genome Res. 2010. April;20(4):428–433. PubMed PMID: 20181961; PubMed Central PMCID: PMC2847745. [DOI] [PMC free article] [PubMed] [Google Scholar]
- 69.Bernstein BE, Mikkelsen TS, Xie X, et al. A bivalent chromatin structure marks key developmental genes in embryonic stem cells. Cell. 2006. April 21;125(2):315–326. PubMed PMID: 16630819. [DOI] [PubMed] [Google Scholar]
- 70.Mikkelsen TS, Ku M, Jaffe DB, et al. Genome-wide maps of chromatin state in pluripotent and lineage-committed cells. Nature. 2007. August 02;448(7153):553–560. PubMed PMID: 17603471; PubMed Central PMCID: PMC2921165. [DOI] [PMC free article] [PubMed] [Google Scholar]
- 71.Voigt P, Tee WW, Reinberg D. A double take on bivalent promoters. Genes Dev. 2013. June 15;27(12):1318–1338. . PubMed PMID: 23788621; PubMed Central PMCID: PMC3701188. [DOI] [PMC free article] [PubMed] [Google Scholar]
- 72.Cui P, Liu W, Zhao Y, et al. Comparative analyses of H3K4 and H3K27 trimethylations between the mouse cerebrum and testis. Genomics, Proteomics & Bioinformatics. 2012. April;10(2):82–93. PubMed PMID: 22768982; PubMed Central PMCID: PMC5054206. [DOI] [PMC free article] [PubMed] [Google Scholar]
- 73.Barski A, Cuddapah S, Cui K, et al. High-resolution profiling of histone methylations in the human genome. Cell. 2007. May 18;129(4):823–837. PubMed PMID: 17512414. [DOI] [PubMed] [Google Scholar]
- 74.Burney MJ, Johnston C, Wong KY, et al. An epigenetic signature of developmental potential in neural stem cells and early neurons. Stem Cells. 2013. September;31(9):1868–1880. PubMed PMID: 23712654. [DOI] [PubMed] [Google Scholar]
- 75.Hontelez S, Van Kruijsbergen I, Georgiou G, et al. Embryonic transcription is controlled by maternally defined chromatin state. Nat Commun. 2015. December 18;6:10148 PubMed PMID: 26679111; PubMed Central PMCID: PMC4703837. [DOI] [PMC free article] [PubMed] [Google Scholar]
- 76.Boros J, Arnoult N, Stroobant V, et al. Polycomb repressive complex 2 and H3K27me3 cooperate with H3K9 methylation to maintain heterochromatin protein 1alpha at chromatin. Mol Cell Biol. 2014. October 1;34(19):3662–3674. PubMed PMID: 25047840; PubMed Central PMCID: PMC4187721. [DOI] [PMC free article] [PubMed] [Google Scholar]
- 77.Jiao L, Liu X. Structural basis of histone H3K27 trimethylation by an active polycomb repressive complex 2. Science. 2015. October 16;350(6258):aac4383 . PubMed PMID: 26472914; PubMed Central PMCID: PMC5220110. [DOI] [PMC free article] [PubMed] [Google Scholar]
- 78.Chittock EC, Latwiel S, Miller TC, et al. Molecular architecture of polycomb repressive complexes. Biochem Soc Trans. 2017. February 8;45(1):193–205. PubMed PMID: 28202673; PubMed Central PMCID: PMC5310723. [DOI] [PMC free article] [PubMed] [Google Scholar]
- 79.Feng X, Juan AH, Wang HA, et al. Polycomb Ezh2 controls the fate of GABAergic neurons in the embryonic cerebellum. Development. 2016. June 1;143(11):1971–1980. PubMed PMID: 27068104; PubMed Central PMCID: PMC4920161. [DOI] [PMC free article] [PubMed] [Google Scholar]
- 80.Zhao L, Li J, Ma Y, et al. Ezh2 is involved in radial neuronal migration through regulating Reelin expression in cerebral cortex. Sci Rep. 2015. October 26;5:15484 PubMed PMID: 26499080; PubMed Central PMCID: PMC4620455. [DOI] [PMC free article] [PubMed] [Google Scholar]
- 81.Pereira JD, Sansom SN, Smith J, et al. Ezh2, the histone methyltransferase of PRC2, regulates the balance between self-renewal and differentiation in the cerebral cortex. Proc Natl Acad Sci U S A. 2010. September 7;107(36):15957–15962. PubMed PMID: 20798045; PubMed Central PMCID: PMC2936600. [DOI] [PMC free article] [PubMed] [Google Scholar]
- 82.Ning X, Shi Z, Liu X, et al. DNMT1 and EZH2 mediated methylation silences the microRNA-200b/a/429 gene and promotes tumor progression. Cancer Lett. 2015. April 10;359(2):198–205. PubMed PMID: 25595591. [DOI] [PubMed] [Google Scholar]
- 83.Reddington JP, Perricone SM, Nestor CE, et al. Redistribution of H3K27me3 upon DNA hypomethylation results in de-repression of Polycomb target genes. Genome Biol. 2013. March 25;14(3):R25 PubMed PMID: 23531360; PubMed Central PMCID: PMC4053768. [DOI] [PMC free article] [PubMed] [Google Scholar]
- 84.Purkait S, Sharma V, Kumar A, et al. Expression of DNA methyltransferases 1 and 3B correlates with EZH2 and this 3-marker epigenetic signature predicts outcome in glioblastomas. Exp Mol Pathol. 2016. April;100(2):312–320. PubMed PMID: 26892683. [DOI] [PubMed] [Google Scholar]
- 85.Wu J, Tang Q, Yang L, et al. Interplay of DNA methyltransferase 1 and EZH2 through inactivation of Stat3 contributes to beta-elemene-inhibited growth of nasopharyngeal carcinoma cells. Sci Rep. 2017. March 30;7(1):509 10.1038/s41598-017-00626-6. PubMed PMID: 28360411; PubMed Central PMCID: PMC5428779. [DOI] [PMC free article] [PubMed] [Google Scholar]
- 86.Wang AH, Zare H, Mousavi K, et al. The histone chaperone Spt6 coordinates histone H3K27 demethylation and myogenesis. EMBO J. 2013. April 17;32(8):1075–1086. PubMed PMID: 23503590; PubMed Central PMCID: PMC3630356. [DOI] [PMC free article] [PubMed] [Google Scholar]
- 87.Conway E, Healy E, Bracken AP. PRC2 mediated H3K27 methylations in cellular identity and cancer. Curr Opin Cell Biol. 2015. December;37:42–48. PubMed PMID: 26497635. [DOI] [PubMed] [Google Scholar]
- 88.Tan J, Yang X, Zhuang L, et al. Pharmacologic disruption of Polycomb-repressive complex 2-mediated gene repression selectively induces apoptosis in cancer cells. Genes Dev. 2007. May 1;21(9):1050–1063. PubMed PMID: 17437993; PubMed Central PMCID: PMC1855231. [DOI] [PMC free article] [PubMed] [Google Scholar]
- 89.Girard N, Bazille C, Lhuissier E, et al. 3-Deazaneplanocin A (DZNep), an inhibitor of the histone methyltransferase EZH2, induces apoptosis and reduces cell migration in chondrosarcoma cells. PloS One. 2014;9(5):e98176 PubMed PMID: 24852755; PubMed Central PMCID: PMC4031152. [DOI] [PMC free article] [PubMed] [Google Scholar]
- 90.Nakagawa S, Sakamoto Y, Okabe H, et al. Epigenetic therapy with the histone methyltransferase EZH2 inhibitor 3-deazaneplanocin A inhibits the growth of cholangiocarcinoma cells. Oncol Rep. 2014. February;31(2):983–988. PubMed PMID: 24337160. [DOI] [PubMed] [Google Scholar]
- 91.Kikuchi J, Takashina T, Kinoshita I, et al. Epigenetic therapy with 3-deazaneplanocin A, an inhibitor of the histone methyltransferase EZH2, inhibits growth of non-small cell lung cancer cells. Lung Cancer. 2012. November;78(2):138–143. PubMed PMID: 22925699; PubMed Central PMCID: PMC3472089. [DOI] [PMC free article] [PubMed] [Google Scholar]
- 92.Geiman TM, Robertson KD. Chromatin remodeling, histone modifications, and DNA methylation-how does it all fit together?. PubMed PMID: 12244565 J Cell Biochem. 2002;872:117–125. [DOI] [PubMed] [Google Scholar]
- 93.Fuks F. DNA methylation and histone modifications: teaming up to silence genes. Curr Opin Genet Dev. 2005. October;15(5):490–495. . PubMed PMID: 16098738. [DOI] [PubMed] [Google Scholar]
- 94.Vaissiere T, Sawan C, Herceg Z. Epigenetic interplay between histone modifications and DNA methylation in gene silencing. Mutat Res. 2008. Jul-Aug;659(1–2):40–48. . PubMed PMID: 18407786. [DOI] [PubMed] [Google Scholar]
- 95.Cedar H, Bergman Y. Linking DNA methylation and histone modification: patterns and paradigms. Nat Reviews Genet. 2009. May;10(5):295–304. . PubMed PMID: 19308066. [DOI] [PubMed] [Google Scholar]
- 96.Lande-Diner L, Zhang J, Ben-Porath I, et al. Role of DNA methylation in stable gene repression. J Biol Chem. 2007. April 20;282(16):12194–12200. PubMed PMID: 17311920. [DOI] [PubMed] [Google Scholar]
- 97.Hashimshony T, Zhang J, Keshet I, et al. The role of DNA methylation in setting up chromatin structure during development. Nat Genet. 2003. June;34(2):187–192. PubMed PMID: 12740577. [DOI] [PubMed] [Google Scholar]
- 98.Razin A, Cedar H. DNA methylation and gene expression. Microbiol Rev. 1991. September;55(3):451–458. PubMed PMID: 1943996; PubMed Central PMCID: PMC372829. [DOI] [PMC free article] [PubMed] [Google Scholar]
- 99.Moore LD, Le T, Fan G. DNA methylation and its basic function. Neuropsychopharmacology: Official Publication Am Coll Neuropsychopharmacol. 2013. January;38(1):23–38. . PubMed PMID: 22781841; PubMed Central PMCID: PMC3521964. [DOI] [PMC free article] [PubMed] [Google Scholar]
- 100.Reik W, Dean W, Walter J. Epigenetic reprogramming in mammalian development. Science. 2001. August 10;293(5532):1089–1093. . PubMed PMID: 11498579. [DOI] [PubMed] [Google Scholar]
- 101.Martinowich K, Hattori D, Wu H, et al. DNA methylation-related chromatin remodeling in activity-dependent BDNF gene regulation. Science. 2003. October 31;302(5646):890–893. PubMed PMID: 14593184. [DOI] [PubMed] [Google Scholar]
- 102.Weaver IC, Cervoni N, Champagne FA, et al. Epigenetic programming by maternal behavior. Nat Neurosci. 2004. August;7(8):847–854. PubMed PMID: 15220929. [DOI] [PubMed] [Google Scholar]
- 103.Weaver IC, Champagne FA, Brown SE, et al. Reversal of maternal programming of stress responses in adult offspring through methyl supplementation: altering epigenetic marking later in life. J Neuroscience: Official Journal Soc Neurosci. 2005. November 23;25(47):11045–11054. PubMed PMID: 16306417. [DOI] [PMC free article] [PubMed] [Google Scholar]
- 104.Miller CA, Sweatt JD. Covalent modification of DNA regulates memory formation. Neuron. 2007. March 15;53(6):857–869. . PubMed PMID: 17359920. [DOI] [PubMed] [Google Scholar]
- 105.Feng J, Zhou Y, Campbell SL, et al. Dnmt1 and Dnmt3a maintain DNA methylation and regulate synaptic function in adult forebrain neurons. Nat Neurosci. 2010. April;13(4):423–430. PubMed PMID: 20228804; PubMed Central PMCID: PMC3060772. [DOI] [PMC free article] [PubMed] [Google Scholar]
- 106.Gavin DP, Chase KA, Sharma RP. Active DNA demethylation in post-mitotic neurons: a reason for optimism. Neuropharmacology. 2013. December;75:233–245. PubMed PMID: 23958448; PubMed Central PMCID: PMC3864977. [DOI] [PMC free article] [PubMed] [Google Scholar]
- 107.Hermann A, Goyal R, Jeltsch A. The Dnmt1 DNA-(cytosine-C5)-methyltransferase methylates DNA processively with high preference for hemimethylated target sites. J Biol Chem. 2004. November 12;279(46):48350–48359. . PubMed PMID: 15339928. [DOI] [PubMed] [Google Scholar]
- 108.Hirasawa R, Chiba H, Kaneda M, et al. Maternal and zygotic Dnmt1 are necessary and sufficient for the maintenance of DNA methylation imprints during preimplantation development. Genes Dev. 2008. June 15;22(12):1607–1616. PubMed PMID: 18559477; PubMed Central PMCID: PMC2428059. [DOI] [PMC free article] [PubMed] [Google Scholar]
- 109.Bashtrykov P, Jankevicius G, Smarandache A, et al. Specificity of Dnmt1 for methylation of hemimethylated CpG sites resides in its catalytic domain. Chem Biol. 2012. May 25;19(5):572–578. PubMed PMID: 22633409. [DOI] [PubMed] [Google Scholar]
- 110.Chestnut BA, Chang Q, Price A, et al. Epigenetic regulation of motor neuron cell death through DNA methylation. J Neuroscience: Official Journal Soc Neurosci. 2011. November 16;31(46):16619–16636. PubMed PMID: 22090490; PubMed Central PMCID: PMC3238138. [DOI] [PMC free article] [PubMed] [Google Scholar]
- 111.Kadriu B, Guidotti A, Chen Y, et al. DNA methyltransferases1 (DNMT1) and 3a (DNMT3a) colocalize with GAD67-positive neurons in the GAD67-GFP mouse brain. J Comp Neurol. 2012. June 15;520(9):1951–1964. PubMed PMID: 22134929; PubMed Central PMCID: PMC3890098. [DOI] [PMC free article] [PubMed] [Google Scholar]
- 112.Hutnick LK, Golshani P, Namihira M, et al. DNA hypomethylation restricted to the murine forebrain induces cortical degeneration and impairs postnatal neuronal maturation. Hum Mol Genet. 2009. August 01;18(15):2875–2888. PubMed PMID: 19433415; PubMed Central PMCID: PMC2706688. [DOI] [PMC free article] [PubMed] [Google Scholar]
- 113.Fan G, Martinowich K, Chin MH, et al. DNA methylation controls the timing of astrogliogenesis through regulation of JAK-STAT signaling. Development. 2005. August;132(15):3345–3356. PubMed PMID: 16014513. [DOI] [PubMed] [Google Scholar]
- 114.Hatanaka Y, Zhu Y, Torigoe M, et al. From migration to settlement: the pathways, migration modes and dynamics of neurons in the developing brain. Proc Japan Acad Ser B, Phys Biological Sciences. 2016;92(1):1–19. PubMed PMID: 26755396; PubMed Central PMCID: PMC4880546. [DOI] [PMC free article] [PubMed] [Google Scholar]
- 115.Guo J, Anton ES. Decision making during interneuron migration in the developing cerebral cortex. Trends Cell Biol. 2014. June;24(6):342–351. . PubMed PMID: 24388877; PubMed Central PMCID: PMC4299592. [DOI] [PMC free article] [PubMed] [Google Scholar]
- 116.Peyre E, Silva CG, Nguyen L. Crosstalk between intracellular and extracellular signals regulating interneuron production, migration and integration into the cortex. Front Cell Neurosci. 2015;9:129 PubMed PMID: 25926769; PubMed Central PMCID: PMC4396449. [DOI] [PMC free article] [PubMed] [Google Scholar]
- 117.Hernandez-Miranda LR, Parnavelas JG, Chiara F. Molecules and mechanisms involved in the generation and migration of cortical interneurons. ASN Neuro. 2010. March 31;2(2):e00031 . PubMed PMID: 20360946; PubMed Central PMCID: PMC2847827. [DOI] [PMC free article] [PubMed] [Google Scholar]
- 118.Friocourt G, Liu JS, Antypa M, et al. Both doublecortin and doublecortin-like kinase play a role in cortical interneuron migration. J Neuroscience: Official Journal Soc Neurosci. 2007. April 04;27(14):3875–3883. PubMed PMID: 17409252. [DOI] [PMC free article] [PubMed] [Google Scholar]
- 119.Britto JM, Johnston LA, Tan SS. The stochastic search dynamics of interneuron migration. Biophys J. 2009. August 05;97(3):699–709. . PubMed PMID: 19651028; PubMed Central PMCID: PMC2718142. [DOI] [PMC free article] [PubMed] [Google Scholar]
- 120.Martini FJ, Valiente M, Lopez Bendito G, et al. Biased selection of leading process branches mediates chemotaxis during tangential neuronal migration. Development. 2009. January;136(1):41–50. PubMed PMID: 19060332. [DOI] [PubMed] [Google Scholar]
- 121.Steinecke A, Gampe C, Nitzsche F, et al. DISC1 knockdown impairs the tangential migration of cortical interneurons by affecting the actin cytoskeleton. Front Cell Neurosci. 2014;8:190 PubMed PMID: 25071449; PubMed Central PMCID: PMC4086047. [DOI] [PMC free article] [PubMed] [Google Scholar]
- 122.Tielens S, Huysseune S, Godin JD, et al. Elongator controls cortical interneuron migration by regulating actomyosin dynamics. Cell Res. 2016. October;26(10):1131–1148. PubMed PMID: 27670698; PubMed Central PMCID: PMC5113307. [DOI] [PMC free article] [PubMed] [Google Scholar]
- 123.Maekawa M, Ishizaki T, Boku S, et al. Signaling from rho to the actin cytoskeleton through protein kinases ROCK and LIM-kinase. Science. 1999. August 6;285(5429):895–898. PubMed PMID: WOS:000081860900051; English. [DOI] [PubMed] [Google Scholar]
- 124.Schmandke A, Schmandke A, Strittmatter SM. ROCK and Rho: biochemistry and neuronal functions of rho-associated protein kinases. Neuroscientist. 2007. October;13(5):454–469. . PubMed PMID: WOS:000249763300013; English. [DOI] [PMC free article] [PubMed] [Google Scholar]
- 125.Besson A, Gurian-West M, Schmidt A, et al. p27(Kip1) modulates cell migration through the regulation of RhoA activation. Genes Dev. 2004. April 15;18(8):862–876. PubMed PMID: WOS:000221028500003; English. [DOI] [PMC free article] [PubMed] [Google Scholar]
- 126.Godin JD, Thomas N, Laguesse S, et al. p27(KiP1) Is a Microtubule-Associated Protein that Promotes Microtubule Polymerization during Neuron Migration. Dev Cell. 2012. October 16;23(4):729–744. PubMed PMID: WOS:000310036200010; English. [DOI] [PubMed] [Google Scholar]
- 127.Zhao ZS, Manser E. PAK and other Rho-associated kinases - effectors with surprisingly diverse mechanisms of regulation. Biochem J. 2005. March 1;386:201–214. [DOI] [PMC free article] [PubMed] [Google Scholar]
- 128.Zhao ZS, Manser E. PAK family kinases: physiological roles and regulation. Cell Logist. 2012. April 01;2(2):59–68. . PubMed PMID: 23162738; PubMed Central PMCID: PMC3490964. [DOI] [PMC free article] [PubMed] [Google Scholar]
- 129.Sharma A, Klein SS, Barboza L, et al. Principles Governing DNA Methylation during Neuronal Lineage and Subtype Specification. J Neuroscience: Official Journal Soc Neurosci. 2016. February 3;36(5):1711–1722. PubMed PMID: 26843651; PubMed Central PMCID: PMC4737779. [DOI] [PMC free article] [PubMed] [Google Scholar]
- 130.Clements EG, Mohammad HP, Leadem BR, et al. DNMT1 modulates gene expression without its catalytic activity partially through its interactions with histone-modifying enzymes. Nucleic Acids Res. 2012. May;40(10):4334–4346. PubMed PMID: 22278882; PubMed Central PMCID: PMC3378872. [DOI] [PMC free article] [PubMed] [Google Scholar]
- 131.Milutinovic S, Brown SE, Zhuang Q, et al. DNA methyltransferase 1 knock down induces gene expression by a mechanism independent of DNA methylation and histone deacetylation. J Biol Chem. 2004. July 2;279(27):27915–27927. PubMed PMID: 15087453. [DOI] [PubMed] [Google Scholar]
- 132.Espada J, Peinado H, Lopez-Serra L, et al. Regulation of SNAIL1 and E-cadherin function by DNMT1 in a DNA methylation-independent context. Nucleic Acids Res. 2011. November;39(21):9194–9205. PubMed PMID: 21846773; PubMed Central PMCID: PMC3241660. [DOI] [PMC free article] [PubMed] [Google Scholar]
- 133.Kondo Y. Epigenetic cross-talk between DNA methylation and histone modifications in human cancers. Yonsei Med J. 2009. August 31;50(4):455–463. . PubMed PMID: 19718392; PubMed Central PMCID: PMC2730606. [DOI] [PMC free article] [PubMed] [Google Scholar]
- 134.Cheng X. Structural and functional coordination of DNA and histone methylation. Cold Spring Harb Perspect Biol. 2014. August 1;6(8). PubMed PMID: 25085914; PubMed Central PMCID: PMC4107986. doi: 10.1101/cshperspect.a018747. [DOI] [PMC free article] [PubMed] [Google Scholar]
- 135.Barrera LO, Li Z, Smith AD, et al. Genome-wide mapping and analysis of active promoters in mouse embryonic stem cells and adult organs. Genome Res. 2008. January;18(1):46–59. PubMed PMID: 18042645; PubMed Central PMCID: PMC2134779. [DOI] [PMC free article] [PubMed] [Google Scholar]
- 136.Guenther MG, Jenner RG, Chevalier B, et al. Global and Hox-specific roles for the MLL1 methyltransferase. Proc Natl Acad Sci U S A. 2005. June 14;102(24):8603–8608. PubMed PMID: 15941828; PubMed Central PMCID: PMC1150839. [DOI] [PMC free article] [PubMed] [Google Scholar]
- 137.Guenther MG, Levine SS, Boyer LA, et al. A chromatin landmark and transcription initiation at most promoters in human cells. Cell. 2007. July 13;130(1):77–88. PubMed PMID: 17632057; PubMed Central PMCID: PMC3200295. [DOI] [PMC free article] [PubMed] [Google Scholar]
- 138.Li F, Wan M, Zhang B, et al. Bivalent Histone Modifications and Development. Curr Stem Cell Res Ther. 2018;13(2):83–90. PubMed PMID: 28117006. [DOI] [PubMed] [Google Scholar]
- 139.Van Kruijsbergen I, Hontelez S, Veenstra GJ. Recruiting polycomb to chromatin. Int J Biochem Cell Biol. 2015. October;67:177–187. PubMed PMID: 25982201; PubMed Central PMCID: PMC4564301. [DOI] [PMC free article] [PubMed] [Google Scholar]
- 140.Shen X, Liu Y, Hsu YJ, et al. EZH1 mediates methylation on histone H3 lysine 27 and complements EZH2 in maintaining stem cell identity and executing pluripotency. Mol Cell. 2008. November 21;32(4):491–502. PubMed PMID: 19026780; PubMed Central PMCID: PMC2630502. [DOI] [PMC free article] [PubMed] [Google Scholar]
- 141.Margueron R, Li G, Sarma K, et al. Ezh1 and Ezh2 maintain repressive chromatin through different mechanisms. Mol Cell. 2008. November 21;32(4):503–518. PubMed PMID: 19026781; PubMed Central PMCID: PMC3641558. [DOI] [PMC free article] [PubMed] [Google Scholar]
- 142.Hoffmann MJ, Engers R, Florl AR, et al. Expression changes in EZH2, but not in BMI-1, SIRT1, DNMT1 or DNMT3B are associated with DNA methylation changes in prostate cancer. Cancer Biol Ther. 2007. September;6(9):1403–1412. PubMed PMID: 18637271. [DOI] [PubMed] [Google Scholar]
- 143.Fiskus W, Buckley K, Rao R, et al. Panobinostat treatment depletes EZH2 and DNMT1 levels and enhances decitabine mediated de-repression of JunB and loss of survival of human acute leukemia cells. Cancer Biol Ther. 2009. May;8(10):939–950. PubMed PMID: 19279403; PubMed Central PMCID: PMC2775142. [DOI] [PMC free article] [PubMed] [Google Scholar]
- 144.Wu X, Gong Y, Yue J, et al. Cooperation between EZH2, NSPc1-mediated histone H2A ubiquitination and Dnmt1 in HOX gene silencing. Nucleic Acids Res. 2008. June;36(11):3590–3599. PubMed PMID: 18460542; PubMed Central PMCID: PMC2441805. [DOI] [PMC free article] [PubMed] [Google Scholar]
- 145.Juan AH, Kumar RM, Marx JG, et al. Mir-214-dependent regulation of the polycomb protein Ezh2 in skeletal muscle and embryonic stem cells. Mol Cell. 2009. October 9;36(1):61–74. PubMed PMID: 19818710; PubMed Central PMCID: PMC2761245. [DOI] [PMC free article] [PubMed] [Google Scholar]
- 146.Chen BF, Suen YK, Gu S, et al. A miR-199a/miR-214 self-regulatory network via PSMD10, TP53 and DNMT1 in testicular germ cell tumor. Sci Rep. 2014. September 18;4:6413 PubMed PMID: 25231260; PubMed Central PMCID: PMC4166711. [DOI] [PMC free article] [PubMed] [Google Scholar]
- 147.Holoch D, Margueron R. Mechanisms Regulating PRC2 Recruitment and Enzymatic Activity. Trends Biochem Sci. 2017. July;42(7):531–542. . PubMed PMID: 28483375. [DOI] [PubMed] [Google Scholar]
- 148.Ba MC, Long H, Cui SZ, et al. Long noncoding RNA LINC00673 epigenetically suppresses KLF4 by interacting with EZH2 and DNMT1 in gastric cancer. Oncotarget. 2017. November 10;8(56):95542–95553. PubMed PMID: 29221147; PubMed Central PMCID: PMC5707041. [DOI] [PMC free article] [PubMed] [Google Scholar]
- 149.Sun M, Nie F, Wang Y, et al. LncRNA HOXA11-AS Promotes Proliferation and Invasion of Gastric Cancer by Scaffolding the Chromatin Modification Factors PRC2, LSD1, and DNMT1. Cancer Res. 2016. November 1;76(21):6299–6310. PubMed PMID: 27651312. [DOI] [PubMed] [Google Scholar]
- 150.Hatta M, Naganuma K, Kato K, et al. 3-Deazaneplanocin A suppresses aggressive phenotype-related gene expression in an oral squamous cell carcinoma cell line. Biochem Biophys Res Commun. 2015. December 4–11;468(1–2):269–273. PubMed PMID: 26505792. [DOI] [PubMed] [Google Scholar]
- 151.Choudhury SR, Balasubramanian S, Chew YC, et al. (-)-Epigallocatechin-3-gallate and DZNep reduce polycomb protein level via a proteasome-dependent mechanism in skin cancer cells. Carcinogenesis. 2011. October;32(10):1525–1532. PubMed PMID: 21798853; PubMed Central PMCID: PMC3179425. [DOI] [PMC free article] [PubMed] [Google Scholar]
- 152.Zimmer G, Rudolph J, Landmann J, et al. Bidirectional ephrinB3/EphA4 signaling mediates the segregation of medial ganglionic eminence- and preoptic area-derived interneurons in the deep and superficial migratory stream. J Neuroscience: Official Journal Soc Neurosci. 2011. December 14;31(50):18364–18380. PubMed PMID: 22171039. [DOI] [PMC free article] [PubMed] [Google Scholar]
- 153.Haring M, Offermann S, Danker T, et al. Chromatin immunoprecipitation: optimization, quantitative analysis and data normalization. Plant Methods. 2007. September 24;3:11 PubMed PMID: 17892552; PubMed Central PMCID: PMC2077865. [DOI] [PMC free article] [PubMed] [Google Scholar]
- 154.Madisen L, Zwingman TA, Sunkin SM, et al. A robust and high-throughput Cre reporting and characterization system for the whole mouse brain. Nat Neurosci. 2010. January;13(1):133–140. PubMed PMID: 20023653; PubMed Central PMCID: PMC2840225. [DOI] [PMC free article] [PubMed] [Google Scholar]
- 155.Jackson-Grusby L, Beard C, Possemato R, et al. Loss of genomic methylation causes p53-dependent apoptosis and epigenetic deregulation. Nat Genet. 2001. January;27(1):31–39. PubMed PMID: 11137995. [DOI] [PubMed] [Google Scholar]
Associated Data
This section collects any data citations, data availability statements, or supplementary materials included in this article.