Abstract
Balanced bacterial communities within the gastrointestinal (GI) tract of animals are a key component of gut health, resulting in optimal performance and the prevention of disease. The purpose of this study was to characterize the commercial pig’s baseline bacterial microbiome over time and across anatomical site. Several anatomical sites (duodenum/jejunum, ileum, cecum, and colon) were examined across multiple ages (days 0, 10, 21, 33, 62, 84, and market) for bacterial microbiome structure using 16S rRNA V4 region sequencing with Illumina MiSeq. General trends in the succession of the bacterial microbiome were observed over age, such as increasing populations of Clostridia and decreasing populations of Gammaproteobacteria (P < 0.05). However, apparent disruptions in the microbiome were also observed that did not follow these trends, specifically at sampling 24 h post-weaning where Lactobacillaceae were drastically reduced in relative abundance (P < 0.05). The introduction of solid feed between days 21 and 33 had the greatest overall impact on bacterial community structure as compared with the effects of age, changes in solid feed type, and pig movement. A core bacterial microbiome was identified across all anatomical sites consisting of the dominant operational taxonomic units (OTUs); samples were only differentiated based upon anatomical site when considering less abundant OTUs and differences in relative abundance. When considering mucosal vs. digesta samples from the cecum and ileum, several taxa were of significantly higher relative abundance in the mucosa (P < 0.05), including Anaerovibrio, Bacteroides, Desulfovibrio, Helicobacter, Oscillospira, Phascolarctobacterium, and Prevotella. Correlations between several genus-level taxa and pig weight were observed. Overall, this study provides an expanded view of the dynamic pig GI microbiome from farrow to finish.
Keywords: bacterial community, longitudinal, microbiome, swine
INTRODUCTION
Gastrointestinal (GI) bacterial populations are critically important toward successfully raising animals for food production, particularly in commercial operations where concentrated populations of animals are housed, and limited subtherapeutic antibiotics are used. In swine, a number of disease issues are associated with bacterial perturbations (Wills, 2000). A great deal is known about the bacterial pathogens causing these diseases, their prevention, and their treatment. However, much less is known regarding the commensal bacterial communities that exist across the porcine GI tract, and how these communities change over time.
Studies examining the bacterial communities of production animals (often referred to as the microbiome) have increased dramatically with the advent of low-cost and high-throughput sequencing technologies (Yeoman and White, 2014). However, a limitation of such studies that still remains is the collection of samples. In animals such as poultry, it is relatively easier to sacrifice animals and collect gut tissue sections without major costs or time constraints. However, commercial pigs are expensive to raise, have a longer growth cycle from birth to market, and are difficult to handle. Thus, a number of studies have examined fecal bacterial community composition and diversity over time in the growing pig, but few if any have examined them across multiple sites in the GI tract throughout the lifespan of the commercial pig (Kim et al., 2011; Lamendella et al., 2011; Kim et al., 2012; Looft et al., 2012; Alain et al., 2014; Frese et al., 2015; Mach et al., 2015). Here, we sought to determine bacterial community succession throughout the productive lifetime of the commercial pig fed antibiotic-free diets across four sites in the gut, and evaluate taxonomic differences of mucosa-associated bacteria and the bacteria residing in the intestinal digesta of healthy pigs fed diets containing no antibiotics.
MATERIALS AND METHODS
All animals in this experiment were treated according to the recommendations of The Guide for Care and Use of Agricultural Animals in Agricultural Research and Teaching (Consortium, 1988).
Animal, Diet, and Experimental Design
A total of 392 piglets from 40 litters (parity 1 to 4, Choice Genetics, EBX Ultra boar × line 33 female) from a single farrowing group were used in this experiment. The trial was performed from birth to market weight (approximately 131 kg BW and 154 d of age). Sows and pigs were monitored and recorded daily for general health conditions. No creep feed was offered prior to weaning. At weaning (19 to 20 d of age), pigs were blocked by weaning BW and allotted to pens (6 to 7 pigs/pen; equalized gender among pens within blocks; 14 blocks; 56 pens total). Pigs were housed in a nursery facility for 44 d and followed a four-phase (PH) feeding program (PH1: day 0 to 8, PH2: day 8 to 22, PH3: day 22 to 32, and PH4: day 32 to 44 post-weaning). At the end of the nursery period (day 44 post-weaning or approximately 63 d of age), pigs were blocked by BW and gender and re-allotted to pens (4 to 5 pig/pen; 15 blocks; 60 pens total) before being moved to a growing–finishing building and raised there until they reached market weight. During the growing–finishing period, pigs were fed a four-phase feeding program (PH1: day 0 to 21, PH2: day 21 to 42, PH3: day 42 to 63, and PH4: day 63 to 91). Diets were changed at the end of each feeding phase. During PH1 to 3 of the nursery period, pigs were fed semi-complex diets in pelleted form with total Lys of 1.58, 1.50, and 1.40 and ME of 3,421, 3,460, and 3,377 kcal/kg in phase 1 to 3, respectively. During PH4 of the nursery period, pigs were fed a corn–soybean–DDGS-based diet (1.27% total Lys and ME of 3,377 kcal/kg). In growing–finishing period, all diets were corn-soybean-DDGS based with total Lys of 1.13%, 1.02%, 0.88%, and 0.75% and ME of 3,317, 3,339, 3,338, and 3,399 kcal/kg in phase 1 to 4, respectively. All growing–finishing diets were in meal form. Copper was added at 200 ppm in all nursery diets and at 150 ppm in growing–finishing PH1 diet. A pharmaceutical level of Zn was added in nursery diets at 3,500 and 2,000 ppm, respectively, for PH1 and 2. No diets contained antibiotics and all were formulated to meet or exceed the NRC (2012) requirements. Pigs were allowed ad libitum access to feed and water during the entire experiment.
Intestinal Digesta and Mucosa Sample Collection
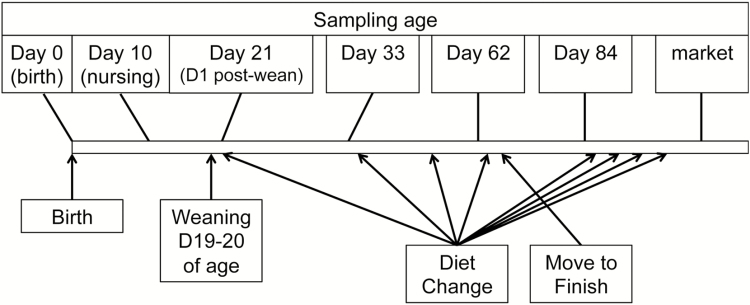
Intestinal digesta (from duodenum, jejunum, ileum, cecum, and colon) and mucosa (from duodenum, jejunum, ileum, and cecum) samples of pig GI tract were collected at seven time points, including day 0 (at birth), day 10, day 21, day 33, day 62, and day 84 of age, and at market (approximately on d 154 of age). Sampling points were selected for their relevance to the growth development phases of the pig (Figure 1). For example, d 10 of age was selected because it is a mid-point between birth and weaning, and pigs had only consumed the sow’s milk during this period. Day 21 of age was selected because it occurred 24 h post-weaning, which is one of the most critical and stressful periods in the pigs’ life. The process of weaning produces many challenges that the pig has not experienced before. These challenges include a new environment and social structure, and an abrupt change in diet form from a liquid to a solid feed. These changes usually disrupt feed and water intake, which are associated with a lag in growth performance, and an increase in morbidity and mortality in the nursery (van Nieuwamerongen et al., 2014). Subsequent sampling was performed at about 2 weeks post-weaning (d 33 of age) and just prior to the move (d 62 of age) to the growing–finishing building. Two final samplings were performed during the grower phase (d 84 of age) and at market (approximately 154 d of age). One healthy pig (absent from signs of clinical disease), with BW close to the pen average BW, was selected for tissue collection (n = 10 pigs for samplings on d 0, 10, and 21 of age; n = 20 pigs for samplings on d 33, 62, and 84 of age, and at market). Pigs were humanely euthanized by exposing to CO2 in the Euthanex device (for pigs at birth and 10 to 33 d of age) or using the penetrating captive bolt gun followed by exsanguination (for pigs from d 63 of age to market). Immediately after euthanization, the GI tract was removed after the pyloric and ileocecal junctions and distal colon were tied off to prevent contamination between segments. Duodenum and jejunum sections were identified as the first 55 cm posterior to the pyloric junction, where the first 15 cm was cut for duodenum and the last 15 cm was cut for jejunum collection. Distal ileum was identified as the 15 cm of intestinal tissue anterior to the ileocecal valve, and cecum sections were identified as the first 15 cm of the cecum posterior to the ileocecal valve. Finally, the 5-cm segment anterior to the start of spiral colon was sectioned for colon digesta collection. The digesta was collected from the first 5 cm of each gut section by aseptically squeezing content of the gut into a sterile tube. The mucosa was collected from the remaining 10 cm of each gut section by aseptically scraping the mucosa layer using a sterile microscope slide after rinsing off the gut content with ice-cold PBS. No colonic mucosa was collected. All samples were kept on ice from the collection until being stored at −20°C. The same sampling procedures were used for all sampling points, resulting in a total of 770 samples collected in this study (Table 1). All frozen samples were shipped overnight on ice packs to the University of Minnesota for subsequent analysis.
Figure 1.
Sampling strategy for this study relative to events potentially shaping the pig microbiome.
Table 1.
Samples collected in this study
| Age | Tissue | Digesta samples collected | Mucosa samples collected | Digesta samples analyzed | Mucosa samples analyzed |
|---|---|---|---|---|---|
| Day 0 | Cecum | 10 | 10 | 1 | 3 |
| Day 0 | Colon | 10 | 0 | 1 | 0 |
| Day 0 | Ileum | 10 | 10 | 0 | 0 |
| Day 0 | Duodenum/jejunum | 10 | 10 | 1 | 1 |
| Day 10 | Cecum | 10 | 10 | 10 | 10 |
| Day 10 | Colon | 10 | 0 | 10 | 0 |
| Day 10 | Ileum | 10 | 10 | 10 | 6 |
| Day 10 | Duodenum/jejunum | 10 | 10 | 4 | 4 |
| Day 21 | Cecum | 10 | 10 | 10 | 10 |
| Day 21 | Colon | 10 | 0 | 9 | 0 |
| Day 21 | Ileum | 10 | 10 | 3 | 4 |
| Day 21 | Duodenum/jejunum | 10 | 10 | 0 | 2 |
| Day 33 | Cecum | 20 | 20 | 17 | 20 |
| Day 33 | Colon | 20 | 0 | 17 | 0 |
| Day 33 | Ileum | 20 | 20 | 15 | 15 |
| Day 33 | Duodenum/jejunum | 20 | 20 | 4 | 3 |
| Day 62 | Cecum | 20 | 20 | 20 | 19 |
| Day 62 | Colon | 20 | 0 | 18 | 0 |
| Day 62 | Ileum | 20 | 20 | 16 | 10 |
| Day 62 | Duodenum/jejunum | 20 | 20 | 19 | 0 |
| Day 84 | Cecum | 20 | 20 | 19 | 19 |
| Day 84 | Colon | 20 | 0 | 20 | 0 |
| Day 84 | Ileum | 20 | 20 | 16 | 14 |
| Day 84 | Duodenum/jejunum | 20 | 20 | 11 | 2 |
| Market | Cecum | 20 | 20 | 20 | 19 |
| Market | Colon | 20 | 0 | 20 | 0 |
| Market | Ileum | 20 | 20 | 19 | 10 |
| Market | Duodenum/jejunum | 20 | 20 | 12 | 3 |
| Total | 440 | 330 | 322 | 174 |
Sample Processing and Sequencing
From each sample, DNA was extracted from 0.25 g of sample with bead beating using Mo Bio UltraClean-htp 96-well Microbial DNA kit (Mo Bio Laboratories, Carlsbad, CA), according to the manufacturer’s directions. DNA was quantified using PicoGreen (Invitrogen). Amplification of the 16S rRNA gene was performed using KAPA HiFidelity Hot Start Polymerase (Kapa Biosystems, Inc., Wilmington, MA) for two rounds of PCR at the University of Minnesota Genomics Center (Minneapolis, MN). For the first round, the 515F(5′- TC GTCGGCAGC GTCAGATG TGTATAAGAGACAGGTGCCAG CMG CCGCG GTAA -3′) and 806R(5′-GTCTCGTGGGCTC GGAGATGTGTA TAAGAGACAGGGACTAC HVGGGTWTCTAAT-3′). Nextera primers (Caporaso et al., 2012) (Integrated DNA Technologies, Coralville, IA) were used to amplify the V4 hypervariable region using the following cycling parameters: one cycle of 95°C for 5 min, followed by 20 cycles of 98°C for 20 seconds, 55°C for 15 seconds, and 72°C for 1 min. The products were then diluted 1:100 and 5 µL was used in a second round of PCR using forward (5′-AATGAT ACGGCGACC ACCGAGATCTACAC[i5]TCGTCGGCAGCGTC-3′) and reverse (5′-CAAGCAGAAGAC GGCATACGAGAT[i7] GTCTCGTGGGCTCGG-3′) indexing primers (Integrated DNA Technologies). The second PCR used the following cycling parameters: 1 cycle at 95°C for 5 min, followed by 10 cycles of 98°C for 20 s, 55°C for 15 s, and 72°C for 1 min. Pooled, size-selected samples were denatured with NaOH, diluted to 8 pM in Illumina’s HT1 buffer, spiked with 15% PhiX, and heat denatured at 96°C for 2 min immediately prior to loading (Gohl et al., 2016). A MiSeq 600 (2X300 bp) cycle v3 kit (Illumina, San Diego, CA) was used to sequence the samples.
Data Collection and Analyses
Growth performance (data not shown)
All pigs were weighed individually at birth (d 0), weaning (average 20 d of age), and at the end of each feeding phase. However, tissue-donating pigs were weighed immediately before euthanization (1 or 2 d before the end of each feeding phase). Only the BW of tissue-donating pigs on approximately d 33, 62, 84 of age, and at market was used for the Pearson’s and Spearman’s correlation analysis to determine correlation of pig BW and bacteria taxa at the genus level.
Sequencing analysis
Following sequencing, sequence reads were sorted by barcode to generate fastq files for each sample. Proximal and distal primers were trimmed from the sequence reads. The demultiplexed sequences were subjected to the following quality filter: 150 bp < length < 1,000 bp; average quality score > 25. Paired end reads were joined using SeqPrep in QIIME. Open referenced operational taxonomic unit (OTU) picking was performed in QIIME version 1.8.0 (Caporaso et al., 2010) using uclust (Edgar, 2010), with clustering at 97% similarity and GreenGenes 13_8 as the reference database. Potential chimeras were removed using ChimeraSlayer (Haas et al., 2011). OTUs of chloroplast origin and OTUs present in negative control amplifications were also removed prior to subsequent analysis, and OTUs with read counts of less than 10 were removed. Samples were rarefied to 5,000 high-quality reads per sample. The majority of the samples lost during this process were samples from the d 0 time point across all tissues, and jejunum or duodenum samples across all time points. Efforts were made to recover additional DNA from these samples, but were unsuccessful.
QIIME was used for assessments of alpha diversity, beta diversity using unweighted and weighted Unifrac (Lozupone and Knight, 2005), phylogenetic classifications using the Greengenes database (McDonald et al., 2012), and core bacterial community structure. Statistical differences in overall community structure were performed in RStudio version 1.0 (with R statistical package version 3.3.1) using distance matrices analyzed via the ANOSIM command in QIIME (for beta diversity) and a nonparametric two-sample t-test (for alpha diversity). Calypso was used for statistical comparisons of mucosa vs. digesta samples (Zakrzewski et al., 2016). Calypso was also used for Spearman’s and Pearson’s analysis of ileum, cecum, and colon data using pig BW as a continuous variable. For these analyses, the input biom table from QIIME was used and subjected to further filtering and normalization. Taxa present in less than 50% of samples were removed. Taxa with less than 0.01% relative abundance across samples were removed. Data were normalized using total sum normalization followed by cumulative-sum scaling and log2 transformation. Statistical comparisons of mucosa vs. digesta samples were performed using DESeq2 at the genus level using the top 300 most abundant taxa. Visualizations of data were performed using ggplot2 (Wickham, 2009), heatmap, and beeswarm functions in R. Because of low sample numbers, duodenum and jejunum were combined for taxonomic profiles and beta diversity measurements. These samples were excluded from comparisons of digesta vs. mucosa because of a lack of sufficient replication for such comparisons.
RESULTS
From 770 total samples, 496 samples were retained following removal of samples due to insufficient DNA for sequencing or low sequencing output (Table 1). Following filtering of OTUs not classified as bacteria and those classified as Cyanobacteria (which likely represented chloroplast DNA from plant material in feed), removal of OTUs with counts less than 10, and rarefying to 5,000 reads per sample, 15,756 OTUs were retained for downstream analyses.
Taxonomic Classification Reveals Disruptions in the Bacterial Community at 24 h Post-weaning
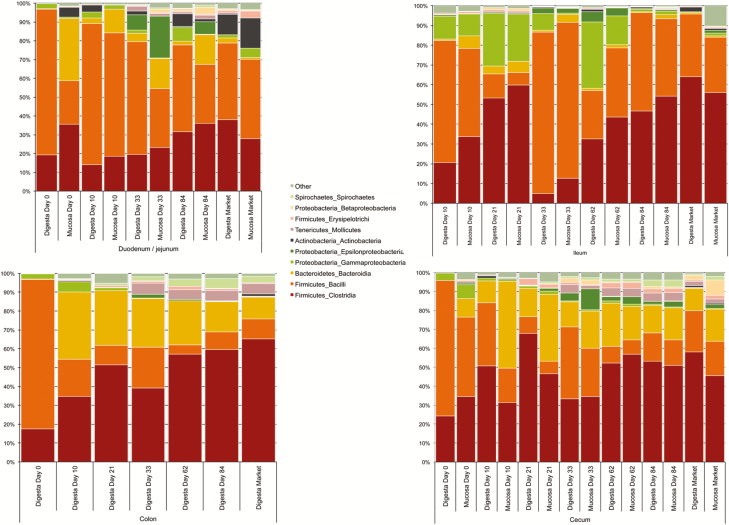
Taxonomic classification was first performed at the bacterial class level to determine broad changes occurring over time (Figure 2). This demonstrated that duodenum/jejunum and ileum samples were comprised primarily of Bacilli followed by Clostridia, with variable levels of Bacteroidia and Gammaproteobacteria occurring across ages. In the cecum and colon samples, Clostridia were of greatest numerical relative abundance at all ages sampled, followed in abundance by Bacteroidia and Bacilli. Noteworthy was that Clostridia numerically increased over age in all sample types, yet samples from d 21 of age did not fit the general trends followed by the rest of the samples. Specifically, these samples were characterized by a significant increase in Clostridia (P < 0.05) and decrease in Bacilli (P < 0.05) relative to samples at d 10 and 33 of age.
Figure 2.
Taxonomic classification at the bacterial class level of samples averaged by age and tissue.
Beta Diversity Illustrates a Major Shift in Bacterial Community Structure Following Transition from Nursing to Solid Feed
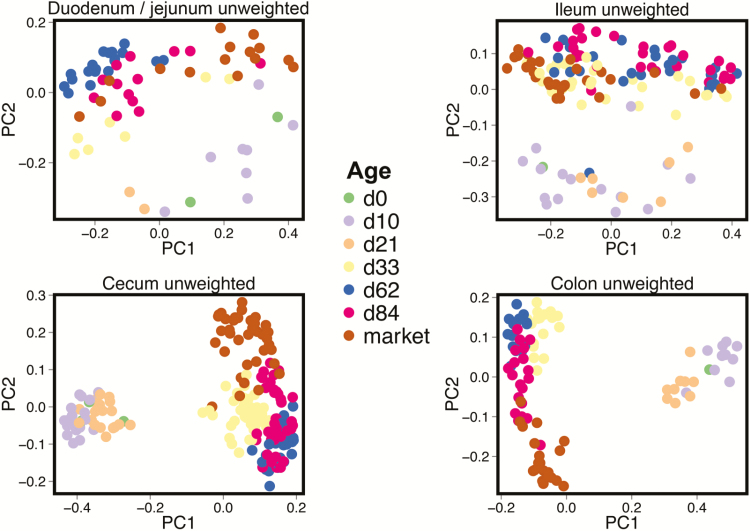
Using Unifrac distance matrices on all samples combined, a principal coordinate analysis (PCoA) was performed on samples to examine dissimilarity between samples by age (Figure 3 and Supplemental Figure 1). These plots demonstrated a clear shift in bacterial community succession by pig age (P < 0.001, R > 0.75 for all tissue comparisons). More prominent, though, was the transition from d 21 to d 33 samples corresponding to the change from sow’s milk to solid feed, observed in all anatomical sites examined. Biplot analysis of these data (Supplemental Figure 2) revealed that d 0, 10, and 21 samples were consistently separated across anatomical sites, and these differences were taxonomically driven in part by Bacteroides. In the ileum and duodenum/jejunum samples, weighted Unifrac PCoA did not display this evident shift between d 21 and 33 (Supplemental Figure 1), while in the cecum and colon samples the shift was still evident. This indicates that changes in both community membership and relative OTU abundance were present in the distal gut tissue sections, whereas OTU abundance remained relatively consistent in the proximal gut tissue sections.
Figure 3.
Principal coordinate analysis (PCoA) plots of samples grouped by tissue and colored by animal age using Unifrac unweighted distance matrices. The transition from sow’s milk to solid feed occurred between days 21 and 33 of age.
The transition from sow’s milk to solid feed involves a period of approximately 24 to 72 hr where the pigs typically eat or drink very little if any feed or water. This represents a stressful period in the life of the pig. Therefore, we assessed bacterial composition at d 21 of age compared with d 10, where d 21 samples were taken 24 h after weaning. In the colon at d 10 compared with d 21, significant increases (>2-fold change and P < 0.05) were observed in the relative abundances of class Bacteroidales, family Christensenellaceae, genus Phascolarctobacterium, family Paraprevotellaceae, genus Prevotella, and family Ruminococcaceae; significant decreases in relative abundance for family Lachnospiraceae, genus Dorea, and species Lactobacillus mucosae (>2-fold change and P < 0.05) were also observed.
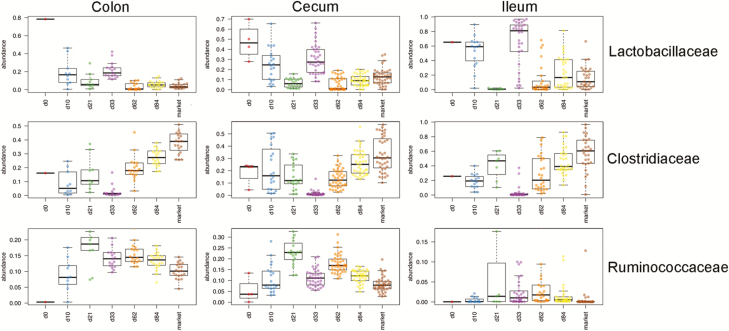
As mentioned before, the transition from d 21 to 33 of age represents the transition to solid feed. In the colon, a number of taxa were identified that were of differential relative abundance between d 21 and 33 of age. Genus-level taxa that were significantly higher in abundance at d 33 of age (>2-fold change and P < 0.05) included: Prevotella, Coprococcus, Blautia, Roseburia, Lactobacillus, Campylobacter, and Faecalibacterium. Genus-level taxa that were of significantly reduced relative abundance at d 33 included Bacteroides, Oscillospira, Escherichia/Shigella, Clostridium, and Desulfovibrio. We also examined trends over age and across multiple tissues at the bacterial family level (Figure 4). This further supported that, at d 21 of age, there were significant relative increases (P < 0.05) in Clostridiaceae or Ruminococcaceae accompanied with significant decreases in Lactobacillaceae (P < 0.05). Lactobacillaceae levels then rebounded when the pigs were adapted to the consumption of solid feed (d 33 of age), and then decreased over age.
Figure 4.
Changes in Lactobacillaceae (top), Clostridiaceae (middle), and Ruminococcaceae (bottom) across pig age in the colon (left), cecum (middle), and ileum (right).
Bacterial Community Richness and Evenness Increase in the Distal GI, But Not in the Proximal GI, As the Pig Ages
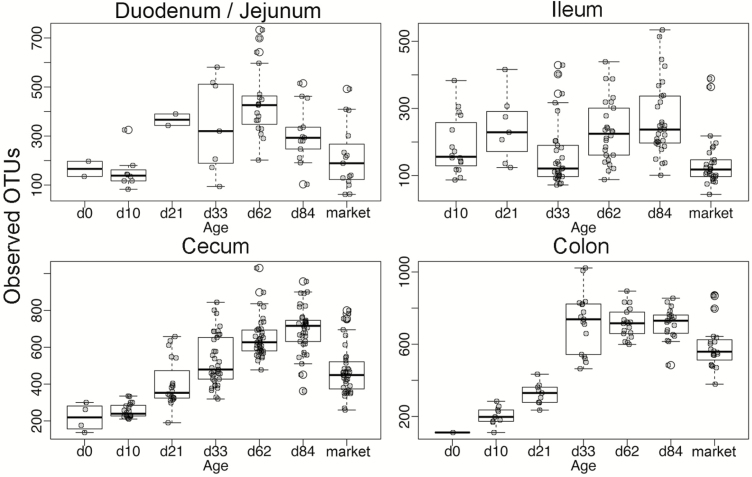
Alpha diversity was assessed across age and GI section using the following measures of diversity: Shannon, Simpson, chao1, and observed OTUs (Figure 5 and Supplemental Figures 3–5). In the distal GI (cecum and colon), numerical increases in diversity were observed through d 84 of age, with a significant decrease in diversity at market age (P < 0.05). In the proximal GI (duodenum/jejunum and ileum), diversity was numerically variable across ages although a significant decrease in diversity was again observed at market age (P < 0.05).
Figure 5.
Alpha diversity assessments of samples grouped by tissue and divided by age using number of observed OTUs.
Dominant OTUs Are Present Across All Tissue Types, Whereas Less Abundant OTUs Defined Tissue Differences
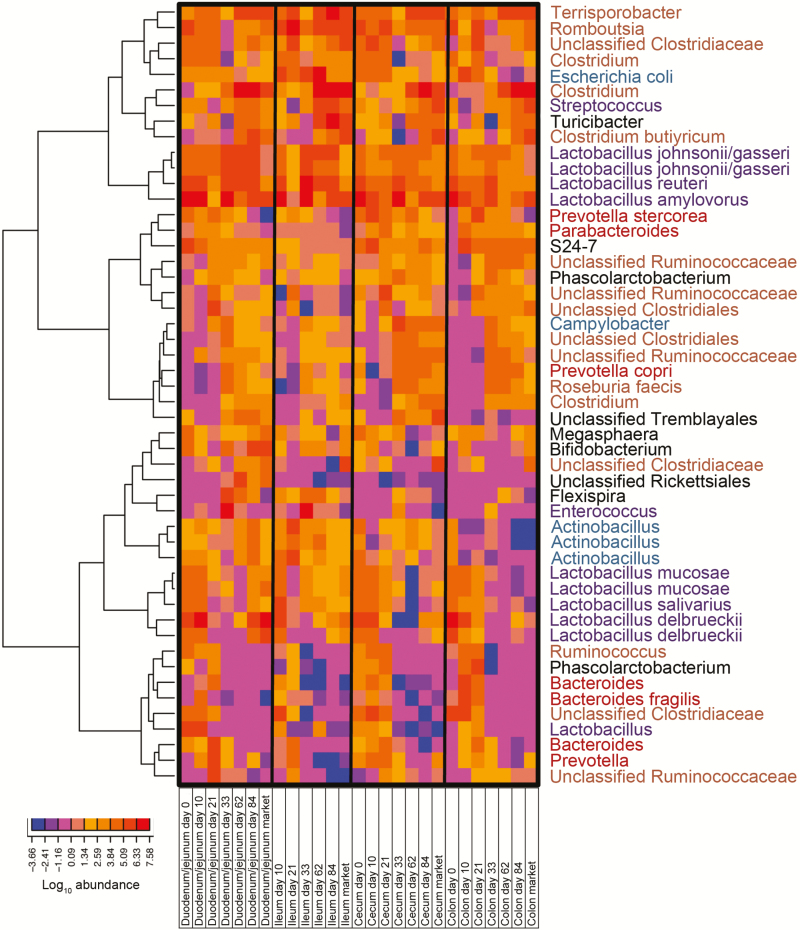
OTU-level analyses were performed to determine the species-level composition of the bacterial communities across GI sites and age, using all samples combined. When considering the top 50 most abundant OTUs across all samples, they included those classified as a variety of Lactobacillus species (L. johnsonii/gasseri, L. reuteri, L. amylovorus, L. mucosae, L. salivarius, and L. delbrueckii) and numerous OTUs classified within class Clostridia (Terrisporobacter, Romboutsia, and Clostridium) (Figure 6). These dominant OTUs were present across all GI sites in similar abundance. Moreover, the most abundant OTUs had similar patterns of change over age across all GI sites examined, and hierarchical clustering (data not shown) was unable to differentiate between tissue and age using only these dominant OTUs. This suggests a dominant bacterial community that exists throughout the GI tract irrespective of site.
Figure 6.
Heatmap depicting top 50 most abundant OTUs across all samples in this study. OTUs were classified using the Greengenes database, followed by nucleotide BLAST against reference genomes where appropriate. Samples are averaged by anatomical site (duodenum/jejunum, ileum, cecum, colon) and age (day 0, 10, 21, 33, 62, 84, and market). Values on the x-axis are given in log10 format and colored accordingly in the heatmap. Unsupervised hierarchical clustering was performed using the Ward method.
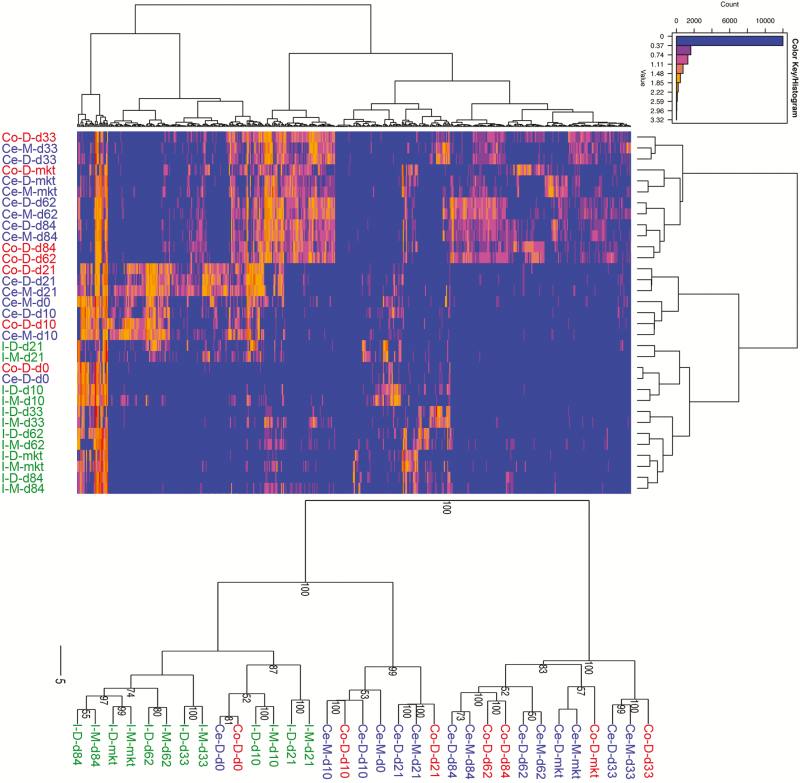
When the top 500 most abundant OTUs were examined splitting out mucosa and digesta samples (Figure 7), distinctions were observed across age and GI sites. In particular, cecum and colon samples from older pigs (d 33 through market) clearly separated from the ileum samples of similar age. Also evident were the co-clustering of cecum and ileum samples, and co-clustering of mucosal and digesta samples from the same GI site and age.
Figure 7.
Top: Heatmap depicting top 500 most abundant OTUs across all samples in this study. Samples are averaged by anatomical site (I = ileum, Ce = cecum, Co = colon) and age (day 0, 10, 21, 33, 62, 84, and market). Values on the x-axis are given in log10 format and colored accordingly in the heatmap. Unsupervised hierarchical clustering was performed using the Ward method. Bottom: Unsupervised hierarchical clustering using the Ward method on the same data, with 100 bootstrap replicates.
Differences Between Mucosa and Digesta Contents
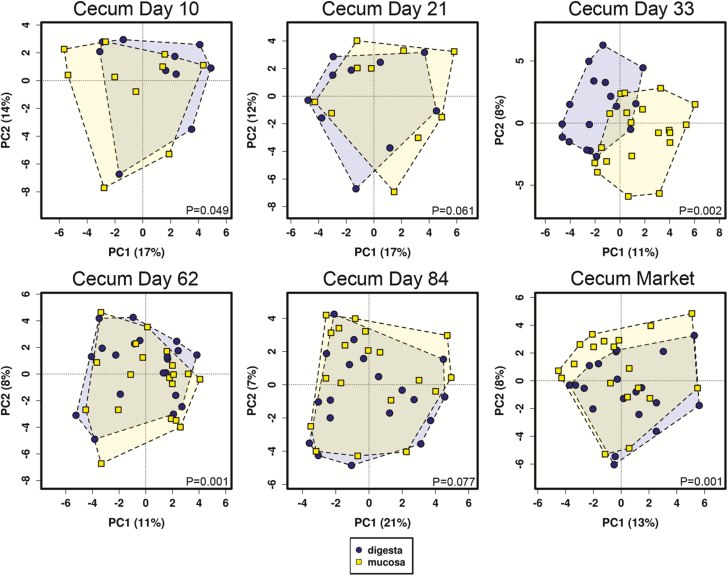
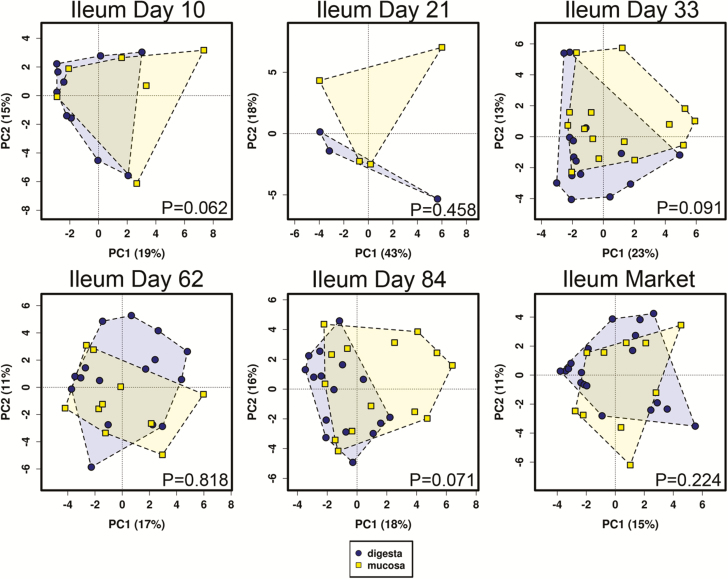
Differences between digesta and mucosa samples matched for GI site and age were analyzed for ileum and cecal tissues (Figures 8 and 9). At the bacterial community level using beta diversity metrics, several mucosa–digesta comparisons were significantly different in the cecum (P < 0.05), including days 10, 33, 62, and market. No significant differences in beta diversity between digesta and mucosa were observed in the ileum. Numerous taxa were identified across multiple ages in one or more GI sites that were of significantly higher (P < 0.01) relative abundance in mucosal vs. digesta tissue (Table 2). Among these included Anerovibrio, Bacteroides, Desulfovibrio, Helicobacter, Oscillospira, Phascolarctobacterium, Mucispirillum, and Prevotella.
Figure 8.
Principal component analysis of digesta versus mucosal samples in the pig cecum across age. P values using ANOSIM are depicted in lower right of each plot.
Figure 9.
Principal component analysis of digesta versus mucosal samples in the pig ileum across age. P values using ANOSIM are depicted in lower right of each plot.
Table 2.
Taxa (genus level) differing in relative abundance between digesta and mucosa samples
| Age | Tissue | Genus | P (DESeq2) | Adjusted P (Bonferroni) | Digesta mean | Mucosa mean |
|---|---|---|---|---|---|---|
| Day 10 | Cecum | Prevotella | 0.0000006 | 0.000039 | 1.73 | 13.91 |
| Desulfovibrio | 0.00000074 | 0.000048 | 0.012 | 0.42 | ||
| Streptococcus | 0.000084 | 0.0055 | 1.1 | 0.26 | ||
| Unclassified Clostridiaceae | 0.00015 | 0.0098 | 19.44 | 5.69 | ||
| Clostridium | 0.00026 | 0.017 | 5.34 | 1.64 | ||
| Bacteroides | 0.00045 | 0.029 | 1.47 | 11.43 | ||
| Oscillospira | 0.00045 | 0.029 | 1.38 | 4.7 | ||
| Day 21 | Cecum | Desulfovibrio | 1.9E-12 | 1.7E-10 | 0.022 | 0.49 |
| Bacteroides | 0.000043 | 0.0038 | 1.93 | 7.67 | ||
| Sphaerochaeta | 0.000044 | 0.0038 | 0.062 | 0.32 | ||
| Bilophila | 0.00023 | 0.02 | 0.006 | 0.11 | ||
| Unclassified Bacteroidales | 0.00049 | 0.043 | 1.34 | 4.34 | ||
| Day 33 | Ileum | Unclassified Enterobacteriaceae | 0.0000035 | 0.00024 | 6.86 | 0.049 |
| Anaerovibrio | 0.00016 | 0.01 | 0.0013 | 0.28 | ||
| Unclassified Lactobacillales | 0.00018 | 0.012 | 22.49 | 4.31 | ||
| Cecum | Anaerovibrio | 1.3E-12 | 9.5E-11 | 0.14 | 3.18 | |
| Desulfovibrio | 3.3E-10 | 0.000000025 | 0.047 | 0.76 | ||
| Unclassified Helicobacteraceae | 0.00000043 | 0.000032 | 0.77 | 1.16 | ||
| Sutterella | 0.0000033 | 0.00024 | 0.026 | 0.21 | ||
| Unclassified Lachnospiraceae | 0.000006 | 0.00044 | 0.88 | 2.27 | ||
| Prevotella | 0.000023 | 0.0017 | 7.78 | 14.74 | ||
| Unclassified Clostridiales | 0.000037 | 0.0027 | 11.53 | 6.39 | ||
| Mitsuokella | 0.000068 | 0.0051 | 0.055 | 0.3 | ||
| Unclassified RF39 | 0.00016 | 0.012 | 4.29 | 1.67 | ||
| Actinobacillus | 0.0002 | 0.015 | 0.38 | 0.27 | ||
| Unclassified Coriobacteriaceae | 0.00023 | 0.017 | 0.53 | 0.19 | ||
| Megasphaera | 0.00025 | 0.019 | 0.068 | 0.51 | ||
| Ruminococcus | 0.00045 | 0.033 | 2.42 | 1.13 | ||
| Unclassified F16 | 0.00047 | 0.034 | 0.24 | 0.037 | ||
| Roseburia | 0.00055 | 0.04 | 1.36 | 3.93 | ||
| Phascolarctobacterium | 0.00059 | 0.044 | 1.08 | 2.54 | ||
| Unclassified Erysipelotrichaceae | 0.00063 | 0.046 | 0.2 | 0.056 | ||
| Day 62 | Ileum | Chlamydia | 0.0013 | 0.092 | 0.75 | 0.13 |
| Pseudomonas | 0.0024 | 0.16 | 0.0038 | 0.37 | ||
| Campylobacter | 0.0027 | 0.19 | 2.04 | 0.47 | ||
| Unclassified Enterobacteriaceae | 0.0037 | 0.26 | 31.13 | 10.45 | ||
| Cecum | Oscillospira | 4.2E-10 | 0.000000032 | 0.36 | 0.81 | |
| SMB53 | 7.7E-09 | 0.00000059 | 0.34 | 0.092 | ||
| Unclassified | 0.0000028 | 0.00021 | 8.14 | 3.96 | ||
| Desulfovibrio | 0.0000063 | 0.00048 | 0.046 | 0.21 | ||
| Unclassified Helicobacteraceae | 0.000032 | 0.0024 | 0.19 | 0.49 | ||
| Anaerovibrio | 0.000043 | 0.0033 | 0.023 | 0.14 | ||
| Turicibacter | 0.00015 | 0.012 | 1.97 | 0.74 | ||
| Flexispira | 0.00023 | 0.017 | 0.006 | 0.082 | ||
| Day 84 | Ileum | Pseudomonas | 4.6E-12 | 3.2E-10 | 0 | 1.09 |
| Mucispirillum | 0.0000089 | 0.00063 | 0.0025 | 0.15 | ||
| Unclassified Ruminococcaceae | 0.000026 | 0.0018 | 0.4 | 2.16 | ||
| Corynebacterium | 0.00015 | 0.01 | 0.3 | 0.072 | ||
| Chlamydia | 0.00021 | 0.015 | 0.07 | 0.0043 | ||
| Oscillospira | 0.00038 | 0.027 | 0.026 | 0.2 | ||
| Sphaerochaeta | 0.00062 | 0.044 | 0.029 | 0.36 | ||
| Cecum | Unclassified Helicobacteraceae | 0.000000013 | 0.0000011 | 0.032 | 0.67 | |
| Mucispirillum | 0.00000061 | 0.000049 | 0.18 | 1.26 | ||
| Flexispira | 0.0000075 | 0.00061 | 0.0074 | 0.1 | ||
| Sutterella | 0.000036 | 0.0029 | 0.0063 | 0.053 | ||
| Succinivibrio | 0.000084 | 0.0068 | 0.1 | 0.47 | ||
| Unclassified Desulfovibrionaceae | 0.00041 | 0.033 | 0.0011 | 0.024 | ||
| Market | Ileum | Staphylococcus | 0.00036 | 0.026 | 0.0042 | 0.028 |
| Cecum | Unclassified Ruminococcaceae | 0.000000002 | 0.00000016 | 4.69 | 8.49 | |
| RFN20 | 4.7E-09 | 0.00000036 | 0.041 | 0.25 | ||
| Sphaerochaeta | 0.00000012 | 0.000009 | 0.16 | 1.01 | ||
| Unclassified Helicobacteraceae | 0.00000082 | 0.000064 | 0.003 | 0.11 | ||
| Unclassified | 0.000035 | 0.0027 | 13.15 | 6.44 | ||
| Oscillospira | 0.000035 | 0.0028 | 0.25 | 0.52 | ||
| Unclassified RF32 | 0.000039 | 0.0031 | 0.01 | 0.06 | ||
| Mucispirillum | 0.00013 | 0.01 | 0.004 | 0.076 | ||
| Campylobacter | 0.00015 | 0.012 | 0.28 | 1.81 | ||
| Parabacteroides | 0.00019 | 0.015 | 0.11 | 0.37 | ||
| Chlamydia | 0.00024 | 0.019 | 0.028 | 0.24 | ||
| Unclassified Anaeroplasmataceae | 0.00034 | 0.027 | 0.09 | 0.29 | ||
| Bacteroides | 0.00049 | 0.038 | 0.056 | 0.17 |
Correlation of Bacterial Taxa and Pig BW
Correlations were sought between pig BW and microbial community structure using beta diversity metrics, and no significant associations were identified. Categorical division of the pig BW similarly did not identify significant associations using beta diversity metrics. Pearson’s and Spearman’s correlations were then used to identify genus-level taxa that were concordant with pig BW. Several taxa were identified using this approach (Table 3). Taxa (genus-level) positively correlated to BW at multiple time points or GI sites were unclassified Bacteroidales, Prevotella, and unclassified Veillonellaceae. However, no discernable patterns were evident over time or across anatomical sites for other taxa.
Table 3.
Bacteria taxa (genus level) correlated with weight gain (P < 0.05)
| Age | Tissue | Positively correlated taxa | Negatively correlated taxa |
|---|---|---|---|
| Day 33 | Ileum | Unclassified Ruminococcaceae (0.51) | None |
| Cecum | None | Lactobacillus (−0.51) | |
| Colon |
Bulleidia (0.61) Unclassified Pirellulaceae (0.55) Unclassified Bacteroidales (0.71) |
None | |
| Day 62 | Ileum | Rothia (0.58) |
Campylobacter (−0.57) Oscillospira (−0.52) |
| Cecum | Unclassified RF16 (0.45) |
Dorea (−0.48) Blautia (−0.51) |
|
| Colon |
CF231 (0.64) Treponema (0.52) Unclassified RF16 (0.51) |
Acidaminococcus (−0.52) Eubacterium (−0.49) |
|
| Day 84 | Ileum | Unclassified F16 (0.63) Prevotella (0.59) Parabacteroides (0.53) |
Mycoplasma (−0.75) |
| Cecum | Unclassified Veillonellaceae (0.65) Unclassified Bacteroidales (0.59) |
Bifidobacterium (−0.64) Succinovibrio (−0.47) Dialister (−0.47) |
|
| Colon |
Prevotella (0.72) Unclassified Veillonellaceae (0.65) Unclassified Erysipelotrichaceae (0.51) Anaerostipes (0.51) Slackia (0.50) |
None | |
| Market | Ileum | Unclassified Enterobacteriaceae (0.51) Unclassified Bacillaceae (0.50) Megasphaera (0.48) |
Unclassified RF39 (−0.62) Unclassified Ruminococcaceae (−0.48) CF231 (−0.48) Unclassified S247 (−0.47) |
| Cecum | None | Unclassified RFP12 (−0.59) | |
| Colon | Unclassified F16 (0.47) | Bacteroides (−0.48) |
Spearman’s r value is listed for each association in parenthesis.
DISCUSSION
This study contributes to the increasing understanding of the swine bacterial communities of the GI tract. Not surprisingly, age was a driving factor in the succession of GI bacterial communities of pigs. The age effect was evident across all anatomical sites sampled. Interestingly, the largest shift in bacterial community structure was observed between d 21 and d 33 of age corresponding with the shift from nursing to solid feed. This observation was consistent across all GI sites examined. Others have focused on the transition from nursing to post-weaning and its effects on bacterial communities. For example, Bian et al. (2016) found that E. coli populations decreased substantially after d 7 of age in piglets, and introduction of solid feed led to diversification of the bacterial community in the feces. Frese et al. (2015) also found that the bacterial community in the feces was diversified following weaning, and that the functional metagenome transitioned from an enrichment of glycan degradation pathways acting on milk glycans toward enrichments in plant-associated glycan metabolism. Our results somewhat agree with these findings. Increasing bacterial diversity was identified over time in communities within the colon and cecum, with sharp increases following the transition to solid feed. However, the trend of increasing diversity was not observed in the ileum or duodenum/jejunum samples. Instead, diversity was more variable between samples of the same age or tissue, and there were fluctuations between timepoints. This suggests that the bacterial communities of the duodenum, jejunum, and ileum are more variable than the cecum and colon, and agrees with similar studies in other production animals (Danzeisen, 2013; Danzeisen et al., 2015). This is likely, in part, due to the physiological nature of the proximal vs. distal GI tract in animals.
With respect to specific changes in taxa, Bian et al. (2016) also identified increases in Prevotellaceae and Ruminococcaceae following weaning, corresponding with decreases in Enterobacteriaceae and Bacteroidaceae. We observed the same findings in the distal GI tract. Pajarillo et al. (2014) found that Bacteroides spp. dominated pre-weaning pigs, whereas Prevotella spp. and Lactobacillus johnsonii dominated post-weaning pigs (2 wk following weaning). Mach et al. (2015) found that Prevotella increased dramatically following weaning. We also observed high relative abundances of Bacteroidaceae at 10 d of age, and this decreased post-weaning in the distal GI tract corresponding with increases in Prevotella. Kim et al. (2011) followed commercial pigs aged 10 to 22 wk and reported that the fecal bacterial community over this time frame displayed relative increases in class Clostridia, the dominant bacterial class, and decreases in Bacteroidia, the second most dominant class. We also observed increases in Clostsridia over time. Overall, this study and previous studies are mainly in concordance regarding the dominant bacterial classes and families over age.
A potentially important finding of this study is that the relative abundance of Lactobacillaceae decreased dramatically at d 21 of age, then increased dramatically in subsequent d 33 samples. Day 21 samples represented sampling at 24 h post-weaning, when pigs were exposed to solid feed. However, voluntary feed and water intake decreases during the first few days after weaning due to the associated stressors at weaning. Depending on GI site, relative decreases in Lactobacillaceae corresponded with relative increases in Clostridiaceae and Ruminococcaceae. Additionally, while OTUs classified as Escherichia/Shigella decreased dramatically from birth through d 33 of age, they were still of relatively high abundance at d 21 (Figure 6). This suggests that the combination of stress on the pigs during this period and change to solid feed shifts their bacterial communities in a way that could predispose to GI disease with pathogens still lingering (such as E. coli), although it is not possible with our approach to discern pathogenic from non-pathogenic strains. In the ileum, OTUs classified as Actinobacillus also displayed increased relative abundance at d 21 of age (Figure 6), representing another possible bacterial pathogen impacted during this time frame.
One OTU that was present across tissues during the nursing period, but dramatically reduced following weaning, was classified as L. mucosae. This bacterium has been previously isolated from the pig intestine and shown to promote mucus-binding activity as well as pathogen inhibition properties (Roos et al., 2000; Lee et al., 2012; Valeriano et al., 2014). Thus, it would seem that either pre-weaning conditions in the pig GI promote colonization of this specific bacterium, or the bacterium is provided through the sow milk during nursing. In contrast to the pattern followed by L. mucosae, OTUs classified as other lactobacilli followed different patterns. For example, those classified as L. reuteri and L. johnsonii/gasseri followed similar patterns in the duodenum/jejunum of being at highest relative abundance from d 33 through d 84 of age, whereas an OTU classified as L. delbrueckii had highest relative abundance in the duodenum/jejunum at d 10 of age and market age. These differences highlight the dynamics of lactobacilli colonization in the pig at the species level.
We found that the relative abundance of OTUs classified as Campylobacter peaked in all GI sites examined at 33 d of age, and was of the highest relative abundance in the cecal tissue (Figure 6). In the pig GI tract, Campylobacter is considered a commensal bacterium, in which Campylobacter coli and Campylobacter jejuni are the two most prevalent species in pigs at various ages (Young et al., 2000; Alter et al., 2005). In our study, OTUs classified as Campylobacter were negatively correlated to pig BW on d 62. This correlation could be a result of the adhesion of Campylobacter in intestinal mucosa, production of toxins, or activation of inflammation by Campylobacter known to reduce nutrient efficiency for growth.
OTUs classified as L. amylovorus, Terrisporobacter, and Romboutsia were of highest relative abundance across all GI sites and pig ages. The dominance of L. amylovorus is in concordance with previous studies identifying it as a dominant species in the pig GI tract (Kant et al., 2011), and a biomarker of pig fecal contamination (Marti et al., 2010). Lactobacillus amylovorus was also reported to be probiotic species characterized by pathogen inhibitory effect (Hynonen et al., 2014). Other dominant OTUs in this study shared 98% nucleotide similarity with Terrisporobacter and Romboutsia, both of which are recently defined genera within Clostridium cluster XI (Guan et al., 2016). Romboutsia was reported to be 95% identical to Clostridium difficile (Guan et al., 2016). While little is known about pathogenesis of Terrisporobacter, this genus belongs to Peptostreptococcaceae family and several species (Terrisporobacter glycolicus and T. mayombei) of this genus are considered emerging anaerobic pathogens (Cheng et al., 2016).
Few microbial taxa were correlated with pig weight when examined at various taxonomic levels in this study. Unno et al. (2015) observed a negative correlation between pig weight and Prevotellaceae, and positive correlations between weight and Spirochaetaceae, Clostridiaceae_1, and Peptostreptococcaeae species. Unno et al. (2015) also defined “microbiome classes” that had differences in weight of pigs from each class. We did not identify such correlations here, but that could be attributed to a variety of factors including breed, geography, age, and sample type. In another study, Kim et al. (2012) found that the Firmicutes:Bacteroides ratios correlated well with weight (i.e., increasing Firmicutes:Bacteroides with increasing weight) but only in tylosin-treated groups. They also found that phyla Firmicutes (Streptococcaceae, Peptococcaceae, Peptostreptococcaceae, and Clostridiaceae) correlated positively with host weight gain. Again, we did not identify such correlations. This could be a result of many study-specific differences, such as pig type, rearing environment, feed composition, or other management practices.
Based upon our observations, the biggest influencing factors on the bacterial communities in this study were anatomical site and age, with less prominent differences between mucosal vs. digesta samples. Analyses of the mucosal vs. digesta microbiome in the ileum and cecum of pigs in this study (Figures 8 and 9 and Table 3) revealed that, overall, microbiome composition differed significantly between the cecum mucosa and digesta (although not substantially) but not in the ileum, using measures of community-level beta diversity. However, several specific bacterial taxa differ consistently between samples. Mann et al. (2014) examined the mucosa-associated microbiome of weaned pigs and found that the most abundant OTUs in their study included those classified as Helicobacter, L. johnsonii, L. amylovorus, Prevotella, E. coli, L. mucosae, and Campylobacter. However, these data were not compared with digesta microbiome, so they represent dominant bacteria and not necessarily bacteria that are differentially abundant between mucosa and digesta. Nevertheless, the data from Mann et al. (2014) indicate similarities in mucosa-associated microbiome with this study. Looft et al. (2014) examined specific differences in the lumen vs. mucosa-associated microbiome in medicated and non-medicated pigs. There was overlap in some of the taxa identified as enriched in mucosal content in their study and this study, including Prevotella, Campylobacter, Roseburia, Anaerovibrio, Succinovibrio, and Bacteroides. Thus, there appears to be a predictable core mucosal-associated microbiome in pigs that differs from the lumen-associated (digesta) microbiome. Interestingly, the study by Looft et al. (2014) and this study (data not shown) both found that the mucosal-associated microbiome is more diverse than digesta, further supporting the concept for a predictable and diverse core mucosal microbiome in multiple GI sites in the pig.
While numerous studies have examined the GI microbiome of the pig, they have usually been focused on temporal sampling using limited anatomical sites, multiple anatomical sites using limited ages, or temporal sampling combined with multiple anatomical sites using limited sample size. This study provides a broader perspective of the temporal and anatomical dynamics of the pig GI microbiome. It is encouraging that many aspects of this study are in concordance with previous studies, as this provides increasing evidence of a predictable and dynamic core GI microbiome in pigs that can be studied in more detail related to its modulation to enhance performance and health.
SUPPLEMENTARY DATA
Supplementary data are available at Animal Frontiers online.
ACKNOWLEDGMENTS
Bioinformatics were supported using tools available from the Minnesota Supercomputing Institute.
LITERATURE CITED
- Alain B Pajarillo E., Chae J. P., Balolong M. P., Bum Kim H., and Kang D. K.. 2014. Assessment of fecal bacterial diversity among healthy piglets during the weaning transition. J. Gen. Appl. Microbiol. 60:140–146. 10.2323/jgam.60.140 [DOI] [PubMed] [Google Scholar]
- Alter T., Gaull F., Kasimir S., Gürtler M., Mielke H., Linnebur M., and Fehlhaber K.. 2005. Prevalences and transmission routes of Campylobacter spp. Strains within multiple pig farms. Vet. Microbiol. 108:251–261. doi:10.1016/j.vetmic.2005.03.004 [DOI] [PubMed] [Google Scholar]
- Bian G., Ma S., Zhu Z., Su Y., Zoetendal E. G., Mackie R., Liu J., Mu C., Huang R., Smidt H., et al. 2016. Age, introduction of solid feed and weaning are more important determinants of gut bacterial succession in piglets than breed and nursing mother as revealed by a reciprocal cross-fostering model. Environ. Microbiol. 18:1566–1577. doi:10.1111/1462-2920.13272 [DOI] [PubMed] [Google Scholar]
- Caporaso J. G., Kuczynski J., Stombaugh J., Bittinger K., Bushman F. D., Costello E. K., Fierer N., Peña A. G., Goodrich J. K., Gordon J. I., et al. 2010. QIIME allows analysis of high-throughput community sequencing data. Nat. Methods 7:335–336. doi:10.1038/nmeth.f.303 [DOI] [PMC free article] [PubMed] [Google Scholar]
- Caporaso J. G., Lauber C. L., Walters W. A., Berg-Lyons D., Huntley J., Fierer N., Owens S. M., Betley J., Fraser L., Bauer M., et al. 2012. Ultra-high-throughput microbial community analysis on the illumina hiseq and miseq platforms. Isme. J. 6:1621–1624. doi:10.1038/ismej.2012.8 [DOI] [PMC free article] [PubMed] [Google Scholar]
- Cheng M. P., Domingo M. C., Lévesque S., and Yansouni C. P.. 2016. a case report of a deep surgical site infection with terrisporobacter glycolicus/t. Mayombei and review of the literature. bmc Infect. Dis. 16:529. doi:10.1186/s12879-016-1865-8 [DOI] [PMC free article] [PubMed] [Google Scholar]
- Consortium 1988. Guide for the care and use of agriculture animals in agricultural research and teaching. Consortium for Developing a Guide for the Care and Use of Agriculture Animals in Research and Teaching, Champaign, IL. [Google Scholar]
- Danzeisen J. L., Calvert A. J., Noll S. L., McComb B., Sherwood J. S., Logue C. M., and Johnson T. J.. 2013. Succession of the turkey gastrointestinal bacterial microbiome related to weight gain. Peerj. 1:e237. doi:10.7717/peerj.237 [DOI] [PMC free article] [PubMed] [Google Scholar]
- Danzeisen J. L., Clayton J. B., Huang H., Knights D., McComb B., Hayer S. S., and Johnson T. J.. 2015. Temporal relationships exist between cecum, ileum, and litter bacterial microbiomes in a commercial turkey flock, and subtherapeutic penicillin treatment impacts ileum bacterial community establishment. Front. Vet. Sci. 2:56. doi:10.3389/fvets.2015.00056 [DOI] [PMC free article] [PubMed] [Google Scholar]
- Edgar R. C. 2010. Search and clustering orders of magnitude faster than blast. Bioinformatics 26:2460–2461. doi:10.1093/bioinformatics/btq461 [DOI] [PubMed] [Google Scholar]
- Frese S. A., Parker K., Calvert C. C., and Mills D. A.. 2015. Diet shapes the gut microbiome of pigs during nursing and weaning. Microbiome 3:28. doi:10.1186/s40168-015-0091-8 [DOI] [PMC free article] [PubMed] [Google Scholar]
- Gohl D. M., Vangay P., Garbe J., MacLean A., Hauge A., Becker A., Gould T. J., Clayton J. B., Johnson T. J., Hunter R., et al. 2016. Systematic improvement of amplicon marker gene methods for increased accuracy in microbiome studies. Nat. Biotechnol. 34:942–949. doi:10.1038/nbt.3601 [DOI] [PubMed] [Google Scholar]
- Guan Z., Chen L., Gerritsen J., Smidt H., and Goldfine H.. 2016. The cellular lipids of Romboutsia. Biochimica et biophysica acta. 1861(9 Pt A):1076–1082. doi: 10.1016/j.bbalip.2016.06.006 [DOI] [PMC free article] [PubMed] [Google Scholar]
- Haas B. J., Gevers D., Earl A. M., Feldgarden M., Ward D. V., Giannoukos G., Ciulla D., Tabbaa D., Highlander S. K., Sodergren E., et al. ; Human Microbiome Consortium. 2011. Chimeric 16s rRNA sequence formation and detection in sanger and 454-pyrosequenced pcr amplicons. Genome Res. 21:494–504. doi: 10.1101/gr.112730 [DOI] [PMC free article] [PubMed] [Google Scholar]
- Hynönen U., Kant R., Lähteinen T., Pietilä T. E., Beganović J., Smidt H., Uroić K., Avall-Jääskeläinen S., and Palva A.. 2014. Functional characterization of probiotic surface layer protein-carrying Lactobacillus amylovorus strains. bmc Microbiol. 14:199. doi:10.1186/1471-2180-14-199 [DOI] [PMC free article] [PubMed] [Google Scholar]
- Kant R., Paulin L., Alatalo E., de Vos W. M., and Palva A.. 2011. Genome sequence of Lactobacillus amylovorus GRL1112. J. Bacteriol. 193:789–790. doi: 10.1128/JB.01365-10 [DOI] [PMC free article] [PubMed] [Google Scholar]
- Kim H. B., Borewicz K., White B. A., Singer R. S., Sreevatsan S., Tu Z. J., and Isaacson R. E.. 2011. Longitudinal investigation of the age-related bacterial diversity in the feces of commercial pigs. Vet. Microbiol. 153:124–133. doi:10.1016/j.vetmic.2011.05.021 [DOI] [PubMed] [Google Scholar]
- Kim H. B., Borewicz K., White B. A., Singer R. S., Sreevatsan S., Tu Z. J., and Isaacson R. E.. 2012. Microbial shifts in the swine distal gut in response to the treatment with antimicrobial growth promoter, tylosin. Proc. Natl. Acad. Sci. USA. 109:15485–15490. doi:10.1073/pnas.1205147109 [DOI] [PMC free article] [PubMed] [Google Scholar]
- Lamendella R., Domingo J. W., Ghosh S., Martinson J., and Oerther D. B.. 2011. Comparative fecal metagenomics unveils unique functional capacity of the swine gut. BMC Microbiol. 11:103. doi:10.1186/1471-2180-11-103 [DOI] [PMC free article] [PubMed] [Google Scholar]
- Lee J. H., Valeriano V. D., Shin Y. R., Chae J. P., Kim G. B., Ham J. S., Chun J., and Kang D. K.. 2012. Genome sequence of Lactobacillus mucosae LM1, isolated from piglet feces. J. Bacteriol. 194:4766. doi: 10.1128/JB.01011-12 [DOI] [PMC free article] [PubMed] [Google Scholar]
- Looft T., Allen H. K., Cantarel B. L., Levine U. Y., Bayles D. O., Alt D. P., Henrissat B., and Stanton T. B.. 2014. Bacteria, phages and pigs:the effects of in-feed antibiotics on the microbiome at different gut locations. ISME J. 8:1566–1576. doi:10.1038/ismej.2014.12 [DOI] [PMC free article] [PubMed] [Google Scholar]
- Looft T., Johnson T. A., Allen H. K., Bayles D. O., Alt D. P., Stedtfeld R. D., Sul W. J., Stedtfeld T. M., Chai B., Cole J. R., et al. 2012. In-feed antibiotic effects on the swine intestinal microbiome. Proc. Natl. Acad. Sci. USA. 109:1691–1696. doi:10.1073/pnas.1120238109 [DOI] [PMC free article] [PubMed] [Google Scholar]
- Lozupone C. and Knight R.. 2005. Unifrac:a new phylogenetic method for comparing microbial communities. Appl. Environ. Microbiol. 71:8228–8235. doi:10.1128/AEM.71.12.8228-8235.2005 [DOI] [PMC free article] [PubMed] [Google Scholar]
- Mach N., Berri M., Estellé J., Levenez F., Lemonnier G., Denis C., Leplat J. J., Chevaleyre C., Billon Y., Doré J., et al. 2015. Early-life establishment of the swine gut microbiome and impact on host phenotypes. Environ. Microbiol. Rep. 7:554–569. doi:10.1111/1758-2229.12285 [DOI] [PubMed] [Google Scholar]
- Mann E., Schmitz-Esser S., Zebeli Q., Wagner M., Ritzmann M., and Metzler-Zebeli B. U.. 2014. Mucosa-associated bacterial microbiome of the gastrointestinal tract of weaned pigs and dynamics linked to dietary calcium-phosphorus. Plos One 9:e86950. doi:10.1371/journal.pone.0086950 [DOI] [PMC free article] [PubMed] [Google Scholar]
- Marti R., Dabert P., Ziebal C., and Pourcher A. M.. 2010. Evaluation of Lactobacillus sobrius/L. Amylovorus as a new microbial marker of pig manure. Appl. Environ. Microbiol. 76:1456–1461. doi:10.1128/AEM.01895-09 [DOI] [PMC free article] [PubMed] [Google Scholar]
- McDonald D., Price M. N., Goodrich J., Nawrocki E. P., DeSantis T. Z., Probst A., Andersen G. L., Knight R., and Hugenholtz P.. 2012. An improved greengenes taxonomy with explicit ranks for ecological and evolutionary analyses of bacteria and archaea. ISME J. 6:610–618. doi:10.1038/ismej.2011.139 [DOI] [PMC free article] [PubMed] [Google Scholar]
- van Nieuwamerongen S. E., Bolhuis J. E., van der Peet-Schwering C. M., and Soede N. M.. 2014. a review of sow and piglet behaviour and performance in group housing systems for lactating sows. Animal 8:448–460. doi:10.1017/S1751731113002280 [DOI] [PubMed] [Google Scholar]
- NRC 2012. Nutrient requirements of swine. 11th ed Natl. Acad. Press, Washington, DC. [Google Scholar]
- Roos S., Karner F., Axelsson L., and Jonsson H.. 2000. Lactobacillus mucosae sp. nov., a new species with in vitro mucus-binding activity isolated from pig intestine. Int. J. Sys. Evol. Microbiol. 50(Pt 1):251–258. doi: 10.1099/00207713-50-1-251 [DOI] [PubMed] [Google Scholar]
- Unno T., Kim J. M., Guevarra R. B., and Nguyen S. G.. 2015. Effects of antibiotic growth promoter and characterization of ecological succession in swine gut microbiota. J. Microbiol. Biotechnol. 25:431–438. doi: 10.4014/jmb.1408.08063 [DOI] [PubMed] [Google Scholar]
- Valeriano V. D., Parungao-Balolong M. M., and Kang D. K.. 2014. In vitro evaluation of the mucin-adhesion ability and probiotic potential of Lactobacillus mucosae lm1. J. Appl. Microbiol. 117:485–497. doi:10.1111/jam.12539 [DOI] [PubMed] [Google Scholar]
- Wickham H. 2009. ggplot2: elegant graphics for data analysis. In: Use R! Springer-Verlag, New York. ISBN: 978-0-387-98141-3.
- Wills R. W. 2000. Diarrhea in growing-finishing swine. Vet. Clin. North Am. Food Anim. Pract. 16:135–161. 10.1016/S0749-0720(15)30140-7 [DOI] [PubMed] [Google Scholar]
- Yeoman C. J. and White B. A.. 2014. Gastrointestinal tract microbiota and probiotics in production animals. Annu. Rev. Anim. Biosci. 2:469–486. doi:10.1146/annurev-animal-022513-114149 [DOI] [PubMed] [Google Scholar]
- Young C. R., Harvey R., Anderson R., Nisbet D., and Stanker L. H.. 2000. Enteric colonisation following natural exposure to campylobacter in pigs. Res. Vet. Sci. 68:75–78. doi:10.1053/rvsc.1999.0335 [DOI] [PubMed] [Google Scholar]
- Zakrzewski M., Proietti C., Ellis J., Hasan S., Brion M.J., Berger B., and Krause L.. 2016. Calypso:a user-friendly web-server for mining and visualizing microbiome-environment interactions. Bioinformatics. 33:782–783. https://doi.org/10.1093/bioinformatics/btw725 [DOI] [PMC free article] [PubMed] [Google Scholar]
Associated Data
This section collects any data citations, data availability statements, or supplementary materials included in this article.


