Abstract
Purpose
The purpose of this study is to investigate the use of fundamental rheological parameters as quantified by MR-Elastography (MRE) to measure liver fibrosis and inflammation simultaneously in humans.
Methods
MRE was performed on 45 patients at 3T using vibration frequency of 56Hz. Fibrosis and inflammation scores were obtained from liver biopsies. Biomechanical properties were quantified in terms of complex shear modulus G* as well as shear wave phase velocity c and shear wave attenuation α. A rheological fractional derivative order model was used to investigate the linear dependence of the free model parameters (dispersion slope y, intrinsic speed c0, and intrinsic relaxation time τ) on histopathology. Leave-one-out cross-validation was then utilized to demonstrate effectiveness of the model.
Results
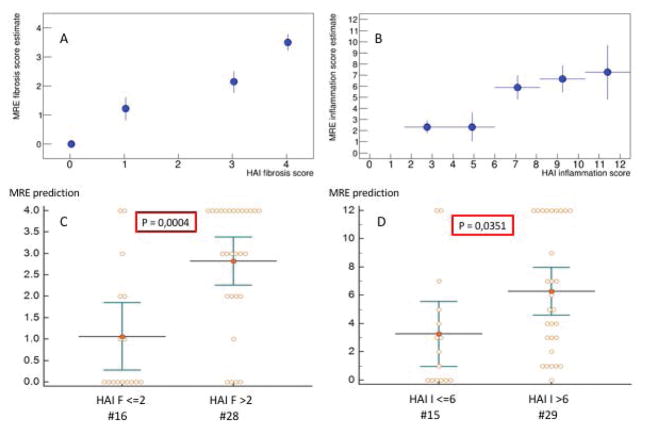
The intrinsic speed c0 increases with hepatic fibrosis, while an increased relaxation time τ is reflective of more inflammation of the liver parenchyma. The dispersion slope y does neither depend on fibrosis nor on inflammation. The proposed rheological model, given this specific parameterization, establishes the functional dependencies of biomechanical parameters on histological fibrosis and inflammation. The leave-one-out cross validation demonstrates that the model allows for identifying, from the MRE measurements, the histology scores when grouped into low/high grade fibrosis and low/high grade inflammation with significance levels of P=0.0004 (fibrosis) and P=0.035 (inflammation).
Conclusion
The functional dependencies of intrinsic speed and relaxation time on fibrosis and inflammation, respectively, shed new light onto the impact hepatic pathological changes on liver tissue biomechanics in humans. The dispersion slope y appears to represent a structural parameter of liver parenchyma not impacted by the severity of fibrosis/inflammation present in this patient cohort. This specific parametrization of the well-established rheological fractional order model is valuable for the clinical assessment of both fibrosis and inflammation scores, going beyond the capability of the plain shear modulus measurement commonly used for MRE.
Keywords: MR-Elastography, inflammation, fibrosis, chronic liver disease, rheological model, hepatitis, viscosity, liver biopsy
Graphical Abstract
A fractional derivative order model was used to investigate the dependence of the free model parameters (dispersion slope y, speed c0, and relaxation time τ) on fibrosis and inflammation. The speed c0 increases with hepatic fibrosis, while an increased relaxation time τ is reflective of more inflammation. y does neither depend on fibrosis nor on inflammation. Leave-one-out cross validation demonstrates that the model allows for identifying the histology scores when grouped into low/high grade fibrosis and low/high grade inflammation.
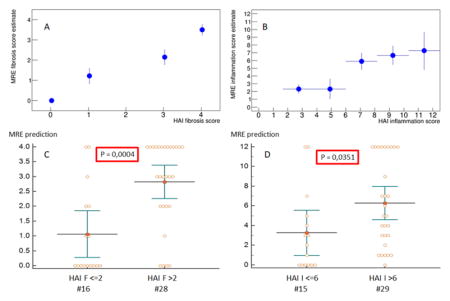
Estimated HAI scores versus true HAI scores (A, B) for fibrosis and inflammation, respectively. Regrouping the datasets into low/high grade fibrosis/inflammation (C, D) allows to evaluate whether the estimations are statistically different from each other. P-values of 0.0004 and 0.0351 are obtained, respectively.
Introduction
The assessment of liver fibrosis and inflammation is critical to the clinical management of liver disease patients, which leads to an excessive accumulation of extra cellular matrix (ECM) products. The ECM changes that are triggered by inflammation lead to tissue destruction but also to the formation of scar. Furthermore, inflammation frequently accompanies and accentuates liver damage and the development of fibrosis (1). Hence, the staging and management of liver fibrosis is multifactorial and complex due to many confounding aspects acting in parallel. Given the intricate entanglement between fibrosis and inflammation, it becomes understandable that the management of liver fibrosis requires the simultaneous staging of both fibrosis and inflammation (2–4).
Among non-invasive biomarkers, liver stiffness measured via MR Elastography (MRE) has already proven its ability to stage hepatic fibrosis in the clinical setting (5, 6). However, due to multiple liver tissue alterations that may occur at the microscopic scale, the origin of an increasing stiffness within the liver still is not well understood. Furthermore, not only fibrosis, but also inflammation, lead to changes in the mechanical properties of the liver (7, 8). Thus, mechanical changes as quantified via MRE are multi-factorial and biomechanical alterations are certainly sensitive, but not uniquely specific to exclusively fibrosis. Reproducibility and accuracy of MRE have been reported in several studies demonstrating the strength of this non-invasive imaging biomarker (9–14). Consequently, to enhance the benefits of MRE for patient care related to hepatitis and liver fibrosis, a deeper insight into the elastography parameters and its relationship to pathological alterations would be desirable.
Here, we utilize an established MRE method for measuring liver stiffness (5, 15–17) with known reproducibility circular derivation (18). Instead of solely using the complex shear modulus, we propose to also interpret the data in terms of shear wave speed (phase velocity) and shear wave absorption as this yields very different functional dependencies on the underlying pathologies under investigation. In this study we describe biomechanical properties derived from a MRE sequence (19), (20) to quantify fibrosis and inflammation. The goal is to demonstrate that MRE could prove non-invasive simultaneous estimation of fibrosis and inflammation in the liver in humans for potential clinical implications.
Material & Methods
Patients and design of the study
A total of 45 patients consecutively participated to this prospective study. All patients had liver biopsy for quantifying degree of fibrosis and inflammation. A total of 40 patients with hepatitis C (7 with human immune deficiency virus (HIV) co-infection) and 5 patients with suspected steatohepatitis related to HIV were included. All subjects signed informed consent to participate in this prospective study, which was institutional board approved and was conducted in compliance with the Declaration of Helsinki.
Liver Biopsy and Histopathology
Transjugular liver biopsies were performed for all subjects using standard techniques. Paraffin-embedded sections were stained with hematoxylin and eosin, Masson’s trichrome, special stains for iron and copper, and for reticulin. Detailed histological analysis was performed on the biopsy samples for all patients providing the Hepatic Activation Index (HAI) fibrosis and inflammation score (21).
Magnetic Resonance Elastography set-up
MRE examinations were performed on a Philips 3T scanner (22) using a 32-element abdominal surface coil array. Vibration waves were generated with a surface electro-mechanical transducer (Philips Healthcare, Hamburg, Germany) attached to the right side of the rib cage (5, 22) with a mechanical vibration frequency of 56 Hz. The MRE sequence was a modified 2D multi-slice gradient-recalled echo sequence with a TE=6.9ms (in-phase) (19). The motion encoding gradient (MEG) operated at a frequency 165Hz leading to reduced sensitivity to motion but enhanced SNR due to the short echo time (23). An in-phase TE was chosen to add constructively fat and water signals and therefore further improve SNR. Mechanical waves were imaged in all 3 directions within a volume centered transversally in the middle of the liver. The corresponding imaging parameters were: field of view 256×256 mm2 at a matrix size of 64×64, eight consecutive slices, a slice thickness of 4 mm leading to an isotropic image resolution of 4×4×4 mm3, a repetition time TR of 75.9ms, and 8 snap-shots of the mechanical wave. Data acquisition consisted of 4 breath-holds each of 14 s in order to acquire sequentially the 3 spatial motion directions plus one reference scan. The reference scan was taken without motion encoding as a reference a) to remove phase distortions introduced by the close proximity of the electromagnetic transducer to the patient body, and b) to suppress residual motion encoded by the imaging gradients.
Post-processing of MRE data
Regions of Interests (ROIs) were drawn on the corresponding anatomical images including the whole liver while avoiding the boundaries of the liver as well as large vessels. Reconstructed biomechanical properties were averaged within the ROIs from the central 4 slices to provide mean speed and mean absorption, as well as mean elasticity and viscosity. Biomechanical data are expressed as mean values ± standard error (SE) for the various stages of fibrosis and inflammation.
Reconstruction of the MRE data was done as described in prior publication (24) with the difference that we also solve for the complex-valued k-vector of wave propagation,
| (1) |
which yields directly the shear wave absorption α (in units of m−1) and the shear wave speed via c=ω/β in units of m/s with ω=2πf being the circular frequency of the vibration in rad/s. Assuming an incompressible material, wave propagation k-vector and complex shear modulus G* are related to each other via:
| (2) |
where G′ (Gd) is the shear stiffness or dynamic modulus, G″ (Gl) is the shear viscosity or the loss modulus of the tissue, and ρ the material density (assumed to be equal to water). The relationship between G* and k demonstrate two points: firstly α£β as we would otherwise encounter evanescent waves, and secondly αβ>=0, since the loss modulus must be positive definite.
Interpreting the data in terms of speed and absorption is advantageous for many reasons. Firstly, because each quantity describes an entirely different physical phenomenon: c represents the phase velocity at which the wave propagates and α is the rate at which the wave amplitude decreases exponentially with distance. Both parameters are well known in the ultrasound community and have intuitive and direct interpretation (25). Secondly, using c and α also shows that a material might have an elevated wave speed, but can actually appear soft with G′=Re(G*) reduced due to the presence of strong absorption α (thus β2 − α2 is small)(9, 26). This counterintuitive effect is avoided when reasoning in terms of c and α.
Rheological model
The complex shear modulus (and equally the k-vector) are functions of the vibration frequency in the tissue, typically rising according to a power-law in the frequency interval considered in this analysis (27). We apply the previously published model proposed by Holm et. al. (20) to the complex wave vector k in Eq.1, which yields
| (3) |
and
| (4) |
where τ and c0 are intrinsic properties of the tissue and independent of the vibration frequency. The complex shear modulus reads in this particular model as:
| (5) |
Specifically, τ represents the wave damping intrinsic relaxation time characterizing the medium, c0 is an intrinsic speed, and y∈[0.5, 1] is the slope of the dispersion curve. This interprets the data in the context of the rheological “spring-pot” model. Its dispersion properties are in stark contrast to the classical spring-damper model (Voigt model) that assumes a spring (μ ) and a damper (η ) in parallel (28). The Voigt model has as characteristic time constant τ = η/μ and exhibits a frequency independent wave speed according to , which is not observed in tissue. Re-expressing the spring-pot model for the complex shear modulus yields a frequency dependence G*~(ωτ)2−2y showing the usual parameter range for the slope, i.e. G*~ω0 for a pure spring (y = 1) and G*~ω1 for a pure dashpot (y = 0.5). Thus, we have omitted the low-frequency limiting spring that is typically in parallel to the spring-pot (“fractional Voigt model”) as our data are not broad-band, therefore, do not allow the estimation of this parameter (29, 30). If omitted entirely, the fractional Kelvin-Voigt model becomes the fractional diffusion model, which leads to the fractional diffusion-wave equation. This has been previously analyzed for a different application in work by Pandey and Holm (31).
Our investigation consists of two main steps: initially we use the measured biomechanical properties to understand how the free model parameters (c0,τ,y) depend, to the first order, on the histopathological scores. We use this proposed dependence in conjunction with data to find the free fit parameters that provide the best match between data and model. In the final step we use the established model to verify, via leave-one-out cross validation (32), whether the model allows to estimate the histopathological score individually for each patient using the biomechanical properties as quantified via MRE.
To facilitate the chain of arguments used we summarize as follows: Initially, we estimate the value of the dispersion slope y. The symmetry in the expressions for speed and attenuation in these equations suggests investigating the damping ratio,
| (6) |
which is proportional to the penetration depth of the attenuated wave. Next, with the dispersion slope y calculated using Eqn. 6, it will be demonstrated stepwise using the measured data that the remaining intrinsic rheological parameters τ and c0 are predominantly linearly associated with I (inflammation score) and F (fibrosis score), respectively. Overall, we find the following dependencies:
| (7) |
| (8) |
where A,B,c00 and τ00 are four free fit parameters whose values are to be determined using the data. We minimize the squared difference between the measured biomechanical properties and the theoretical model prediction via Eqs. 3 and 5 in combination with Eqs.7 and 8 using nonlinear regression methods (33).
Finally, we test whether the model allows accurate identifies the histopathological scores using the measured biomechanics as quantified via MRE. We use leave-one-out cross-validation, i.e. the four free model parameters are estimated using all data EXCEPT those of one selected dataset. Subsequently, using the newly established values for A,B,c00 and τ00, we find the combination of F ∈ [0,4] and I ∈ [0,12] that minimizes the squared error between the model prediction and biomechanical data for the one left-out dataset. This procedure is repeated for all datasets. The leave-one-out cross-validation was also used to separate low-grade fibrosis/inflammation (F<=2, I<=6) from high-grade fibrosis/inflammation (F>2, I>6) using unpaired t-test. MedCalc for Windows, version 18.1.2 (MedCalc Software, Mariakerke, Belgium) was used for statistical analysis and a P value ≤0.05 was considered statistically significant.
Results
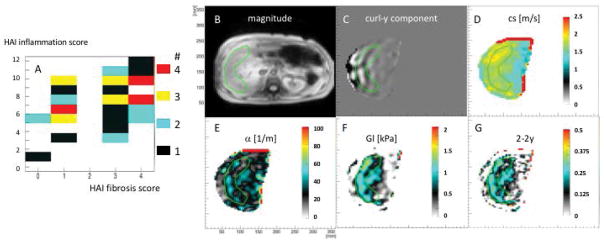
All 45 subjects (34 male, 11 female) successfully completed the MRE examination. Average age was 56.16 ± 9.26 years as shown in table 1. Fig. 1A shows the distribution of the patient cohort in the two-dimensional plane of histopathological fibrosis score vs. inflammation score, as established by the HAI-metric (21). The median iron content score was 0 using score 0–4 established by Rowe et al (34) with a 25–75 percentile of 0–1 in our patient population. Fig. 1B–F shows anatomy, y-component of the curl of the displacement vector, shear wave velocity, shear attenuation, viscosity, and the power-law exponent of the shear modulus 2 − 2y ≈ 0.22 for a selected patient (inflammation score 9 and fibrosis score 1). Mind the very homogeneous distributions of biomechanical parameters within the analyzable region of the liver parenchyma (green ROI).
Table 1.
Patient data
| Parameter | All Subjects n=45 | |
|---|---|---|
|
| ||
| Mean | Standard Deviation | |
| Age, y | 56.16 | 9.26 |
| BMI, kg/m2 | 27.76 | 4.23 |
| Laboratory data unites (normal range) | ||
| Alk Phos, U/L (40–130) | 97.11 | 37.08 |
| ALT, U/L (0–41) | 87.16 | 54.75 |
| AST, U/L (0–40) | 69.09 | 37.25 |
| Total Bilirubin, mg/dL (0–1.2) | 0.78 | 0.59 |
| Direct Bilirubin, mg/dL (0–0.3) | 0.37 | 0.30 |
| Albumin, g/dL (3.5–5.2) | 3.95 | 0.37 |
| Glucose, mg/dL (74–106) | 102.73 | 27.53 |
| Total Cholesterol, mg/dL (0–199) | 160.05 | 27.89 |
| HDL, mg/dL (>60) | 51.46 | 18.82 |
| LDL, mg/dL (100–159) | 84.49 | 24.85 |
| Triglycerides, mg/dL (0–149) | 115.26 | 50.68 |
| Histology | Median | 25–75 percentile |
| HAI total inflammation (0–18) | 8 | (5–10) |
| Fibrosis (0–4) | 3 | (1–4) |
| Steatosis (0–4) | 1 | (0–1) |
| Iron (0–4) | 0 | (0–1) |
| Copper (0–3) | 0 | (0–1) |
Abbreviation:
Alk. Phos= alkaline phosphates; ALT=Alanine Aminotransferase, AST=Aspartate Aminotransferase; HDL= High-Density Lipoprotein; LDL= Low-Density Lipoprotein.
Figure 1.
A: patient population in the HAI fibrosis/inflammation plane. B–F: results of the MRE acquisition for a selected patient depicting anatomy, shear waves, wave speed cs, attenuation α, viscosity Gl and dispersion slope 2 − 2y of the shear modulus.
The slope y does depend nor on fibrosis neither on inflammation
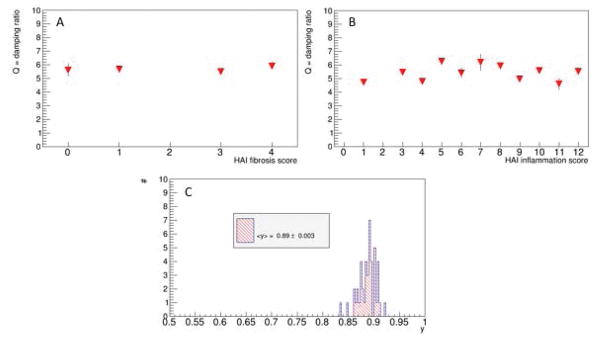
Figs. 2A,B show the dependence of the damping ratio Q (Eq.6) on the HAI fibrosis score F and the HAI inflammation score I, respectively. Data suggest no dependence on any of the two scores. Consequently, we assume that the dispersion slope y (Eq. 5) has a fixed value of 0.89 ± 0.003 (Fig. 2C), independent on any of the two pathologies. It can therefore be considered as a structural parameter of liver tissue that is not impacted by the severity levels of inflammation/fibrosis present in our patient cohort.
Figure 2.
Dependence of the damping ratio Q (Eqn.(6)) on fibrosis and inflammation, respectively (A,B). Shown are the mean and corresponding errors on mean values (which are very small). Data suggest that Q is a generic parameter that is not impacted by the histopathology environment. A mean value for the power-law slope of y=0.89±0.003 is found (error on mean C). This corresponds to an average power-law exponent for the shear modulus of 0.22 = 2 − 2y, which is what is seen in Fig.1G.
Shear speed rises linearly with fibrosis, shear attenuation drops mildly with inflammation
We revisit Eqns.3–5 using the previous insight into y. A fixed and generic slope y = 0.89 leads to the following expressions:
| (8) |
| (9) |
| (10) |
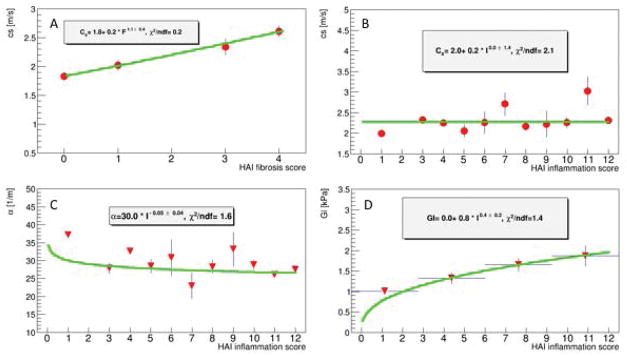
The variation of c, α, and G″ = Gl with respect to I and F will now be inspected in order to guide us for determining which of the remaining model parameters (c0,τ) depend strongly, to the first order, on which pathology. Fig. 3A demonstrates that the shear speed c rises quasi linearly with fibrosis. A generic power-law fit to these data (i.e. c(F)~Fδ, δ a free exponent) yields δ = 1.1 ± 0.4 supporting the argument of a quasi-linear rise. This linear relation with F can only be accomplished through an association with c0. Any significant dependence of the relaxation time τ on fibrosis would require an unrealistic high power of to accomplish the observed linear rise. Thus, in the following we will consider any linear dependence of τ on fibrosis as negligible.
Figure 3.
Dependence of viscoelastic parameters as quantified by MRE on HAI fibrosis and inflammation scores. Shear speed rises linearly with fibrosis (A), while there is almost no dependency on inflammation (B). Attenuation drops only mildly with inflammation (C) while viscosity is rising notably with inflammation (D).
Furthermore, c0 cannot depend strongly in a linear fashion on inflammation. Otherwise, an increase in inflammation score from I = 1 to I = 12 would lead to a significant increase in speed (Fig. 3B) and significant decrease in the attenuation (Fig. 3C). None of this is supported by the data, which suggests that c0 depends mainly in a linear fashion on fibrosis.
Viscosity rises with inflammation
We are left with the last remaining missing dependence, i.e. a potential linear dependence of the relaxation time τ on inflammation. For that purpose, it is favorable to use the modulus expression (Eqn.10) as it is twice as sensitive to dependencies of τ on inflammation due to the power two. Fig. 3D shows the evolution of G″ = Gl as a function of HAI inflammation score. A power-law fit according to Gl~Iδ yields δ=0.4±0.2 which is compatible within errors with the assumption of a linear dependence of τ on I which yields theoretically an exponent of 0.22 (Eqn.10). Again, it can be seen that c0 cannot depend linearly upon inflammation as this would lead to a quadratic increase of G* with I, which is not supported by the data.
These findings show the dependencies of the rheological parameters on pathology as indicated in Eq. 7 and Eq.8. A non-linear regression fit between model and data yields the following values for the four model parameters:
| (11) |
and,
| (12) |
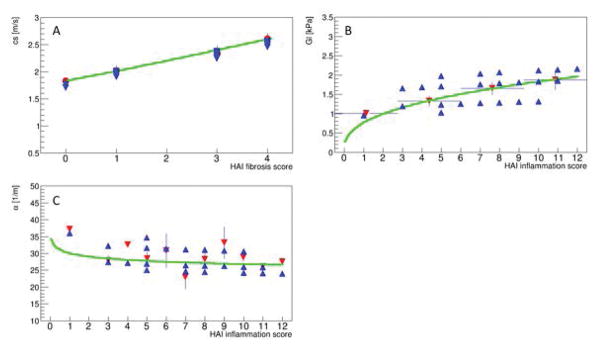
Compared to their respective DC values (c00, τ00), both scales (A,B) are just one order of magnitude lower whereby enabling a substantial impact of F and I on τ and c0. Fig. 4 shows the results of the fit when using the HAI fibrosis and inflammation scores for each individual patient. Apparently, the model allows for the correct reproduction the scales and trend of each of the biomechanical variables.
Figure 4.
Resulting viscoelastic parameter estimates (blue triangle) when using the established model with the corresponding values found for the four free parameters (Eq.11,12). While the shear speed can be reproduced with high accuracy, as expected, the functional dependencies on inflammation have larger variations.
Using the model to predict the HAI scores
The estimated HAI scores versus true HAI scores is shown in Fig. 5A,B. This is achieved using a fit procedure to calculate the parameters in Eqns. (11) and (12), but leaving out one patient (leave-one-out cross-validation). As there is just one patient with I=1 (Fig. 1A), the fit becomes instable when leaving out that data point. Thus, currently, the low inflammation region cannot be tested given the present dataset. The leave-one-out cross-validation demonstrates that low-grade fibrosis/inflammation (F<=2, I<=6) can properly be distinguished from high-grade fibrosis/inflammation (F>2, I>6) with statistical significances of P=0.0004 and P=0.035, respectively.
Figure 5.
Estimated HAI scores versus true HAI scores (A, B) for fibrosis and inflammation, respectively. Regrouping the datasets into low/high grade fibrosis/inflammation (C, D) demonstrates ability of the model to differentiate groups with statistically significant P-values of 0.0004 and 0.0351, respectively.
Discussion
This study presents evidence that a frequency power-law is able to describe mechanical hepatic tissue characteristics towards translation into biological tissue structure in a human population. The data suggest that the power-law slope y does not depend upon fibrosis or inflammation. This finding agrees with a recent analysis done in various pre-clinical animal models (35). In their study, they demonstrated that for late stage of inflammation/fibrosis there was no statistical significant difference for the damping ratio Q found between control and diseased, and consequently no change for Q among the different disease types. Hence, the slope y can be viewed as an order parameter characterizing the hierarchical organization of the material (29). Apparently, the mechanical changes resulting from fibrosis or inflammation in our patient cohort are not significant enough to have a substantial impact on y. This is different from studies modifying levels of cellular adhesion where changes in the power-law exponent have been measured (36, 37).
Furthermore, this study demonstrates that the remaining free model parameters are uniquely impacted, to the first order, by different histopathological changes. Specifically, fibrosis increases the intrinsic stiffness c0 while inflammation increases the intrinsic relaxation time τ. Such findings can be explained by considering the hepatic tissue structure changes at the microenvironment. At this microenvironment level, fibrosis results from the deposition of collagen I in the form of fibril-forming collagens and basement membrane collagens (1). Additionally, there is an increased presence of fibrogenic and contractile myofibroblastsin the ECM (1). Collectively these behave as struts within the hepatic tissue thereby contributing to tissue rigidity. Thus, while the hierarchical organization of the material is not modified (y neither a function of fibrosis nor inflammation), its intrinsic stiffness as expressed by c0 increases linearly with the degree of fibrosis (Fig. 2A). On the other hand, inflammation leads to an influx and infiltration of the liver tissue with a variety of white cells and macrophages resulting in the release of chemokines. These chemokines not only attract more infiltrating cells but also contribute to their retention in the tissue by activating integrin-mediated adhesion that is central to chronic inflammation (38). This results in an inflamed hepatic tissue structure that is densely populated with cells and adhesion factors that apparently translates mechanically into increased viscosity of the tissue (Fig. 3D). Cellular rheology studies have investigated the impact of elevated cellular adhesion on stiffness and viscosity (i.e. G*) and found an increase of G* with increasing adhesion (36, 37). Chronic inflammation leads to increased cellular adhesion (38). Therefore, we would predict an increase of G* with increasing HAI inflammation score. It is important to keep in mind that an increase in G* does not necessarily imply a change in y If the real and imaginary part of G* change equally; the phase angle y stays constant, which is the case for our dataset. Prior studies have demonstrated tissue stiffness increases due to inflammation (39), which is also shown by the present study. Here, we could back trace the origin pattern to an increase in the intrinsic relaxation time constant τ. Hence, we conclude that changes in adhesion impacts mainly in a linear fashion on τ and translates into an increased viscosity but decreased attenuation coefficient (Fig. 3 C,D). The leave-one-out cross-validation demonstrates that the proposed model allows for proper identification of the HAI scores (i.e. low/high grade fibrosis/inflammation) simultaneously using the biomechanical properties as quantified by MRE. This concept has thus the possibility to be used as surrogate for effectiveness of therapy and other interventions once it is further optimized.
A limit of the present study is the low number of patients with low-grade inflammation. While most of our patients had similar diagnosis of hepatitis C (40 patients), only 5 were suspected of having steatohepatitis. These were included in this prospective design to demonstrate the value of the technique to identify inflammation regardless of the underlying etiology in a similar fashion as and in correlation with HAI pathology scores. Furthermore, novel transducer concepts that omit residual stray fields (40) in combination with faster acquisition sequences (41) have the potential to further increase the precision on the biomechanical data translating directly in an improved performance when estimating the HAI scores.
In conclusion, a higher intrinsic speed c0 corresponds to an increase in hepatic fibrosis while increased relaxation time τ is reflective of more inflammation of the liver parenchyma. These parameters (c0 and τ) allow for the assessment of liver diseases beyond the capability of the modulus measurement commonly used for MRE for patients. This study also demonstrates the value of utilizing the spring-pot model in MRE as a surrogate of both fibrosis and inflammation beyond just fibrosis staging with potential clinical implication for future utilization of this method.
Acknowledgments
Funding of this research in through NIDDK/NIH intramural funds, the British Council-Newton Fund Institutional Links, Grant Agreement 172707526. This project has received funding from the European Union’s Horizon 2020 research and Innovation program under grant agreement No 668039. Any dissemination of results must indicate that it reflects only the author’s view and that the Commission is not responsible for any use that may be made of the information it contains.
References
- 1.Hernandez-Gea V, Friedman SL. Pathogenesis of liver fibrosis. Annu Rev Pathol. 2011;6:425–456. doi: 10.1146/annurev-pathol-011110-130246. [DOI] [PubMed] [Google Scholar]
- 2.Cobbold JF, Patel D, Taylor-Robinson SD. Assessment of inflammation and fibrosis in non-alcoholic fatty liver disease by imaging-based techniques. Journal of gastroenterology and hepatology. 2012;27:1281–1292. doi: 10.1111/j.1440-1746.2012.07127.x. [DOI] [PubMed] [Google Scholar]
- 3.Sharma S, Khalili K, Nguyen GC. Non-invasive diagnosis of advanced fibrosis and cirrhosis. World journal of gastroenterology: WJG. 2014;20:16820. doi: 10.3748/wjg.v20.i45.16820. [DOI] [PMC free article] [PubMed] [Google Scholar]
- 4.Van Beers BE, Daire J-L, Garteiser P. New imaging techniques for liver diseases. Journal of Hepatology. doi: 10.1016/j.jhep.2014.10.014. [DOI] [PubMed] [Google Scholar]
- 5.Huwart L, Sempoux C, Vicaut E, et al. Magnetic resonance elastography for the noninvasive staging of liver fibrosis. Gastroenterology. 2008;135:32–40. doi: 10.1053/j.gastro.2008.03.076. [DOI] [PubMed] [Google Scholar]
- 6.Talwalkar JA, Yin M, Fidler JL, Sanderson SO, Kamath PS, Ehman RL. Magnetic resonance imaging of hepatic fibrosis: emerging clinical applications. Hepatology. 2008;47:332–342. doi: 10.1002/hep.21972. [DOI] [PubMed] [Google Scholar]
- 7.Salameh N, Larrat B, Abarca-Quinones J, et al. Early Detection of Steatohepatitis in Fatty Rat Liver by Using MR Elastography 1. Radiology. 2009;253:90–97. doi: 10.1148/radiol.2523081817. [DOI] [PubMed] [Google Scholar]
- 8.Ichikawa S, Motosugi U, Nakazawa T, et al. Hepatitis activity should be considered a confounder of liver stiffness measured with MR elastography. Journal of Magnetic Resonance Imaging. 2015;41:1203–1208. doi: 10.1002/jmri.24666. [DOI] [PubMed] [Google Scholar]
- 9.Bohte AE, Garteiser P, De Niet A, et al. MR elastography of the liver: defining thresholds for detecting viscoelastic changes. Radiology. 2013;269:768–776. doi: 10.1148/radiol.13122669. [DOI] [PubMed] [Google Scholar]
- 10.Hines CD, Bley TA, Lindstrom MJ, Reeder SB. Repeatability of magnetic resonance elastography for quantification of hepatic stiffness. Journal of Magnetic Resonance Imaging. 2010;31:725–731. doi: 10.1002/jmri.22066. [DOI] [PMC free article] [PubMed] [Google Scholar]
- 11.Motosugi U, Ichikawa T, Sano K, et al. Magnetic resonance elastography of the liver: preliminary results and estimation of inter-rater reliability. Japanese journal of radiology. 2010;28:623–627. doi: 10.1007/s11604-010-0478-1. [DOI] [PMC free article] [PubMed] [Google Scholar]
- 12.Serai SD, Yin M, Wang H, Ehman RL, Podberesky DJ. Cross-vendor validation of liver magnetic resonance elastography. Abdominal imaging. 2014:1–6. doi: 10.1007/s00261-014-0282-y. [DOI] [PMC free article] [PubMed] [Google Scholar]
- 13.Shire NJ, Yin M, Chen J, et al. Test–retest repeatability of MR elastography for noninvasive liver fibrosis assessment in hepatitis C. Journal of Magnetic Resonance Imaging. 2011;34:947–955. doi: 10.1002/jmri.22716. [DOI] [PMC free article] [PubMed] [Google Scholar]
- 14.Singh S, Venkatesh SK, Wang Z, et al. Diagnostic Performance of Magnetic Resonance Elastography in Staging Liver Fibrosis: A Systematic Review and Meta-analysis of Individual Participant Data. Clinical Gastroenterology and Hepatology. 2014 doi: 10.1016/j.cgh.2014.09.046. [DOI] [PMC free article] [PubMed] [Google Scholar]
- 15.Huwart L, Peeters F, Sinkus R, et al. Liver fibrosis: non-invasive assessment with MR elastography. NMR Biomed. 2006;19:173–179. doi: 10.1002/nbm.1030. [DOI] [PubMed] [Google Scholar]
- 16.Huwart L, Salameh N, ter Beek L, et al. MR elastography of liver fibrosis: preliminary results comparing spin-echo and echo-planar imaging. Eur Radiol. 2008;18:2535–2541. doi: 10.1007/s00330-008-1051-5. [DOI] [PubMed] [Google Scholar]
- 17.Huwart L, Sempoux C, Salameh N, et al. Liver fibrosis: noninvasive assessment with MR elastography versus aspartate aminotransferase-to-platelet ratio index. Radiology. 2007;245:458–466. doi: 10.1148/radiol.2452061673. [DOI] [PubMed] [Google Scholar]
- 18.Bohte AE, Garteiser P, De Niet A, et al. MR elastography of the liver: defining thresholds for detecting viscoelastic changes. Radiology. 2013;269:768–776. doi: 10.1148/radiol.13122669. [DOI] [PubMed] [Google Scholar]
- 19.Garteiser P, Sahebjavaher RS, Ter Beek LC, et al. Rapid acquisition of multifrequency, multislice and multidirectional MR elastography data with a fractionally encoded gradient echo sequence. NMR Biomed. 2013;26:1326–1335. doi: 10.1002/nbm.2958. [DOI] [PubMed] [Google Scholar]
- 20.Holm S, Sinkus R. A unifying fractional wave equation for compressional and shear waves. The Journal of the Acoustical Society of America. 2010;127:542–548. doi: 10.1121/1.3268508. [DOI] [PubMed] [Google Scholar]
- 21.Knodell RG, Ishak KG, Black WC, et al. Formulation and application of a numerical scoring system for assessing histological activity in asymptomatic chronic active hepatitis. Hepatology. 1981;1:431–435. doi: 10.1002/hep.1840010511. [DOI] [PubMed] [Google Scholar]
- 22.Herzka DA, Kotys MS, Sinkus R, Pettigrew RI, Gharib AM. Magnetic resonance elastography in the liver at 3 Tesla using a second harmonic approach. Magn Reson Med. 2009;62:284–291. doi: 10.1002/mrm.21956. [DOI] [PubMed] [Google Scholar]
- 23.Rump J, Klatt D, Braun J, Warmuth C, Sack I. Fractional encoding of harmonic motions in MR elastography. Magn Reson Med. 2007;57:388–395. doi: 10.1002/mrm.21152. [DOI] [PubMed] [Google Scholar]
- 24.Sinkus R, Siegmann K, Xydeas T, Tanter M, Claussen C, Fink M. MR elastography of breast lesions: understanding the solid/liquid duality can improve the specificity of contrast-enhanced MR mammography. Magn Reson Med. 2007;58:1135–1144. doi: 10.1002/mrm.21404. [DOI] [PubMed] [Google Scholar]
- 25.Bercoff J, Tanter M, Fink M. Supersonic shear imaging: a new technique for soft tissue elasticity mapping. IEEE Trans Ultrason Ferroelectr Freq Control. 2004;51:396–409. doi: 10.1109/tuffc.2004.1295425. [DOI] [PubMed] [Google Scholar]
- 26.TP VERIFICATION OF LOCAL KRAMERS–KRONIG RELATIONS FOR COMPLEX MODULUS BY MEANS OF FRACTIONAL DERIVATIVE MODEL. Journal of Sound and Vibration. 1999;228:11. [Google Scholar]
- 27.Verdier C. Rheological Properties of Living Materials. From Cells to Tissues. Journal of Theoretical Medicine. 2003;5:25. [Google Scholar]
- 28.Fung YC. Biomechanics : mechanical properties of living tissues. New York: Springer-Verlag; 1993. [Google Scholar]
- 29.Schiessel H, Blumen A. Mesoscopic Pictures of the Sol-Gel Transition - Ladder Models and Fractal Networks. Macromolecules. 1995;28:4013–4019. [Google Scholar]
- 30.Zhang M, Castaneda B, Wu Z, et al. Congruence of imaging estimators and mechanical measurements of viscoelastic properties of soft tissues. Ultrasound Med Biol. 2007;33:1617–1631. doi: 10.1016/j.ultrasmedbio.2007.04.012. [DOI] [PMC free article] [PubMed] [Google Scholar]
- 31.Pandey V, Holm S. Connecting the grain-shearing mechanism of wave propagation in marine sediments to fractional order wave equations. J Acoust Soc Am. 2016;140:4225. doi: 10.1121/1.4971289. [DOI] [PubMed] [Google Scholar]
- 32.Kohavi R. A study of cross-validation and bootstrap for accuracy estimation and model selection. Ijcai; Montreal, Canada: 1995. pp. 1137–1145. [Google Scholar]
- 33.James F, Roos M. Minuit: A System for Function Minimization and Analysis of the Parameter Errors and Correlations. Comput Phys Commun. 1975;10:343–367. [Google Scholar]
- 34.Rowe JW, Wands JR, Mezey E, et al. Familial hemochromatosis: characteristics of the precirrhotic stage in a large kindred. Medicine (Baltimore) 1977;56:197–211. [PubMed] [Google Scholar]
- 35.Yin M, Glaser KJ, Manduca A, et al. Distinguishing between Hepatic Inflammation and Fibrosis with MR Elastography. Radiology. 2017:160622. doi: 10.1148/radiol.2017160622. [DOI] [PMC free article] [PubMed] [Google Scholar]
- 36.Mierke CT, Kollmannsberger P, Zitterbart DP, Smith J, Fabry B, Goldmann WH. Mechano-coupling and regulation of contractility by the vinculin tail domain. Biophys J. 2008;94:661–670. doi: 10.1529/biophysj.107.108472. [DOI] [PMC free article] [PubMed] [Google Scholar]
- 37.Mierke CT, Frey B, Fellner M, Herrmann M, Fabry B. Integrin alpha5beta1 facilitates cancer cell invasion through enhanced contractile forces. J Cell Sci. 2011;124:369–383. doi: 10.1242/jcs.071985. [DOI] [PMC free article] [PubMed] [Google Scholar]
- 38.Lalor PF, Shields P, Grant A, Adams DH. Recruitment of lymphocytes to the human liver. Immunol Cell Biol. 2002;80:52–64. doi: 10.1046/j.1440-1711.2002.01062.x. [DOI] [PubMed] [Google Scholar]
- 39.Ronot M, Di Renzo S, Gregoli B, et al. Characterization of fortuitously discovered focal liver lesions: additional information provided by shearwave elastography. Eur Radiol. 2015;25:346–358. doi: 10.1007/s00330-014-3370-z. [DOI] [PubMed] [Google Scholar]
- 40.Jurgen Henk Runge SHH, Sudakova Jelizaveta, Dokumaci Ayse Sila, Nelissen Jules Laurent, Lee Jack, Stoker Jaap, Nederveen Aart Johannes, Nordsletten David, Sinkus Ralph. A novel MR Elastography transducer concept based on a rotational eccentric mass: the gravitational transducer. ISMRM; Honolulu, Hawaii: 2017. [DOI] [PubMed] [Google Scholar]
- 41.CG, JHR, RS, SK . Intl Soc Mag Reson Med. Honolulu: 2017. Hadamard Encoding for Magnetic Resonance Elastography; p. 1378. [Google Scholar]


