ABSTRACT
The embryonic origin of distinct fat depots and the role for ontogeny in specifying the functional differences among adipocyte lineages between and within depots is unclear. Using a Cre/Lox-based strategy to track the fate of major mesodermal subcompartments in mice we present evidence that <50% of interscapular brown adipocytes are derived from progenitors of the central dermomyotome. Furthermore, we demonstrate that depot-specific adipocyte lineages spatially diverge as early as gastrulation, and that perigonadal adipocytes arise from separate mesodermal subcompartments in males and females. Last, we show adipocyte precursors (APs) of distinct lineages within the same depot exhibit indistinguishable responses to a high fat diet, indicating that ontogenetic differences between APs do not necessarily correspond to functional differences in this context. Altogether, these findings shed light on adipose tissue patterning and suggest that the behavior of adipocyte lineage cells is not strictly determined by developmental history.
KEY WORDS: Adipocyte, Adipose, Fate map, Lineage tracing, Mesoderm
Highlighted Article: Embryonic cell lineage tracing of adipose tissue reveals that perigonadal fat arises from distinct mesodermal subcompartments in males and females, and that <50% of interscapular brown fat arises from central dermomyotome.
INTRODUCTION
Appropriate developmental patterning of adipose tissue results in a stereotyped anatomical configuration of white and brown fat depots. The main white adipose tissue (WAT) depots are positioned within the abdominal cavity (i.e. viscerally) and subcutaneously around the hips and thighs, whereas brown adipose tissue (BAT) is predominately constrained to interscapular and thoracic regions of the body (Cypess et al., 2009; de Jong et al., 2015; Lee et al., 2013; Nedergaard et al., 2007; Shen et al., 2003). The primary role of WAT is to store energy in the form of triglycerides, whereas BAT metabolizes fatty acids, producing heat (Cannon and Nedergaard, 2004; Rosen and Spiegelman, 2014). Proper WAT and BAT function depends on constituent endothelial, hematopoietic and fibrotic cell populations (Khan et al., 2009; Marcelin et al., 2017; Rupnick et al., 2002; Xu et al., 2003). However, the defining feature and essential unit of all adipose tissue is the adipocyte. These ‘fat cells’ are known to arise from depot-resident adipocyte precursors (APs) in adults (Berry and Rodeheffer, 2013; Rodeheffer et al., 2008), yet the embryonic progenitor pools from which depot-specific adipocyte lineages originate are not clear.
Early studies suggested that brown adipocytes arise from progenitors residing in the central dermomyotome, a subcompartment of somites that makes important contributions to the dorsal dermis and epaxial muscle (Atit et al., 2006; Lepper and Fan, 2010; Seale et al., 2008). From these data it was inferred that BAT and WAT are derived from completely distinct embryonic progenitor pools. However, the tracing systems leveraged to make these conclusions used cytoplasmic markers, which have since been shown to be ineffective for labeling adipocytes (Jeffery et al., 2014; Sanchez-Gurmaches et al., 2016). More recent data, gathered using membrane-targeted fluorescent markers coupled to the Myf5- and Pax3-Cre drivers (Lang et al., 2005; Tallquist et al., 2000), indicate that several major BAT depots and, surprisingly, WAT depots share a common origin in the somites (Sanchez-Gurmaches and Guertin, 2014). Despite this progress, the particular regions within the somites from which these depots arise, and the lineage hierarchy of the progenitors involved, remain undetermined.
A similar strategy with the inducible WT1-CreERT2 driver (Zhou et al., 2008) was used to show that the visceral, but not subcutaneous, adipocyte lineage arises from embryonic mesothelial cells, which line organs of the abdominal cavity late in gestation (Chau et al., 2014). In a complementary study, the subcutaneous adipocyte lineage was selectively labeled when limb bud mesenchyme was traced by Prx1-Cre (Logan et al., 2002; Sanchez-Gurmaches et al., 2015). Taken together, these observations indicate that visceral and subcutaneous adipocyte lineages are segregated by late embryogenesis. However, to identify the time period and embryonic subdomain in which this lineage bifurcation takes place, tracing from earlier time points is required.
Here, we use a somite-specific driver, Meox1-Cre (Jukkola et al., 2005), to show that white and brown adipocyte lineages that populate dorso-axial depots, along with a major proportion of the male perigonadal lineage, are derived from somitic mesoderm. We show that a subpopulation of interscapular white and brown adipocytes arise from Pax7+ progenitors, and integrate this observation with data from previous reports to argue that the epaxial dermomyotome, not the central dermomyotome, is the major source for interscapular adipocytes. We use constitutive and inducible Cre/Lox systems to track the fate of posterior lateral plate mesoderm from the time of its formation during gastrulation, and show that, with the exception of the male perigonadal depot, visceral and subcutaneous adipocytes are derived from this tissue. Furthermore, we present evidence that APs of distinct ontogenies within the male perigonadal depot respond equivocally to a high fat diet (HFD) stimulus, despite clear positionally dependent responses along the anterior-posterior axis of the depot. Finally, we propose a unified model to describe adipocyte lineage relationships between and within depots and suggest that the depot microenvironment, and not merely developmental history, is an important regulator of adipocyte lineage cell function.
RESULTS
Tracing mesoderms of the whole somite, central dermomyotome and posterior lateral plate
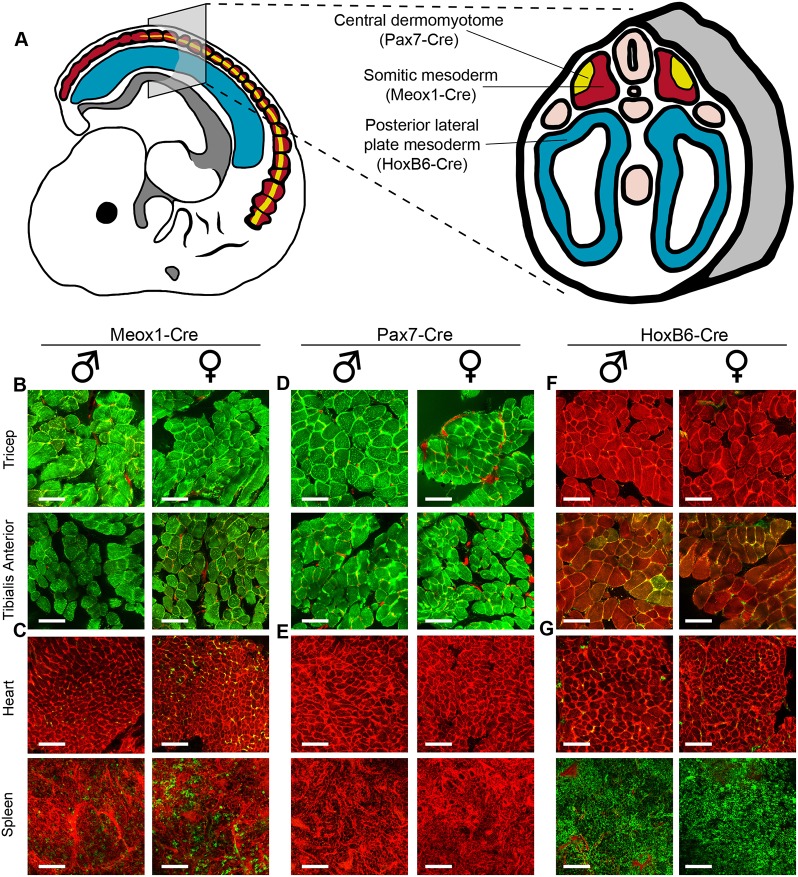
Upon completion of gastrulation the mesodermal germ layer takes on a compartmentalized architecture, with the somites and lateral plates comprising the bulk of the tissue. Somites are paired blocks of progenitor cells that form in parallel tracks along the anterior-posterior axis of the embryo and give rise predominately to vertebrae and muscle, as well as a subset of dermis (Atit et al., 2006; Brent and Tabin, 2002; Buckingham et al., 2003). The central dermomyotome is contained within somitic mesoderm and is known to contribute to dermal and epaxial muscle lineages, but not vertebral lineages (Atit et al., 2006; Lepper and Fan, 2010). Lateral plate mesoderm is not physically associated with somites and forms as two bilaterally symmetrical sac-like structures (Fig. 1A). These eventually generate, among other things, the serous membranes that line body cavities, the spleen and the cardiovascular system (Brand, 2003; Thors and Drukker, 1997; Tribioli and Lufkin, 1999).
Fig. 1.
Fate-mapping mesodermal subcompartments using the Cre/Lox system. (A) Cre drivers used in this study and the unique mesodermal subcompartments in which they are active. (B,D,F) Tracing of somite-derived tissues (triceps and tibialis anterior) in the Meox1-Cre:mTmG system (B), in the Pax7-Cre:mTmG system (D) and in the HoxB6-Cre:mTmG system (F). (C,E,G) Tracing of anterior lateral plate (heart) and posterior lateral plate (spleen) derived tissue in the Meox1-Cre:mTmG system (C), in the Pax7-Cre:mTmG system (E) and in the HoxB6-Cre:mTmG system (G). Data are from males and females aged 4-10 weeks of age. Scale bar: 100 µm. Green, traced cells; red, untraced cells.
In order to distinguish the mesodermal subcompartments from which different adipose depots arise, we first selected two Cre driver strains, Meox1-Cre and HoxB6-Cre, with mesodermal expression domains largely restricted to the somites (Jukkola et al., 2005) and lateral plates (Lowe et al., 2000), respectively. Moreover, it has been reported that interscapular brown adipocytes originate from Pax7+ progenitors in the central dermomyotome (Lepper and Fan, 2010). However, that study used a cytoplasmic marker and did not trace BAT postembryonically, when adipocytes fill with lipid and become morphologically distinguishable from stromal cells. In contrast, we chose to perform lineage-tracing experiments into adulthood with a Pax7-Cre knock-in that recapitulates the endogenous expression pattern of the Pax7 gene without disrupting Pax7 function (Keller et al., 2004). In all experiments, we coupled the designated Cre recombinase with the mTmG reporter, which is highly effective in labeling adipocytes (Berry and Rodeheffer, 2013; Jeffery et al., 2014; Sanchez-Gurmaches and Guertin, 2014; Sanchez-Gurmaches et al., 2016). Briefly, the mTmG cassette tandemly encodes membrane-localized tdTomato (mTomato) and membrane-localized GFP (mGFP) elements. In every cell in which Cre recombinase is active, the tdTomato element is excised, thereby permitting expression of the GFP element; this indelibly switches the affected cell and its progeny from a red to a green fluorescent signature (Muzumdar et al., 2007).
To validate the reported mesodermal expression domains for these Cre lines, we harvested several tissues known to be derived from either the somites or lateral plates from adult Meox1-Cre:mTmG (somite), Pax7-Cre:mTmG (central dermomyotome and myotome) and HoxB6-Cre:mTmG (lateral plate) animals. As expected, Meox1-Cre tracing strongly marked the somite-derived triceps and tibialis anterior muscles in mGFP but not the spleen or heart, which arise from lateral plate mesoderm (Fig. 1B,C). The mesodermal expression domain for the Pax7 gene extends from the central dermomyotome to the myotome in the embryo, ultimately being constrained to satellite cells in the adult (Relaix et al., 2005; Seale et al., 2000). As expected, Pax7-Cre tracing mirrors that of Meox1-Cre in these tissues (Fig. 1D,E). Thus, the Meox1-Cre:mTmG and Pax7-Cre:mTmG tracing systems label overlapping cell populations in the somites and derivatives thereof, but not lateral plate cells and their derivatives. HoxB6-Cre tracing did not appreciably label either skeletal muscles or the heart, but did strongly label the spleen in mGFP (Fig. 1F,G). The heart is derived from the anterior portion of the lateral plates (cardiac mesoderm) whereas the spleen is derived from the posterior portion (Brand, 2003; Onimaru et al., 2011; Roberts et al., 1994; Tribioli and Lufkin, 1999). Therefore, the HoxB6-Cre:mTmG system effectively labels posterior lateral plate mesoderm (PLPM) and its derivatives, but not cardiac mesoderm or the somites and their derivatives.
Central dermomyotome contributes to a small subset of somite-derived adipocytes
After confirming that predicted adult tissues are labeled according to the reported mesodermal expression domains for Meox1-Cre, HoxB6-Cre and Pax7-Cre in our models, we applied these tools to better understand the developmental relationships among adipocyte lineages that populate major adipose depots. In all conditions, whole adipose tissue was imaged by confocal microscopy and adipocytes designated as either mGFP+ or mTomato+ using ImageJ software (Schindelin et al., 2015; Schneider et al., 2012). In Meox1-Cre:mTmG animals, major dorso-axial depots (i.e. retroperitoneal WAT, interscapular WAT and interscapular BAT) were labeled with mGFP, ranging from 85.9 to 96.2% of adipocytes, depending on the depot (Fig. 2A-C, Fig. S5A). In contrast, virtually no adipocytes were traced in adipose depots positioned more peripherally and ventrally in the body (Fig. 2D-G, Fig. S5A). A striking exception, however, is the male perigonadal adipose depot, in which 59.5% of adipocytes are mGFP+. In females, only 4.2% of adipocytes display mGFP fluorescence, indicating that the somites significantly contribute to the male, but not female, perigonadal adipocyte lineage. Interestingly, the Meox1-Cre tracing pattern of adipose tissue is very similar to the reported pattern for Pax3-Cre, from strong labeling of dorso-axial depots to the sexually dimorphic labeling of adipocytes in perigonadal fat (Sanchez-Gurmaches and Guertin, 2014). As Pax3 expression overlaps with Meox1 in the dermomyotome of somites (Relaix et al., 2005), these data suggest that the mGFP+ adipocytes in these tracing systems originate from progenitors in the dermomyotome.
Fig. 2.
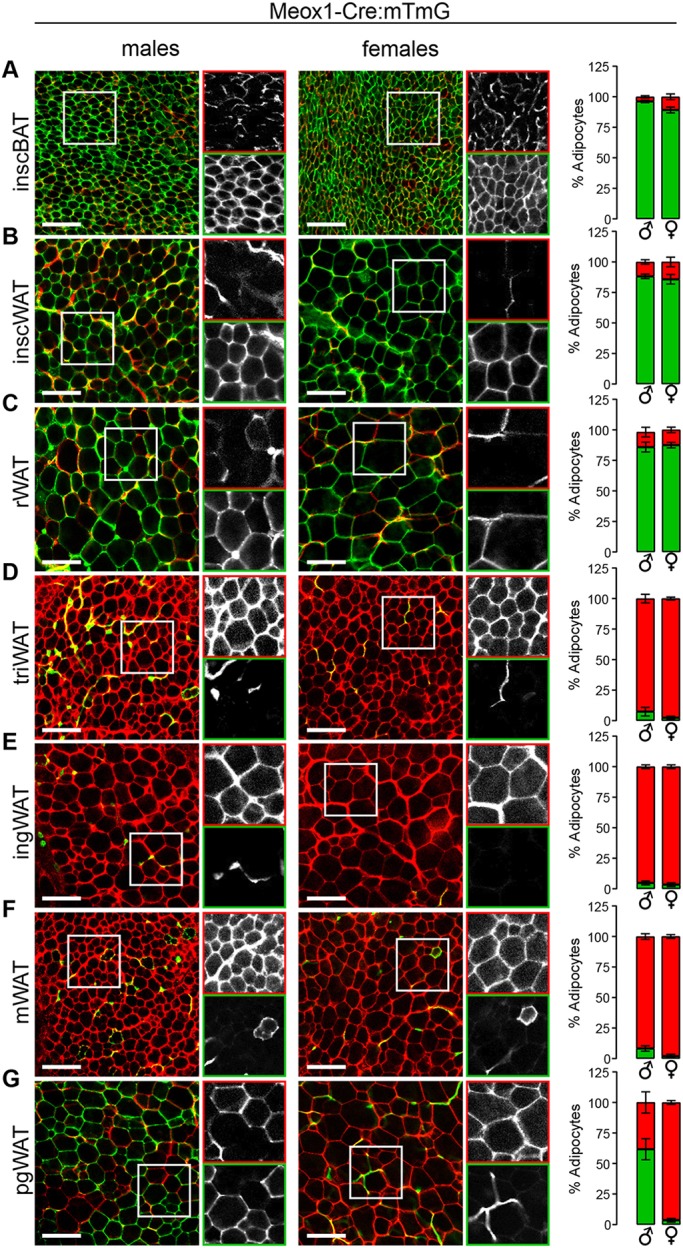
Dorso-axial adipocytes and male perigonadal adipocytes predominately arise from somitic mesoderm. (A-G) Images and quantification of Meox1-Cre:mTmG reporter in interscapular brown adipose tissue (inscBAT) (A), interscapular white adipose tissue (inscWAT) (B), retroperitoneal white adipose tissue (rWAT) (C), triceps white adipose tissue (triWAT) (D), inguinal white adipose tissue (ingWAT) (E), mesenteric white adipose tissue (mWAT) (F), perigonadal white adipose tissue (pgWAT) (G). n=6-8, depending on the depot. Data are from males aged 4-6 weeks and from females aged 5-6 weeks. For each image, the boxed area is shown in black and white for the red (top) and green (bottom) channels. Error bars represent s.e.m. Scale bar: 100 µm.
Unlike Meox1 and Pax3, which are broadly expressed in the dermomyotome, Pax7 expression is restricted to progenitors in the central dermomyotome (Relaix et al., 2005). In the Pax7-Cre:mTmG tracing system, <50% of adipocytes were labeled in interscapular white and brown depots (Fig. 3A,B, Fig. S5B) with no labeling in other depots examined (Fig. 3C-G, Fig. S5B). As previous findings indicated that Pax7+ progenitors contributed to all brown adipocytes present in late-stage embryos (Lepper and Fan, 2010), it is possible that two distinct progenitor pools exist for brown adipocytes: one for establishing the depot during organogenesis (Pax7+) and one that infiltrates the depot and maintains the adipocyte lineage thereafter (Pax7−) (Jiang et al., 2014). If this were the case, we would predict a high percentage of brown adipocytes to be mGFP+ perinatally, with a gradual decrease with age. To test this possibility, we compared the percentage of mGFP+ brown adipocytes in 1- to 2-day-old pups with that observed in adults. We found no difference between these groups in adipocyte labeling or AP labeling, indicating that Pax7+ embryonic progenitors contribute equally to the establishment and maintenance of the brown adipocyte population (Fig. S1A,B). From these data, we also suggest that a minority of interscapular white and brown adipocytes arise from progenitors that reside in the central dermomyotome, with the rest being derived from a separate region of the dermomyotome.
Fig. 3.
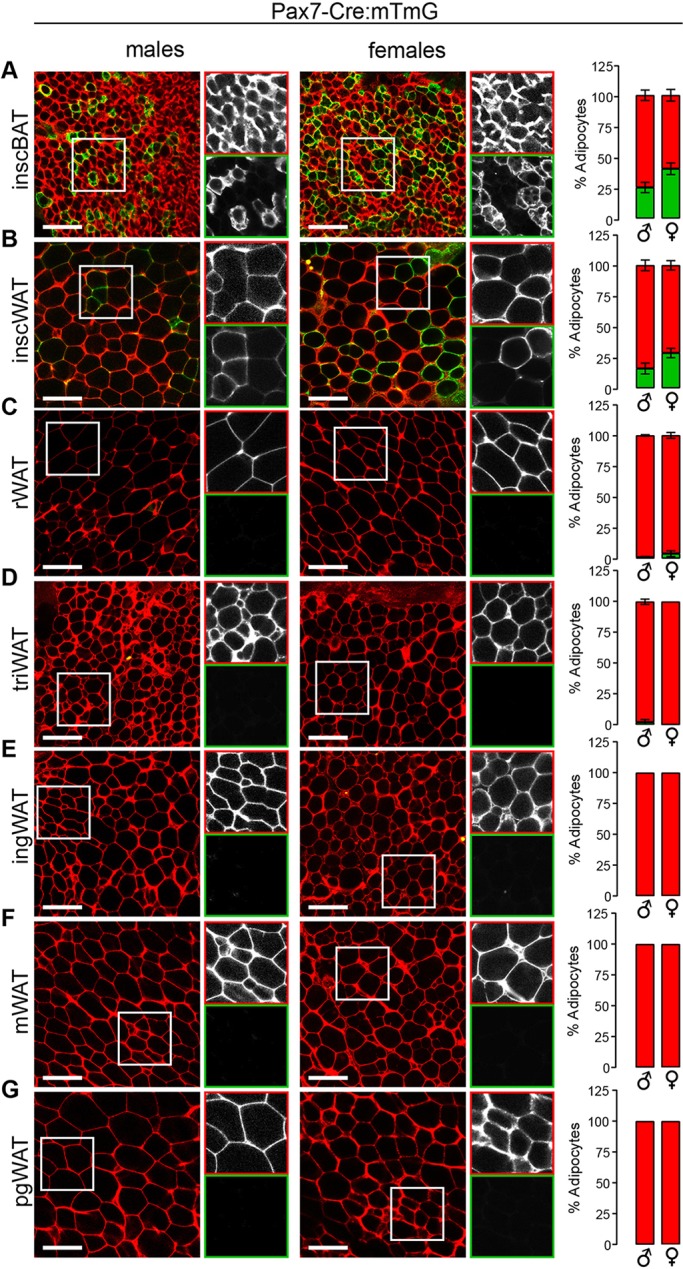
A minority of interscapular white and brown adipocytes originate in the central dermomyotome. (A-G) Images and quantification of the Pax7-Cre:mTmG reporter in interscapular brown adipose tissue (inscBAT) (A), interscapular white adipose tissue (inscWAT) (B), retroperitoneal white adipose tissue (rWAT) (C), triceps white adipose tissue (triWAT) (D), inguinal white adipose tissue (ingWAT) (E), mesenteric white adipose tissue (mWAT) (F), perigonadal white adipose tissue (pgWAT) (G). n=3-7, depending on the depot. Data are from males aged 4-10 weeks and from females aged 4-9 weeks. For each image, the boxed area is shown in black and white for the red (top) and green (bottom) channels. Error bars represent s.e.m. Scale bar: 100 µm.
PLPM contributes to subcutaneous and visceral adipocyte lineages
Because several adipose depots were untraced in the Meox1-Cre system, we determined whether adipocytes also arise from PLPM with the HoxB6-Cre:mTmG model. Indeed, we found remarkable complementarity in the tracing patterns for the Meox1-Cre:mTmG and HoxB6-Cre:mTmG systems, with all depots being reciprocally labeled between them. HoxB6-Cre tracing showed virtually complete labeling of adipocytes in the inguinal subcutaneous depot, as well as in the mesenteric depot, in both males and females (Fig. 4D-F, Fig. S5C), indicating that these visceral and subcutaneous WAT depots share a common developmental origin in the PLPM. The perigonadal depot again showed dramatic sexually dimorphic labeling, with 99.8% of adipocytes in females being mGFP+, whereas in males a mere 5.3% were mGFP+ (Fig. 4G). This indicates that the female perigonadal adipocyte lineage arises from PLPM, but that in males, PLPM contributes only minimally to these cells. These data are consistent with previous findings showing that a substantial proportion of visceral adipocytes, but not subcutaneous adipocytes, are derived from WT1+ progenitors between embryonic day (E) 14.5 and E16.5 (Chau et al., 2014). From these observations it was proposed that most visceral adipocytes arise from lateral plate mesoderm, with a possible contribution from intermediate mesoderm (Chau et al., 2014). However, by E14.5 the lateral plate mesoderm and intermediate mesoderm no longer exist (Diez-Roux et al., 2011), and their roles as tissues-of-origin can only be inferred. Furthermore, WT1-tracing was unable to inform an ontogeny for subcutaneous adipocytes and was performed exclusively in male mice, preventing the identification of sexual dimorphism among adipocyte lineages.
Fig. 4.
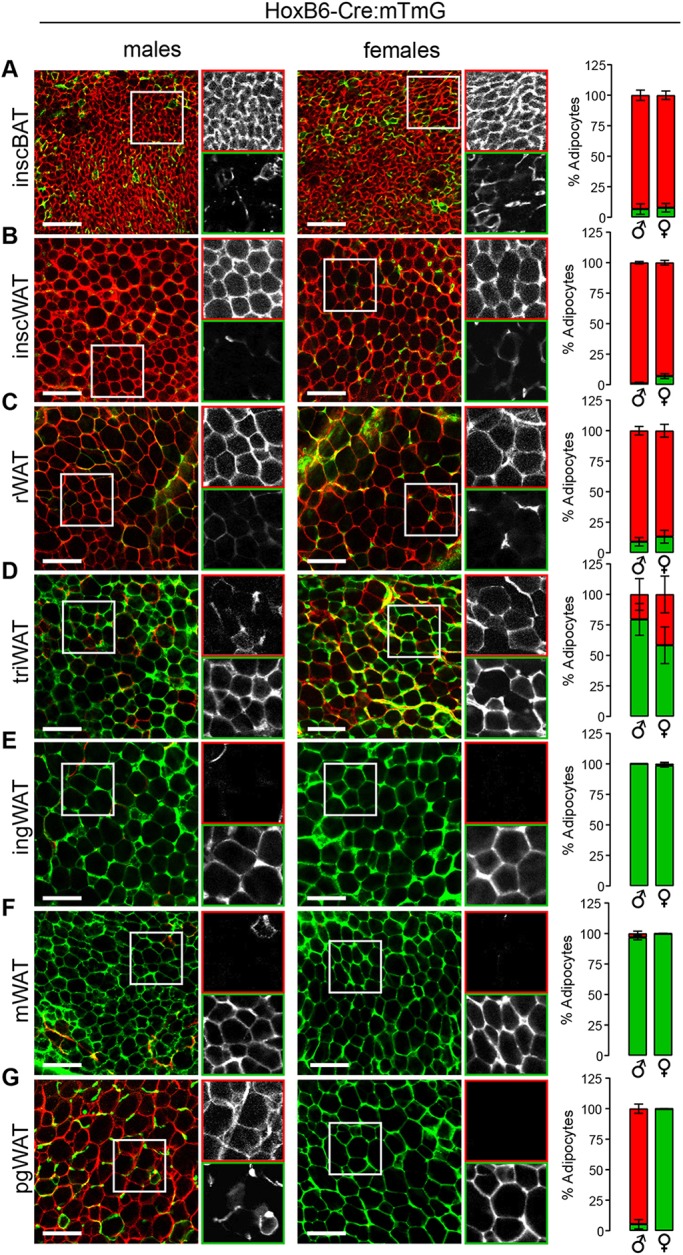
Adipocytes populating major ventro-lateral adipose depots share a common lineage. (A-G) Images and quantification of HoxB6-Cre:mTmG reporter in interscapular brown adipose tissue (inscBAT) (A), interscapular white adipose tissue (inscWAT) (B), retroperitoneal white adipose tissue (rWAT) (C), triceps white adipose tissue (triWAT) (D), inguinal white adipose tissue (ingWAT) (E), mesenteric white adipose tissue (mWAT) (F), perigonadal white adipose tissue (pgWAT) (G). n=4-6, depending on the depot. Data are from males aged 5 weeks±3 days and from females aged 5-7 weeks. For each image, the boxed area is shown in black and white for the red (top) and green (bottom) channels. Error bars represent s.e.m. Scale bar: 100 µm.
To test whether adipocytes traced in the HoxB6-Cre:mTmG system arise from bona fide gastrulation-stage PLPM, we used a tamoxifen-inducible tracing system (HoxB6-CreERT:mTmG) to perform a pulse-chase experiment, in which we transiently induced Cre activity at E8.5, the time at which PLPM takes on its characteristic sac-like architecture (Lowe et al., 2000; Nguyen et al., 2009). At 4-6 weeks of age, adipose depots were harvested and analyzed for mGFP+/mTomato+ adipocytes. We observed an overall reduction in mGFP+ cells in the inducible HoxB6-CreERT system compared with the constitutive HoxB6-Cre system (Figs 4 and 5), which is likely due to the abbreviated window of Cre activity (∼12 h) in the inducible system (Nakamura et al., 2006). Interestingly, the reduction in labeling was proportionally greater in the depot directly overlying the tricep (triWAT) relative to the other depots (Fig. 4D-G and 5D-G). As no tracing is observed in adipose tissue when tamoxifen is administered to adult HoxB6-CreERT:mTmG animals (Fig. S6A-C), this can be explained if triWAT (an internal, though not visceral, adipose depot) is mainly derived from the most antero-dorsal domain of PLPM, which appears not to have appreciable Cre activity in either tracing system at E8.5 (Lowe et al., 2000; Nguyen et al., 2009). Rather, triWAT labeling in the constitutive HoxB6-Cre system may be reflective of later embryonic Cre activity in the limb bud mesenchyme (Lowe et al., 2000). This would corroborate the pattern of tracing observed in the Prx1-Cre:mTmG model, in which subcutaneous adipocytes closest to the forelimb display a greater proportion of Prx1 lineage tracing than those more dorsally positioned (Sanchez-Gurmaches et al., 2015). Taken as a whole, these data support the notion that PLPM establishes adipocyte lineages that populate subcutaneous, internal and visceral adipose depots.
Fig. 5.
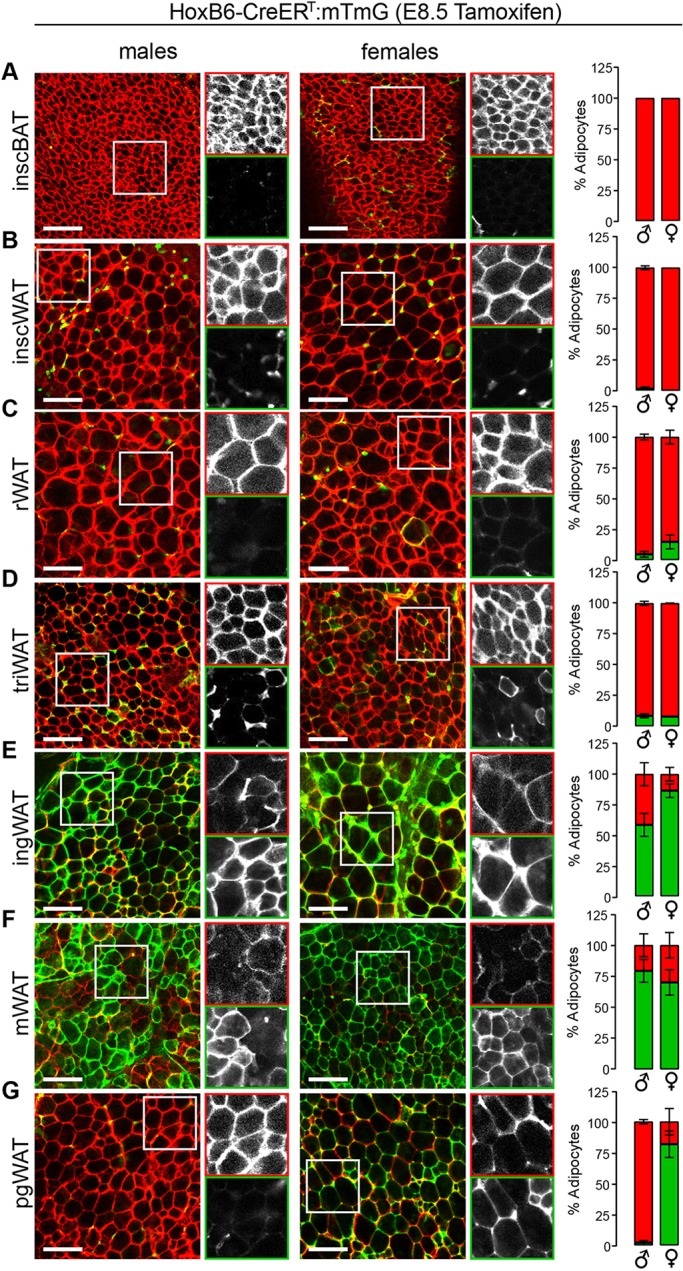
Posterior lateral plate mesoderm establishes ventro-lateral adipocytes. (A-G) Images and quantification of HoxB6-CreERT:mTmG reporter in interscapular brown adipose tissue (inscBAT) (A), interscapular white adipose tissue (inscWAT) (B), retroperitoneal white adipose tissue (rWAT) (C), triceps white adipose tissue (triWAT) (D), inguinal white adipose tissue (ingWAT) (E), mesenteric white adipose tissue (mWAT) (F), perigonadal white adipose tissue (pgWAT) (G). n=3-5, depending on the depot. Data are from males aged 5 weeks±2 days and from females aged 4-5 weeks. For each image, the boxed area is shown in black and white for the red (top) and green (bottom) channels. Error bars represent s.e.m. Scale bar: 100 µm.
Anatomical distribution and developmental lineage-independent activity of APs
In conjunction with adipocyte tracing, we quantified the percentage of mGFP+/mTomato+ APs residing in each depot by flow cytometry, according to their cell surface marker profile (CD45−, CD31−, CD29+, CD34+, Sca1+ and CD24+/−) (Fig. S2A) (Berry and Rodeheffer, 2013; Rodeheffer et al., 2008). APs were designated mGFP+ or mTomato+ according to a stringent gating strategy (Fig. S2A) in which cells not meeting these criteria were designated unlabeled. Notably, double-positive (mGFP+ and mTomato+) APs were common in the inducible HoxB6-CreERT:mTmG system, which was likely because of mono-allelic recombination at the mTmG locus in homozygous animals. Thus, we included double-positive APs in the mGFP+ count (Fig. S2B) as the presence of mGFP indicates Cre was active in an ancestor of those cells.
The depot-specific labeling patterns for APs in respective tracing systems mirrors patterns observed for adipocytes (Fig. 6), which indicates that embryonic progenitors from a given mesodermal subcompartment establish the AP and adipocyte populations in equal proportions for each adipose depot to which they contribute. To assess this relationship further, we generated scatter plots in which mGFP+ adipocytes and mGFP+ APs from individual animals were plotted on the x- and y-axes, respectively (Fig. S3). If the percentage of mGFP+ adipocytes and APs are similar for a particular depot across different animals then data points will cluster together. If the percentage of mGFP+ adipocytes and APs are similar in a single animal, but not across different animals, a linear relationship in data points for a given depot will be observed. Most depots follow one of these patterns in all tracing systems (Fig. S3). However, the male perigonadal depot of the Meox1-Cre:mTmG system stands as a noteworthy exception. Here, mGFP+ adipocyte populations range from 19.7% to 89% between animals, whereas the mGFP+ AP population is consistently around 50% in every animal analyzed (Fig. S3A, orange). This observation can be explained if two conditions are met: an unequal distribution of mGFP+ (i.e. somite-derived) adipocytes exists within the depot and the quantification of somite-derived adipocytes was unintentionally skewed for each animal due to non-uniform sampling across the depot.
Fig. 6.
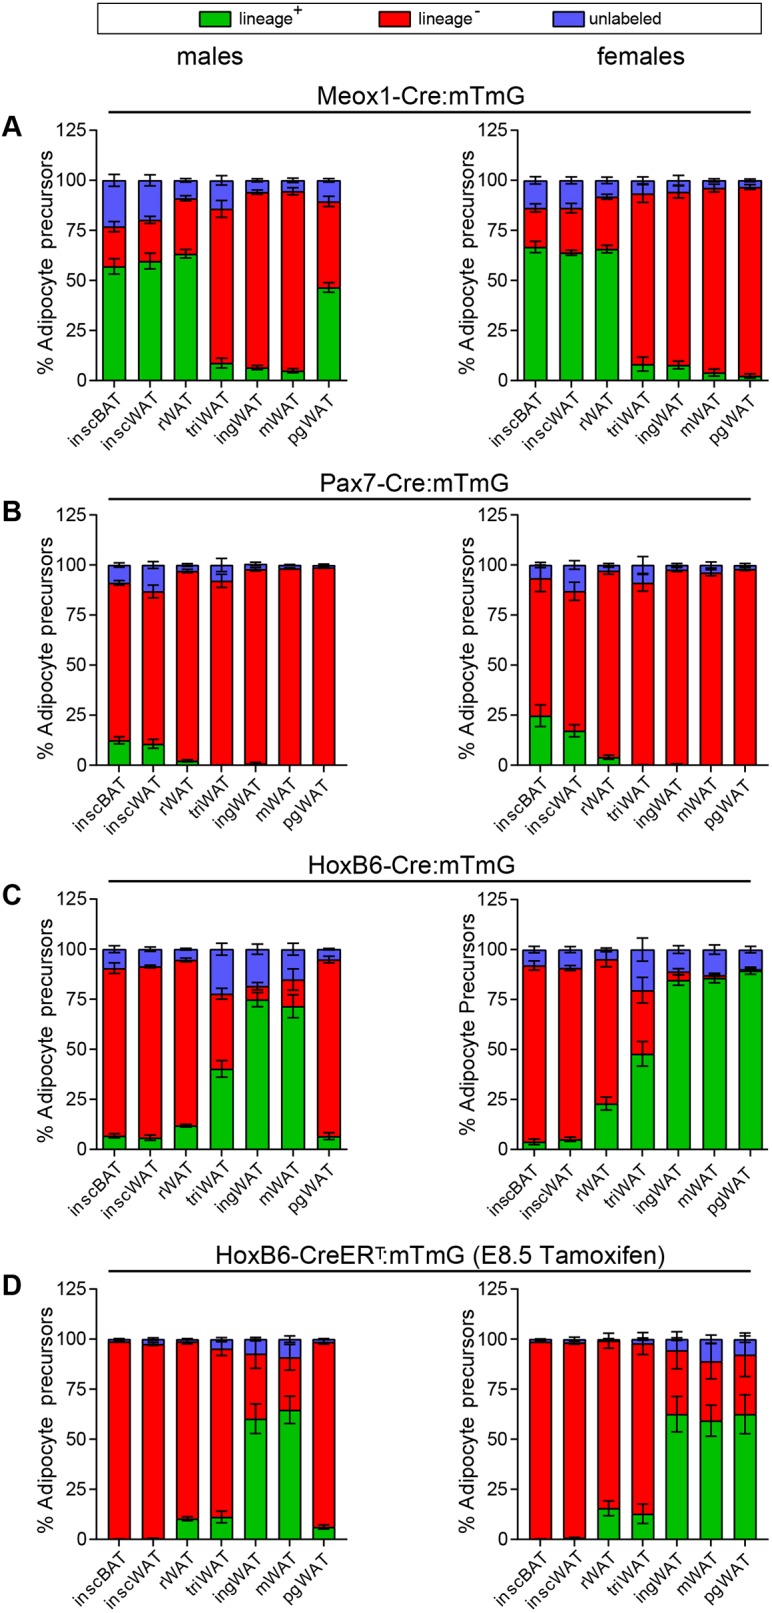
Lineage tracing patterns for depot-resident APs. (A-D) AP tracing for seven major adipose depots, according to the gating strategy shown in Fig. S2A,B: Meox1-Cre:mTmG, in males (n=7-8) and females (n=6-7) (A), Pax7-Cre:mTmG, in males (n=5-7) and females (n=3-5) (B), HoxB6-Cre:mTmG, in males (n=4) and females (n=5-6) (C), HoxB6-CreERT:mTmG, in males (n=4) and females (n=3-5) (D). Green, mGFP+ APs; red, mTomato+ APs; blue, unlabeled APs.
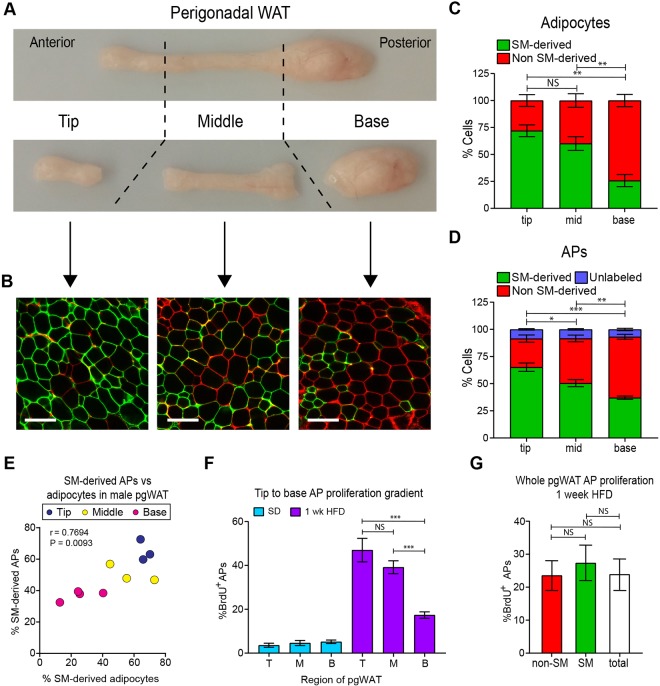
To test whether somite-derived adipocytes and APs are differentially distributed in the male perigonadal depot, we divided the depot into tip (anterior), middle, and base (posterior) and analyzed tracing for each region separately (Fig. 7A,B). Remarkably, we found a gradient of somite-derived adipocytes along the depot axis (Fig. 7C). In addition, APs follow the same pattern along the anterior-posterior axis of the depot, with higher levels of somite-derived cells in the tip compared with in the base (Fig. 7D). Adipocyte and AP tracing are concordant in each region of the depot (Fig. 7E). These data indicate that pooling APs from the whole depot, as in Fig. 6, masked our ability to detect this aspect of patterning in the male perigonadal adipocyte lineage.
Fig. 7.
The tissue microenvironment, not developmental lineage, controls obesogenic AP proliferation in male perigonadal fat. (A) Anatomy of male perigonadal white adipose tissue (pgWAT) with tip, middle and base indicated. (B) Representative confocal images of tip, middle and base of pgWAT from male Meox1-Cre:mTmG animals. (C) Quantification of mGFP+/mTomato+ adipocytes in noted regions of male Meox1-Cre:mTmG pgWAT (n=4). (D) Quantification of mGFP+/mTomato+ APs in noted regions of male Meox1-Cre:mTmG pgWAT (n=3-4). (E) Scatterplot indicating concordant tracing of adipocytes and APs in each region of male Meox1-Cre:mTmG pgWAT. Each dot represents the percentage of APs and adipocytes that are mGFP+ for the indicated region of the depot in one animal (n=3-4). As the pgWAT depot exists in a pair, one depot was used for quantifying adipocyte labeling and the other for AP labeling. Significance was determined using Pearson's two-tailed correlation analysis. (F) BrdU incorporation into APs of tip, middle and base of male pgWAT after 1 week of HFD (n=5). (G) BrdU incorporation into somite-derived (mGFP+) and non-somite-derived (mTomato+) APs of male Meox1-Cre:mTmG pgWAT (n=6). Error bars represent s.e.m. *P<0.05, **P<0.01, ***P<0.001 (unpaired two-tailed Student's t-test on indicated groups in C,D,F,G, significance determined using mGFP+ cells in C and D). B, base; HFD, high fat diet; M, mid; NS, not significant; SD, standard diet; SM, somitic mesoderm; T, tip. Scale bar: 100 µm.
Given these observations, we next aimed to gauge the relative contribution of ontogenetic and microenvironmental factors that control the activity of APs that reside in a single depot, yet are derived from different developmental lineages. We have previously shown that male perigonadal APs respond to a HFD by proliferating and differentiating into adipocytes (Jeffery et al., 2015), but it is unclear whether this response is biased to a particular AP lineage or region of the depot. We thus sought to identify whether HFD-induced AP proliferation is influenced by the developmental origin or intra-depot location of APs, by quantifying bromodeoxyuridine (BrdU) incorporation into these AP subpopulations upon HFD stimulus. Surprisingly, APs from the tip of the depot proliferate more in response to a HFD compared with those in the base (Fig. 7F). However, the APs from the somite-derived and non-somite-derived lineages proliferate at comparable rates throughout the depot (Fig. 7G), indicating that the regional response of APs to a HFD within the male perigonadal depot is independent of developmental origin. Taken together, these data suggest that, under obesogenic conditions, the adipose tissue microenvironment overrides developmental origin effects on AP behavior in male perigonadal fat.
DISCUSSION
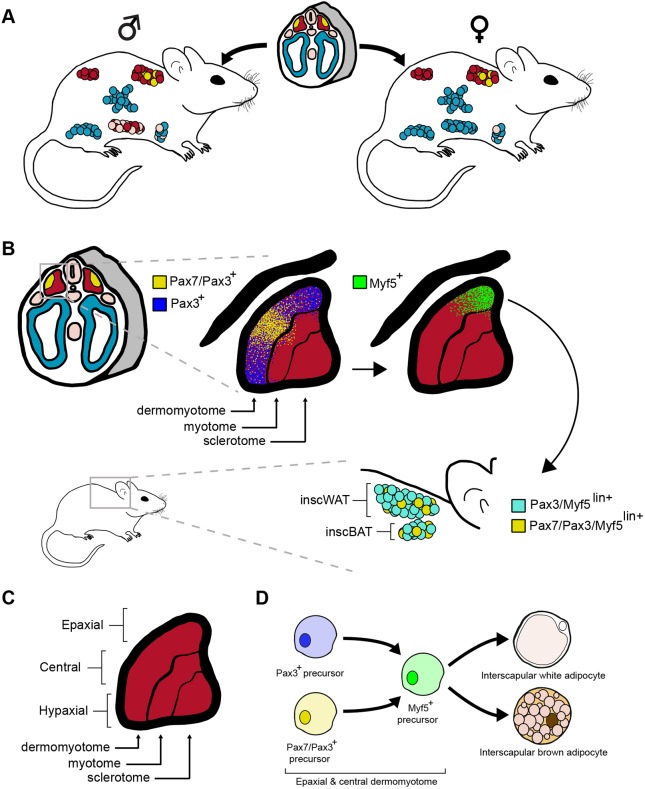
Here, we show adipocyte lineage-tracing patterns for several Cre lines with well-defined mesodermal expression domains, and leverage obesogenic AP proliferation to gauge functional differences between distinct AP lineages in the male perigonadal fat depot. We present evidence that indicates interscapular white and brown adipocyte lineages arise from somitic mesoderm, but only a minority of these cells arise from Pax7+ progenitors in the central dermomyotome. Moreover, we demonstrate complementary labeling patterns in non-overlapping adipocyte lineages for the Meox1-Cre:mTmG and HoxB6-Cre:mTmG tracing systems. These data strongly suggest that both brown and white adipocytes of the dorso-axial adipocyte lineages, and a large proportion of the male perigonadal adipocyte lineage, arise from somitic mesoderm and therefore share a common progenitor pool with muscle, whereas adipocyte lineages populating other major depots mainly originate from PLPM (Fig. 8A).
Fig. 8.
A mesodermal fate map for adipose tissue. (A) Schematic showing the mesodermal fate map for adipose tissue based on tracing with Meox1-Cre:mTmG, Pax7-Cre:mTmG and HoxB6-Cre:mTmG systems. Red, somitic mesoderm and derivative adipocyte lineages; yellow, central dermomyotome and derivative adipocyte lineages; blue, posterior lateral plate mesoderm and derivative adipocyte lineages. (B) Schematic showing a model fate map for interscapular adipocyte lineages based on Pax7-Cre:mTmG tracing in this study and Pax3/Myf5-Cre:mTmG tracing by Sanchez-Gurmaches and Guertin (2014). It is proposed that a subset of Pax3+ progenitors in the epaxial dermomyotome and Pax7/Pax3+ progenitors in the central dermomyotome are fated to the interscapular adipocyte lineage. These Pax3+ or Pax7/Pax3+ cells acquire Myf5 expression in a Pax3-dependent manner (Sato et al., 2010) and go on to establish interscapular white and brown adipocytes. (C) Schematic of somite subcompartments. (D) Model lineage hierarchy for interscapular adipocytes based on Pax7-Cre:mTmG tracing in this study and Pax3/Myf5-Cre:mTmG tracing by Sanchez-Gurmaches and Guertin (2014).
The finding that Pax7+ progenitors of the central dermomyotome do not contribute to the majority of the interscapular brown adipocyte lineage is surprising given the intense staining of BAT observed by Lepper and Fan (2010) in late-stage Pax7-CreERT2:lacZ embryos. A possible explanation for this discrepancy is the use of different reporters (lacZ versus mTmG), as noted previously. The use of different Cre strains could also contribute to this. Our group used a constitutive Pax7-Cre knock-in that does not disrupt endogenous Pax7 function (Keller et al., 2004), whereas the previous report used a knock-in strain that disrupts the Pax7 locus; animals were therefore heterozygous for a functional Pax7 gene in this tracing paradigm (Lepper and Fan, 2010), which could potentially alter lineage specification if gene dosage is affected (Buckingham and Relaix, 2007; Graf and Enver, 2009). Indeed, similar to our findings here, Atit and colleagues previously cited unpublished data suggesting that not all BAT arises from progenitors of the central dermomyotome (Atit et al., 2006).
Meox1-Cre:mTmG lineage tracing in this study, and the previously published adipocyte fate map for Pax3-Cre:mTmG (Sanchez-Gurmaches and Guertin, 2014), do, however, strongly suggest a dermomyotomal origin for cells of the interscapular adipocyte lineage (including those of the intrascapular WAT depot). In support of this notion, Myf5-Cre:mTmG tracing largely overlaps with Meox1-Cre and Pax3-Cre based paradigms, except there is no labeling of male perigonadal adipocytes in this system (Sanchez-Gurmaches and Guertin, 2014). It is known that Myf5 is expressed along a dorsoventral gradient in the dermomyotome, with the strongest expression occurring in progenitors of the epaxial dermomyotome (Teboul et al., 2002). Indeed, Pax3 activity precedes, and is required for, Myf5 expression in the epaxial dermomyotome (Sato et al., 2010). Taking these observations together, we propose a fate map in which interscapular brown adipocytes predominately arise from a Pax3+/Myf5+ lineage originating in the epaxial dermomyotome, with a minor contribution from progenitors in the central dermomyotome that express Pax7, Pax3 and Myf5 as they proceed through development (Fig. 8B-D).
It follows that Meox1Lin+ and Pax3Lin+ adipocytes in the male perigonadal depot arise from hypaxial dermomyotome, as neither Pax7 or Myf5 are appreciably expressed in this domain (Fig. 8A,B) (Lepper and Fan, 2010; Relaix et al., 2005; Sato et al., 2010; Teboul et al., 2002). Even so, the developmental origin for a significant proportion (35-40%) of male perigonadal adipocytes remains unclear. As this depot is tightly associated with the epididymis, it is possible that these cells are derived from intermediate mesoderm, which is known to give rise to most organs of the urogenital tract (Davidson, 2009; Torres et al., 1995). However, precise lineage-tracing tools that specifically mark intermediate mesoderm, and no other mesodermal subcompartments, will need to be developed in order to determine if this is the case. Moreover, inducible tracing from E8.5 with the HoxB6-CreERT:mTmG system clearly demonstrates that several visceral adipocyte lineages share a common developmental origin in the PLPM with the inguinal subcutaneous adipocyte lineage. It is not until later in fetal development, possibly during limb bud formation between E9.5 and E11.5 (Logan et al., 2002), that visceral (WT1Lin+) and subcutaneous (Prx1Lin+) adipocyte lineages diverge (Fig. S4) (Chau et al., 2014; Sanchez-Gurmaches et al., 2015).
Finally, the observation that HFD-induced AP proliferation in male perigonadal fat is positionally dependent, but not lineage dependent, supports the notion that the depot microenvironment plays a significant role in AP behavior. Indeed, it has been shown that reciprocal transplantation of APs between perigonadal and subcutaneous depots results in transplanted APs taking on the behavior of host-depot APs when challenged with HFD (Jeffery et al., 2016). This is particularly fascinating given that, in males, perigonadal and subcutaneous APs arise from distinct mesodermal progenitor pools. Despite these findings, the local signaling events required to mediate the differential responses of APs to HFD within and between depots remain unknown. Furthermore, whether the anterior-posterior gradient of somite-derived adipocyte lineage cells is functionally relevant in the adult or simply reflects developmental patterning is not clear.
Altogether, these data provide insight into the developmental ancestry of major adipose depots and show that AP behavior in the obesogenic conditions assessed here is reliant on microenvironmental factors, not ontogeny. Further studies will be required to identify the mechanisms by which distinct adipocyte lineages are specified in the embryo and whether such lineage heterogeneity confers stable functional divergence among them. It will also be crucial to account for crosstalk among adipocyte, hematopoietic and endothelial cell lineages between and within depots to further understand adipose tissue homeostasis and how it is deranged in diseases such as obesity and lipodystrophy.
MATERIALS AND METHODS
Animals
Meox1-Cre mice (Jukkola et al., 2005) were a generous gift from Dr Maria Barna at Stanford University, CA, USA. HoxB6-Cre (Lowe et al., 2000) and HoxB6-CreERT mice (Nguyen et al., 2009) were generous gifts from Dr Scott Weatherbee at Yale University, CT, USA. Pax7-Cre mice (Keller et al., 2004) (stock 010530) were acquired from The Jackson Laboratory. Mice were 4-10 weeks of age unless otherwise noted. For AP proliferation assays, mice were treated with 0.8 mg/ml BrdU (United States Biological, B2850) in drinking water for 1 week using lightproof bottles. Fresh BrdU water was administered every 2 days. For gestational tamoxifen treatment of HoxB6-CreERT:mTmG mice, pregnant dams were intraperitoneally injected with 50 mg/kg tamoxifen (Sigma-Aldrich, T5648) and 25 mg/kg progesterone (Sigma-Aldrich, P3972) dissolved in vegetable oil at E8.5. Progesterone was co-administered with tamoxifen in order to offset tamoxifen's estrogenic activity in the uterus, which can result in endometrial hyperplasia, late fetal abortion and dystocia (Nakamura et al., 2006; Shang and Brown, 2002). The standard chow diet was from Harlan Laboratories (2018S) and the HFD from Research Diets (D12492). All experiments followed guidelines outlined by Yale University's Institutional Animal Care and Use Committee (IACUC).
Whole-mount and confocal imaging
Adipose depots were dissected and cut into ∼1.5×1.5 cm chunks. These were immediately mounted onto microscope slides with Fluoromount-G (SouthernBiotech, 0100-01) and imaged on a Leica TCS SP5 confocal microscope. Images were taken with either 40× or 20× objectives and cropped to scale accordingly. Brightness and contrast were adjusted for select images to improve the visibility of cell membranes, and mGFP+/mTomato+ adipocytes were quantified using the multi-point tool in ImageJ software (Schindelin et al., 2015; Schneider et al., 2012).
Flow cytometry
Adipose tissue digestion and isolation of stromal vascular cells were performed as described previously (Berry and Rodeheffer, 2013; Church et al., 2014; Jeffery et al., 2015). These cells were then stained with the following antibodies on ice in the dark for 30-60 min in 1× Hank's Buffered Salt Solution (HBSS) (Gibco, 14185-052)+3% bovine serum albumin (BSA) (AmericanBio, 9048-46-8): CD29 Alexa Fluor 700 (BioLegend, 102218, clone HMβ1-1, 1:400), CD31 PE-Cy7 (eBioscience, 25-0311-82, clone 390, 1:1000), Sca-1 V450 (BD Biosciences, 560653, clone D7, 1:500), CD45 APC-eFluor 780 (eBioscience, 47-0451-80, clone 30-F11, 1:2000), CD24 PerCP-Cyanine 5.5 (eBioscience, 45-0242-82, clone M1/69, 1:400) and CD34 Alexa Fluor 647 (BioLegend, 119314, clone MEC14.7, 1:400). Following antibody staining, the cells were washed with HBSS+3% BSA and analyzed on a BD Biosciences LSRII flow cytometer. For BrdU analysis, the same tissue digestion procedure was carried out as noted above. Cells were then stained with the following antibodies for 30 min on ice in the dark: CD29 Alexa Fluor 700 (BioLegend, 102218, clone HMβ1-1, 1:400), CD31 PE-Cy7 (eBioscience, 25-0311-82, clone 390, 1:500), Sca-1 V500 (BD Biosciences, 561229, clone D7, 1:250), CD45 APC-eFluor 780 (eBioscience, 47-0451-80, clone 30-F11, 1:500). Following this, cells were washed in HBSS+3% BSA, then fixed and permeabilized with Phosflow Lyse/Fix (BD Biosciences, 558049) and Perm Buffer III (BD Biosciences, 558050) according to the manufacturer's instructions. Cells were then treated with DNase (Deoxyribonuclease I, Worthington Biochemical, ∼500 units/ml) in dPBS with calcium and magnesium (Sigma-Aldrich, D8662) for 90 min in a 37°C water bath. Cells were washed in HBSS+3% BSA and stained overnight in the dark at 4°C with anti-BrdU antibody (Alexa Fluor 647, Phoenix Flow Systems, AX647, clone 3D4, 1:30). The next day, cells were washed with HBSS+3% BSA and stained with the following antibodies for 60 min at room temperature in the dark: CD24 PerCP-Cyanine 5.5 (eBioscience, 45-0242-82, clone M1/69, 1:200), CD34 Brilliant Violet 421 (BioLegend, 119321, clone MEC14.7, 1:400), CD29 Alexa Fluor 700 (BioLegend, 102218, clone HMβ1-1, 1:400), CD31 PE-Cy7 (eBioscience, 25-0311-82, clone 390, 1:500), Sca-1 V500 (BD Biosciences, 561229, clone D7, 1:250), CD45 APC-eFluor 780 (eBioscience, 47-0451-80, clone 30-F11, 1:500).
Statistical analysis
Statistical analyses are denoted in each figure legend. All tests were performed using GraphPad Prism version 7.0. Data are presented as mean±s.e.m. and P<0.05 was considered statistically significant. A minimum number of three biological replicates (i.e. three mice) were used for each experiment. Experiments were not blinded, as genotypes of mice were known prior to analysis. Samples were excluded if mice displayed fight wounds, appeared otherwise unhealthy or if technical error occurred during an experimental procedure.
Supplementary Material
Acknowledgements
The authors thank Zuzana Tobiasova of the Yale Stem Cell Center FACS Core and Thomas Ardito of the Yale Stem Cell Center Confocal Microscope Core for technical assistance and advice in flow cytometry and confocal microscopy, respectively.
Footnotes
Competing interests
The authors declare no competing or financial interests.
Author contributions
Conceptualization: Z.L.S., M.R.; Methodology: Z.L.S., M.S.R.; Validation: Z.L.S.; Formal analysis: Z.L.S., E.J.; Investigation: Z.L.S., E.J., B.H.; Resources: M.S.R.; Data curation: Z.L.S., E.J., B.H.; Writing - original draft: Z.L.S.; Writing - review & editing: Z.L.S., E.J., M.S.R.; Visualization: Z.L.S.; Supervision: M.S.R.; Project administration: Z.L.S.; Funding acquisition: M.S.R.
Funding
This work was supported by a National Science Foundation Graduate Research Fellowship (DGE1122492 to Z.L.S.), and by the National Institute of Diabetes and Digestive and Kidney Diseases (DK090489 and DK110147 to M.S.R.). Deposited in PMC for release after 12 months.
Supplementary information
Supplementary information available online at http://dev.biologists.org/lookup/doi/10.1242/dev.166801.supplemental
References
- Atit R., Sgaier S. K., Mohamed O. A., Taketo M. M., Dufort D., Joyner A. L., Niswander L. and Conlon R. A. (2006). β-catenin activation is necessary and sufficient to specify the dorsal dermal fate in the mouse. Dev. Biol. 296, 164-176. 10.1016/j.ydbio.2006.04.449 [DOI] [PubMed] [Google Scholar]
- Berry R. and Rodeheffer M. S. (2013). Characterization of the adipocyte cellular lineage in vivo. Nat. Cell Biol. 15, 302 10.1038/ncb2696 [DOI] [PMC free article] [PubMed] [Google Scholar]
- Brand T. (2003). Heart development: molecular insights into cardiac specification and early morphogenesis. Dev. Biol. 258, 1-19. 10.1016/S0012-1606(03)00112-X [DOI] [PubMed] [Google Scholar]
- Brent A. E. and Tabin C. J. (2002). Developmental regulation of somite derivatives: muscle, cartilage and tendon. Curr. Opin. Genet. Dev. 12, 548-557. 10.1016/S0959-437X(02)00339-8 [DOI] [PubMed] [Google Scholar]
- Buckingham M. and Relaix F. (2007). The role of Pax genes in the development of tissues and organs: Pax3 and Pax7 regulate muscle progenitor cell functions. Annu. Rev. Cell Dev. Biol. 23, 645-673. 10.1146/annurev.cellbio.23.090506.123438 [DOI] [PubMed] [Google Scholar]
- Buckingham M., Bajard L., Chang T., Daubas P., Hadchouel J., Meilhac S., Montarras D., Rocancourt D. and Relaix F. (2003). The formation of skeletal muscle: from somite to limb. J. Anat. 202, 59-68. 10.1046/j.1469-7580.2003.00139.x [DOI] [PMC free article] [PubMed] [Google Scholar]
- Cannon B. and Nedergaard J. (2004). Brown adipose tissue: function and physiological significance. Physiol. Rev. 84, 277-359. 10.1152/physrev.00015.2003 [DOI] [PubMed] [Google Scholar]
- Chau Y.-Y., Bandiera R., Serrels A., Martínez-Estrada O. M., Qing W., Lee M., Slight J., Thornburn A., Berry R. and McHaffie S. (2014). Visceral and subcutaneous fat have different origins and evidence supports a mesothelial source. Nat. Cell Biol. 16, 367-375. 10.1038/ncb2922 [DOI] [PMC free article] [PubMed] [Google Scholar]
- Church C. D., Berry R. and Rodeheffer M. S. (2014). Isolation and study of adipocyte precursors. Methods in Enzymology 537, 31-46. 10.1016/B978-0-12-411619-1.00003-3 [DOI] [PMC free article] [PubMed] [Google Scholar]
- Cypess A. M., Lehman S., Williams G., Tal I., Rodman D., Goldfine A. B., Kuo F. C., Palmer E. L., Tseng Y.-H. and Doria A. (2009). Identification and importance of brown adipose tissue in adult humans. N. Engl. J. Med. 360, 1509-1517. 10.1056/NEJMoa0810780 [DOI] [PMC free article] [PubMed] [Google Scholar]
- Davidson A. J. (2009). Mouse Kidney Development. In StemBook (ed. The Stem Cell Research Community). 10.3824/stembook.1.34.1 [DOI] [Google Scholar]
- de Jong J. M. A., Larsson O., Cannon B. and Nedergaard J. (2015). A stringent validation of mouse adipose tissue identity markers. Am. J. Physiol. Endocrinol. Metab. 308, E1085-E1105. 10.1152/ajpendo.00023.2015 [DOI] [PubMed] [Google Scholar]
- Diez-Roux G., Banfi S., Sultan M., Geffers L., Anand S., Rozado D., Magen A., Canidio E., Pagani M. and Peluso I. (2011). A high-resolution anatomical atlas of the transcriptome in the mouse embryo. PLoS Biol. 9, e1000582 10.1371/journal.pbio.1000582 [DOI] [PMC free article] [PubMed] [Google Scholar]
- Graf T. and Enver T. (2009). Forcing cells to change lineages. Nature 462, 587 10.1038/nature08533 [DOI] [PubMed] [Google Scholar]
- Jeffery E., Berry R., Church C. D., Yu S., Shook B. A., Horsley V., Rosen E. D. and Rodeheffer M. S. (2014). Characterization of Cre recombinase models for the study of adipose tissue. Adipocyte 3, 206-211. 10.4161/adip.29674 [DOI] [PMC free article] [PubMed] [Google Scholar]
- Jeffery E., Church C. D., Holtrup B., Colman L. and Rodeheffer M. S. (2015). Rapid depot-specific activation of adipocyte precursor cells at the onset of obesity. Nat. Cell Biol. 17, 376 10.1038/ncb3122 [DOI] [PMC free article] [PubMed] [Google Scholar]
- Jeffery E., Wing A., Holtrup B., Sebo Z., Kaplan J. L., Saavedra-Peña R., Church C. D., Colman L., Berry R. and Rodeheffer M. S. (2016). The adipose tissue microenvironment regulates depot-specific adipogenesis in obesity. Cell Metab. 24, 142-150. 10.1016/j.cmet.2016.05.012 [DOI] [PMC free article] [PubMed] [Google Scholar]
- Jiang Y., Berry D. C., Tang W. and Graff J. M. (2014). Independent stem cell lineages regulate adipose organogenesis and adipose homeostasis. Cell Reports 9, 1007-1022. 10.1016/j.celrep.2014.09.049 [DOI] [PMC free article] [PubMed] [Google Scholar]
- Jukkola T., Trokovic R., Maj P., Lamberg A., Mankoo B., Pachnis V., Savilahti H. and Partanen J. (2005). Meox1Cre: a mouse line expressing Cre recombinase in somitic mesoderm. Genesis 43, 148-153. 10.1002/gene.20163 [DOI] [PubMed] [Google Scholar]
- Keller C., Hansen M. S., Coffin C. M. and Capecchi M. R. (2004). Pax3: Fkhr interferes with embryonic Pax3 and Pax7 function: implications for alveolar rhabdomyosarcoma cell of origin. Genes Dev. 18, 2608-2613. 10.1101/gad.1243904 [DOI] [PMC free article] [PubMed] [Google Scholar]
- Khan T., Muise E. S., Iyengar P., Wang Z. V., Chandalia M., Abate N., Zhang B. B., Bonaldo P., Chua S. and Scherer P. E. (2009). Metabolic dysregulation and adipose tissue fibrosis: role of collagen VI. Mol. Cell. Biol. 29, 1575-1591. 10.1128/MCB.01300-08 [DOI] [PMC free article] [PubMed] [Google Scholar]
- Lang D., Lu M. M., Huang L., Engleka K. A., Zhang M., Chu E. Y., Lipner S., Skoultchi A., Millar S. E. and Epstein J. A. (2005). Pax3 functions at a nodal point in melanocyte stem cell differentiation. Nature 433, 884 10.1038/nature03292 [DOI] [PubMed] [Google Scholar]
- Lee M.-J., Wu Y. and Fried S. K. (2013). Adipose tissue heterogeneity: implication of depot differences in adipose tissue for obesity complications. Mol. Asp. Med. 34, 1-11. 10.1016/j.mam.2012.10.001 [DOI] [PMC free article] [PubMed] [Google Scholar]
- Lepper C. and Fan C.-M. (2010). Inducible lineage tracing of Pax7-descendant cells reveals embryonic origin of adult satellite cells. Genesis 48, 424-436. 10.1002/dvg.20630 [DOI] [PMC free article] [PubMed] [Google Scholar]
- Logan M., Martin J. F., Nagy A., Lobe C., Olson E. N. and Tabin C. J. (2002). Expression of Cre Recombinase in the developing mouse limb bud driven by a Prxl enhancer. Genesis 33, 77-80. 10.1002/gene.10092 [DOI] [PubMed] [Google Scholar]
- Lowe L. A., Yamada S. and Kuehn M. R. (2000). HoxB6-Cre transgenic mice express Cre recombinase in extra-embryonic mesoderm, in lateral plate and limb mesoderm and at the midbrain/hindbrain junction. Genesis 26, 118-120. [DOI] [PubMed] [Google Scholar]
- Marcelin G., Ferreira A., Liu Y., Atlan M., Aron-Wisnewsky J., Pelloux V., Botbol Y., Ambrosini M., Fradet M. and Rouault C. (2017). A PDGFRα-mediated switch toward CD9 high adipocyte progenitors controls obesity-induced adipose tissue fibrosis. Cell Metab. 25, 673-685. 10.1016/j.cmet.2017.01.010 [DOI] [PubMed] [Google Scholar]
- Muzumdar M. D., Tasic B., Miyamichi K., Li L. and Luo L. (2007). A global double-fluorescent Cre reporter mouse. Genesis 45, 593-605. 10.1002/dvg.20335 [DOI] [PubMed] [Google Scholar]
- Nakamura E., Nguyen M.-T. and Mackem S. (2006). Kinetics of tamoxifen-regulated Cre activity in mice using a cartilage-specific CreERT to assay temporal activity windows along the proximodistal limb skeleton. Dev. Dyn. 235, 2603-2612. 10.1002/dvdy.20892 [DOI] [PubMed] [Google Scholar]
- Nedergaard J., Bengtsson T. and Cannon B. (2007). Unexpected evidence for active brown adipose tissue in adult humans. Am. J. Physiol. Endocrinol. Metab. 293, E444-E452. 10.1152/ajpendo.00691.2006 [DOI] [PubMed] [Google Scholar]
- Nguyen M.-T., Zhu J., Nakamura E., Bao X. and Mackem S. (2009). Tamoxifen-dependent, inducible Hoxb6CreERT recombinase function in lateral plate and limb mesoderm, CNS isthmic organizer, posterior trunk neural crest, hindgut, and tailbud. Dev. Dyn. 238, 467-474. 10.1002/dvdy.21846 [DOI] [PMC free article] [PubMed] [Google Scholar]
- Onimaru K., Shoguchi E., Kuratani S. and Tanaka M. (2011). Development and evolution of the lateral plate mesoderm: comparative analysis of amphioxus and lamprey with implications for the acquisition of paired fins. Dev. Biol. 359, 124-136. 10.1016/j.ydbio.2011.08.003 [DOI] [PubMed] [Google Scholar]
- Relaix F., Rocancourt D., Mansouri A. and Buckingham M. (2005). A Pax3/Pax7-dependent population of skeletal muscle progenitor cells. Nature 435, 948 10.1038/nature03594 [DOI] [PubMed] [Google Scholar]
- Roberts C. W. M., Shutter J. R. and Korsmeyer S. J. (1994). Hox11 controls the genesis of the spleen. Nature 368, 747 10.1038/368747a0 [DOI] [PubMed] [Google Scholar]
- Rodeheffer M. S., Birsoy K. and Friedman J. M. (2008). Identification of white adipocyte progenitor cells in vivo. Cell 135, 240-249. 10.1016/j.cell.2008.09.036 [DOI] [PubMed] [Google Scholar]
- Rosen E. D. and Spiegelman B. M. (2014). What we talk about when we talk about fat. Cell 156, 20-44. 10.1016/j.cell.2013.12.012 [DOI] [PMC free article] [PubMed] [Google Scholar]
- Rupnick M. A., Panigrahy D., Zhang C.-Y., Dallabrida S. M., Lowell B. B., Langer R. and Folkman M. J. (2002). Adipose tissue mass can be regulated through the vasculature. Proc. Natl Acad. Sci. USA 99, 10730-10735. 10.1073/pnas.162349799 [DOI] [PMC free article] [PubMed] [Google Scholar]
- Sanchez-Gurmaches J. and Guertin D. A. (2014). Adipocytes arise from multiple lineages that are heterogeneously and dynamically distributed. Nat. Commun. 5, 4099 10.1038/ncomms5099 [DOI] [PMC free article] [PubMed] [Google Scholar]
- Sanchez-Gurmaches J., Hsiao W.-Y. and Guertin D. A. (2015). Highly selective in vivo labeling of subcutaneous white adipocyte precursors with Prx1-Cre. Stem Cell Reports 4, 541-550. 10.1016/j.stemcr.2015.02.008 [DOI] [PMC free article] [PubMed] [Google Scholar]
- Sanchez-Gurmaches J., Hung C.-M. and Guertin D. A. (2016). Emerging complexities in adipocyte origins and identity. Trends Cell Biol. 26, 313-326. 10.1016/j.tcb.2016.01.004 [DOI] [PMC free article] [PubMed] [Google Scholar]
- Sato T., Rocancourt D., Marques L., Thorsteinsdóttir S. and Buckingham M. (2010). A Pax3/Dmrt2/Myf5 regulatory cascade functions at the onset of myogenesis. PLoS Genet. 6, e1000897 10.1371/journal.pgen.1000897 [DOI] [PMC free article] [PubMed] [Google Scholar]
- Schindelin J., Rueden C. T., Hiner M. C. and Eliceiri K. W. (2015). The ImageJ ecosystem: An open platform for biomedical image analysis. Mol. Reprod. Dev. 82, 518-529. 10.1002/mrd.22489 [DOI] [PMC free article] [PubMed] [Google Scholar]
- Schneider C. A., Rasband W. S. and Eliceiri K. W. (2012). NIH Image to ImageJ: 25 years of image analysis. Nat. Methods 9, 671 10.1038/nmeth.2089 [DOI] [PMC free article] [PubMed] [Google Scholar]
- Seale P., Sabourin L. A., Girgis-Gabardo A., Mansouri A., Gruss P. and Rudnicki M. A. (2000). Pax7 is required for the specification of myogenic satellite cells. Cell 102, 777-786. 10.1016/S0092-8674(00)00066-0 [DOI] [PubMed] [Google Scholar]
- Seale P., Bjork B., Yang W., Kajimura S., Chin S., Kuang S., Scimè A., Devarakonda S., Conroe H. M. and Erdjument-Bromage H. (2008). PRDM16 controls a brown fat/skeletal muscle switch. Nature 454, 961-967. 10.1038/nature07182 [DOI] [PMC free article] [PubMed] [Google Scholar]
- Shang Y. and Brown M. (2002). Molecular determinants for the tissue specificity of SERMs. Science 295, 2465-2468. 10.1126/science.1068537 [DOI] [PubMed] [Google Scholar]
- Shen W., Wang Z., Punyanita M., Lei J., Sinav A., Kral J. G., Imielinska C., Ross R. and Heymsfield S. B. (2003). Adipose tissue quantification by imaging methods: a proposed classification. Obesity 11, 5-16. 10.1038/oby.2003.3 [DOI] [PMC free article] [PubMed] [Google Scholar]
- Tallquist M. D., Weismann K. E., Hellstrom M. and Soriano P. (2000). Early myotome specification regulates PDGFA expression and axial skeleton development. Development 127, 5059-5070. [DOI] [PubMed] [Google Scholar]
- Teboul L., Hadchouel J., Daubas P., Summerbell D., Buckingham M. and Rigby P. W. (2002). The early epaxial enhancer is essential for the initial expression of the skeletal muscle determination gene Myf5 but not for subsequent, multiple phases of somitic myogenesis. Development 129, 4571-4580. [DOI] [PubMed] [Google Scholar]
- Thors F. and Drukker J. (1997). Serous membranes and their development, structure, and topography In Peritoneal Adhesions (ed. Treutner K.H. and Schumpelick V.). Berlin, Germany: Springer. [Google Scholar]
- Torres M., Gómez-Pardo E., Dressler G. R. and Gruss P. (1995). Pax-2 controls multiple steps of urogenital development. Development 121, 4057-4065. [DOI] [PubMed] [Google Scholar]
- Tribioli C. and Lufkin T. (1999). The murine Bapx1 homeobox gene plays a critical role in embryonic development of the axial skeleton and spleen. Development 126, 5699-5711. [DOI] [PubMed] [Google Scholar]
- Xu H., Barnes G. T., Yang Q., Tan G., Yang D., Chou C. J., Sole J., Nichols A., Ross J. S. and Tartaglia L. A. (2003). Chronic inflammation in fat plays a crucial role in the development of obesity-related insulin resistance. J. Clin. Invest. 112, 1821-1830. 10.1172/JCI200319451 [DOI] [PMC free article] [PubMed] [Google Scholar]
- Zhou B., Ma Q., Rajagopal S., Wu S. M., Domian I., Rivera-Feliciano J., Jiang D., von Gise A., Ikeda S. and Chien K. R. (2008). Epicardial progenitors contribute to the cardiomyocyte lineage in the developing heart. Nature 454, 109 10.1038/nature07060 [DOI] [PMC free article] [PubMed] [Google Scholar]
Associated Data
This section collects any data citations, data availability statements, or supplementary materials included in this article.


