
Figure 2.
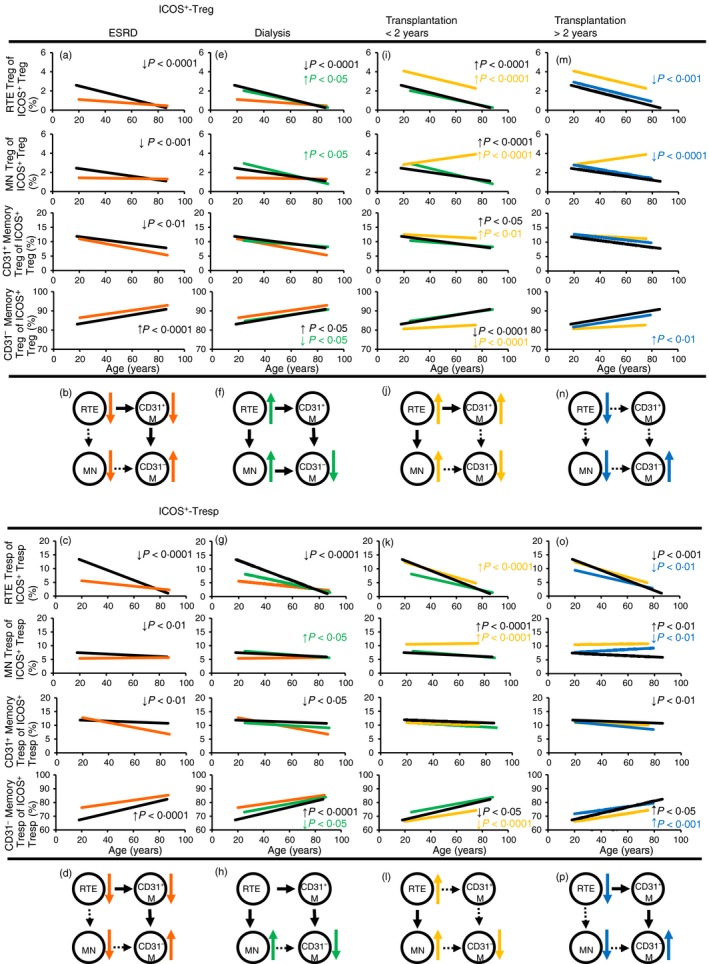
Differentiation of inducible T‐cell co‐stimulator‐positive (ICOS+) regulatory T (Treg)/responder T (Tresp) cells. The percentage of recent thymic emigrant (RTE), mature naive (MN), CD31+ memory and CD31– memory Treg/Tresp cells within total ICOS+ Treg and ICOS+ Tresp cells was estimated in healthy volunteers ( ) compared with end‐stage renal disease (ESRD) patients (
 ) (a, c), ESRD patients compared with dialysis patients (
 ) (e, g), dialysis patients compared with transplant recipients 2 years after transplantation (
 ) (i, k) and transplant recipients < 2 years compared with transplant recipients > 2 years post transplantation (
 ) (m, o). The figures present the regression lines concerning the changes in the percentages of the individual Treg/Tresp subsets with increasing age. Significant differences between the study groups and healthy volunteers are marked by black P‐values. Significant differences between the different study groups are marked in the corresponding colours. A significant decrease/increase is marked by an arrow (
 ). The proposed differentiation pathway of ICOS+ RTE Treg/Tresp cells is shown in (b) and (d) for ESRD patients, in (f) and (h) for dialysis patients, in (j) and (l) for patients transplanted for < 2 years and in (n) and (p) for patients transplanted for > 2 years.