Abstract
Introduction:
Short non-coding micro-RNAs (miRNAs) are post-transcriptional factors that directly regulate protein expression by degrading or inhibiting target mRNAs; however, the role of miRNAs in obesity and cardiometabolic disease remains unclarified. Based on our earlier study demonstrating that miR-150 influences lipid metabolism, we have studied effects of miR-150 on systemic metabolism and adipocyte biology.
Materials and Methods:
Metabolic phenotypes including body weight, food intake, body composition, glucose tolerance and insulin sensitivity were assessed in WT and global miR-150 KO male mice fed a high-fat diet. Molecular changes in epididymal adipose tissue were evaluated through qRT-PCR and Western blotting.
Results:
miR-150 KO mice displayed lower body weight characterized by a reduction in % fat mass while % lean mass was increased. Lower body weight was associated with reduced food consumption and an increase in circulating leptin concentrations, as well as enhanced insulin sensitivity and glucose tolerance compared with WT mice. Absence of miR-150 resulted in increased mTOR expression known to participate in increased leptin production leading to reduction of food intake. Expression of PGC-1α, another target gene of miR-150, was also increased together with upregulation of PPARα and glycerol kinase in adipose tissue as well as other genes participating in triglyceride degradation and lipid oxidation.
Conclusion:
miR-150 KO mice showed metabolic benefits accompanied by reduced body weight, decreased energy intake, and enhanced lipid metabolism. miR-150 may represent both a biomarker and novel therapeutic target regarding obesity and insulin resistance.
1. Introduction
Obesity prevalence among adults in the United States was N35% in 2014 [1]. Obesity-related complications, including type 2 diabetes mellitus (T2DM), coronary heart disease (CHD), and certain types of cancers, exact a high level of morbidity and a reduction in life expectancy [2]. Obesity is defined as excessive body fat, so understanding mechanisms regulating adipose tissue mass and function under different conditions is important for prevention and treatment. Although previous studies have documented micro-RNAs (miRNAs), short non-coding RNA molecules, are involved in pathogenesis of various diseases as regulators of relevant mRNA expression [3,4], their role in the pathophysiology of obesity has not been elucidated.
Previous studies have found that miRNAs act to regulate gene expression relevant to lipid metabolism by either degrading the target mRNA or blocking its translation [5–7]. Our laboratory previously found that miR-150 targets mRNA expression of genes regulating lipid metabolism and cytokine expression in macrophage cells and adipose tissue, and alters cholesterol and triglyceride (TG) accumulation in adipocytes in a process that involves adiponectin receptor 2 (AdipoR2) [8]. Warth et al. found that one of the targets of miR-150 is mechanistic target of rapamycin (mTOR) [9], which regulates leptin expression in adipocytes [10]. Since leptin acts predominantly to regulate food intake [11], miR-150 may play a role in energy balance and the determination of body weight. Another direct target of miR-150 is peroxisome proliferator-activated receptor gamma coactivator-1α (PGC-1α) [12]. PGC-1α regulates lipid metabolism in adipose tissue, and can generate a futile cycle with the simultaneous activation of TG hydrolysis to free fatty acids (FFAs), and re-esterification of FFAs and glycerol to TG [13]. Based on these previous studies demonstrating that both mTOR and PGC-1α were direct targets of miR-150, we hypothesized that miR-150 could have an important regulatory role on systemic metabolism and adipose tissue biology. We therefore have studied miR-150 knockout (KO) mice, and demonstrate that miR-150 ablation lowers body weight and enhances insulin sensitivity, mediated by effects on circulating leptin, food consumption, and lipid metabolism in adipocytes.
2. Methods
2.1. Animals
miR-150 knockout mice (B6(C)-Mir150tm1Rsky/J, cat#007750) and corresponding wild type (WT) control mice (C57BL/6J, cat#000664) were both purchased from The Jackson Laboratory and group-caged according to genotype. They were maintained under conditions of a 12-hour day-night cycle and ad libitum access to food and water. Mice were fed normal a chow diet until 9 weeks old, and thereafter were fed a high-fat diet (HFD) containing 60% of total calories from fat (Research Diets, D12492) beginning at 10 weeks of age. All processes and treatments were approved from UAB Institutional Animal Care and Use Committee (IACUC).
2.2. In Vivo Metabolic Phenotypes
Body weights and food intake were measured every week. Food intake of 23 and 24 weeks could not be measured because mice were in a small animal core in UAB to measure a metabolic phenotype, and they lost weights at 24 weeks because of the same reason. Insulin and glucose tolerance tests (ITT and GTT) were performed when mice were 9 and 10 weeks-old, respectively, to assess insulin sensitivity and glucose tolerance before mice were exposed to HFD. After 4 h of fasting, blood was obtained for measurement of the basal glucose level, and 0.5 U/kg insulin or 2 g/kg glucose for ITT or GTT, respectively, were then administered via intraperitoneal (IP) injection. Following the injections, blood glucose levels were measured at every 30, 60, 90, and 120 min using a glucometer (Arkray glucometer).
After feeding HFD for 16 weeks, ITT and GTT were again performed in control (WT) and experimental (KO) mice to compare the degree of insulin resistance and glucose tolerance between the groups. In addition, body composition, including fat mass, lean mass, and total water, was measured by quantitative magnetic resonance (QMR).
2.3. Sample Collection and Preparation
Following assessments of in vivo metabolism and body composition, mice were sacrificed. Serum and tissue samples were collected, snap-frozen in liquid nitrogen, and stored at −80 °C for later uses.
2.4. Circulating Leptin Concentration
Circulating total leptin concentrations were measured by enzyme-linked immunosorbent assay (ELISA) (Millipore cat#EZML-82K).
2.5. mRNA Expression
To assess differential mRNA expression in mouse tissues, total RNA was extracted from epididymal adipose tissue using a miRNeasy Mini Kit (Qiagen cat#217004), and the extracted total RNA was used as a template to synthesize cDNA with a miScript II RT Kit (Qiagen cat#218161). Expression of genes related to hydrolysis of lipids and TG synthesis were measured by quantitative real time-polymerase chain reaction (qRT-PCR) using EvaGreen 2× qPCR MasterMix-ROX (abm cat#MasterMix-R). Primer sequences used to measure expression of all genes assessed in this study are shown in Table 1. Enzyme activation was initiated at 95 °C for 10 min followed by 35 cycles of 95 °C for 15 s and 60 °C for 60 s. β-actin and 18S were measured as housekeeping genes for normalization.
Table 1.
The sequences of oligonucleotide primers of mouse genes for qRT-PCR.
| Gene | Forward primer 5′ to 3′ | Reverse primer 5′ to 3′ |
|---|---|---|
| 18S | AAT TTG ACT CAA CAC GGG AAA CCT CAC | CAG ACA AAT CGC TCC ACC AAC TAA GAA C |
| β-Actin | CCC GCG AGC ACA GCT TCT TTG | ACA TGC CGG AGC CGT TGT CGA C |
| AcadM | GAT CGC AAT GGG TGC TTT TGA TAG AA | AGC TGA TTG GCA ATG TCT CCA GCA AA |
| ACC2 | CCA GTC TTC CGT GCC TTT GTA C | CTC ATC CCT CGC TCT GAA CG |
| ACOX1 | GCT CAG CAG GAG AAA TGG ATG C | AAT GAA CTC TTG GGT CTT GGG G |
| ChREBP | GAA ACC TGA GGC TGT CAT CCT | CGT GGT ATT CGC GCA TCA |
| CPT1b | TTC AAC ACT ACA CGC ATC CC | GCC CTC ATA GAG CCA GAC C |
| CPT2 | GAC AGC CAG TTC AGG AAG ACA G | TAT TCT GTT TAT CCT GAG CGA GC |
| Dgat2 | CTT CCT GGT GCT AGG AGT GGC | GCT GGA TGG GAA AGT AGT CTC GG |
| GyK | TGG GTA GAA CAA GAC CCG AAG | TTC CCT CTG GTT GCT GAC AC |
| HSL | GCG CTG GAG GAG TGT TTT T | CCG CTC TCC AGT TGA ACC |
| IGF-1R | GCT TCG TTA TCC ACG ACG ATG | GAA TGG CGG ATC TTC ACG TAG |
| IRS-1 | TCC TAT CCC GAA GAG GGT CT | TGG GCA TAT AGC CAT CAT CA |
| MGLL | CAG AGA GGC CAA CCT ACT TTT C | ATG CGC CCC AAG GTC ATA TTT |
| mTOR | CTG GGT GCT GAC CGA AAT GA | TCT CTC AGA CGC TCT CCC TC |
| PGC-1α | CAT TTG ATG CAC TGA CAG ATG GA | GTC AGG CAT GGA GGA AGG AC |
| PI3K | GCC CCT CCT GAT GTT GCC | GCG AGA TAG CGT TTG AAA GCA |
| PPARα | GCC TGT CTG TCG GGA TGT | GGC TTC GTG GAT TCT CTT |
2.6. Protein Expression
Protein was extracted using a lysis buffer (Sigma cat#C3228) containing a cocktail of phosphatase (Sigma cat#4906845001) and protease inhibitors (Sigma cat#P2714–1BTL). After homogenizing the tissues, the samples were centrifuged at 16.1 relative centrifugal force (rcf) for 15 min at 4 °C. The middle layer was transferred to a prechilled tube. Protein levels of mTOR, phosphorylated protein kinase B (PKB, also known as AKT), phosphorylated insulin receptor substrate-1 (IRS-1), PGC-1α, and glycerol kinase (GyK) were measured by immunoblotting. Total 15 μg of protein was run on sodium dodecyl sulfate polyacrylamide gel electrophoresis (SDS-PAGE), and all of the separated proteins were transferred to a nitrocellulose membrane. The membrane was blocked with 5% milk for 1 h at room temperature (RT) and exposed to the primary anti-bodies overnight at 4 °C (mTOR, Cell signaling cat#2983; pAKT, Cell signaling cat#9271; pIRS-1, Santa Cruz cat#sc17196; PGC-1α, Abcam cat#ab54481; and GyK, Abcam cat#ab126599). Then, the secondary anti-bodies were exposed for 1 h at RT. Finally, chemiluminescent substrate was applied, and bands of the protein were visualized by Molecular Imager Gel DocTM XR system. Each protein expression was normalized by glyceraldehyde 3-phosphate dehydrogenase (GAPDH), β-actin, or total AKT and quantified using ImageJ software from the NIH.
2.7. Statistical Analysis
All of data were presented as mean ± standard error of the mean (SEM). Repeated measures analysis of variance (Rep. Meas. ANOVA) was used to analyze sequentially obtained data over the study period such as body weight and food intake, and models included time, group (miR-150 KO vs. WT) and group * time terms. Differences between ITT and GTT from baseline to follow-up were also analyzed using repeated measures ANOVA. In addition, area under curves (AUCs) was calculated according to the trapezoid rule, and Student’s t-test was used to compare group differences. Student’s t-test was also used to analyze data involving mRNA and protein expression. SAS®Ver.9.4 was employed as statistical software, and a p-value of b0.05 was deemed statistically significant.
3. Results
3.1. miR-150 KO Mice Exhibit Metabolic Benefits
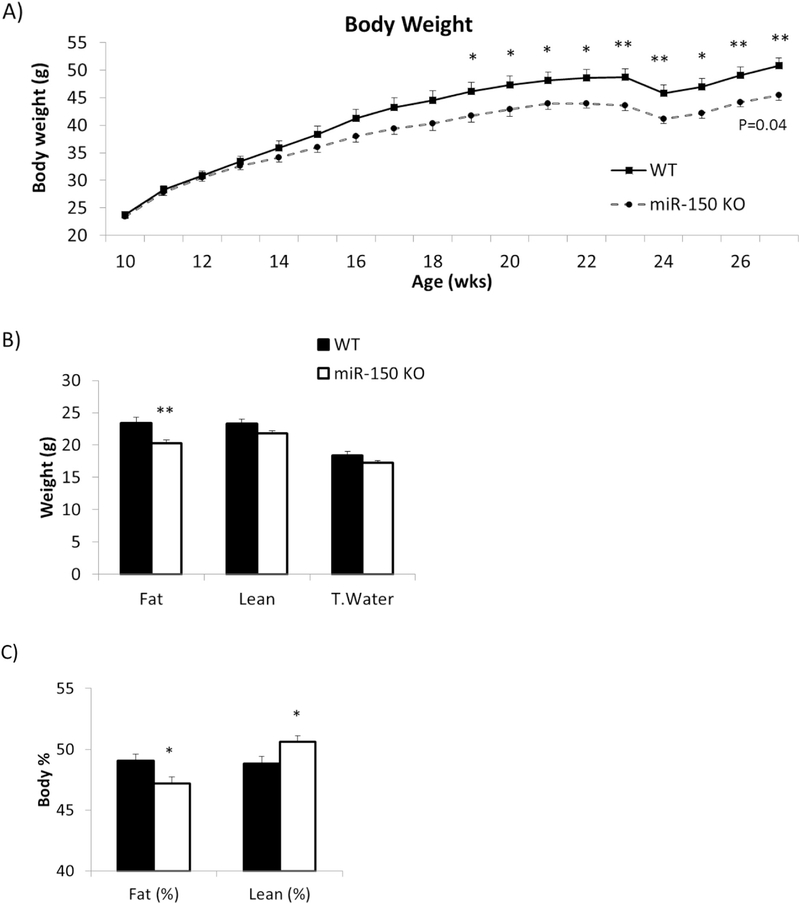
We compared metabolic phenotypes including body weight, food intake, body composition, insulin sensitivity, and glucose tolerance between WT mice and global miR-150 KO mice. There was no significant difference in body weight at 10 weeks while consuming a normal chow diet; however, after both groups of mice were placed on HFD, KO mice showed significantly lower body weights as shown in Fig. 1A (Rep. Meas. ANOVA p = 0.04). The difference at each week became statistically significant beginning at 19 weeks of age (p = 0.04), and significant differences persisted over time up to 27 weeks (p = 0.04, p = 0.04, p = 0.01, p = 0.008, p = 0.008, p = 0.01, p = 0.009, p = 0.004 respectively). Effect of time on body weight was significant while consuming the HFD (p b 0.0001), and there was also a significant interaction of group * time (p = 0.0009). When mice were fed normal chow through week 27, KO mice similarly exhibited reduced body weight compared with WT (Suppl 1A), and, thus, KO mice exhibited lower body weights regardless of diet.
Fig. 1.
KO mice are smaller with lower body fat mass. miR-150 KO mice (n = 10) and WT mice (n = 8) fed 60% HFD for 17 weeks. A) Body weights were measured weekly. B) Body composition including fat mass, lean mass and total water was measured after 12 weeks HFD. C) Body composition data were converted to relative percentage based on individual body weight. Data represents mean ± SEM, *p < 0.05, **p < 0.01.
Body composition was also assessed while on the HFD, and the absolute quantity of fat mass was significantly decreased in KO mice contributing to the reduction in overall body weight (p = 0.005, Fig. 1B). The amount of lean mass and total water also tended to be slightly lower in the KO mice but these reductions were not statistically significant compared with WT. When % lean and fat mass were considered, we observed a significant decrease in % fat mass (p = 0.02) and an increase in % lean mass (p = 0.03) in the miR-150 mice relative to WT controls (Fig. 1C).
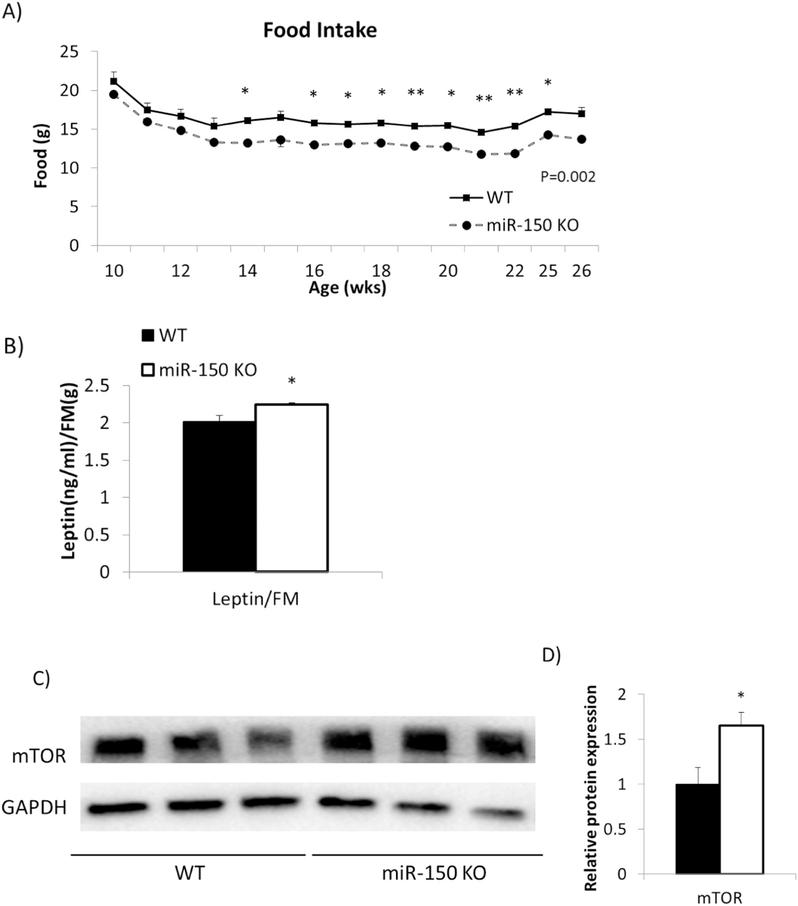
We measured food intake weekly (Fig. 2A) and found that miR-150 KO mice consumed significantly less food than WT mice on HFD (p = 0.002). The statistical difference in overall food consumption reflected significant differences at each time point including 14 weeks (p = 0.01), 16 to 22 weeks (p = 0.03, p = 0.03, p = 0.01, p = 0.0007, p = 0.04, p = 0.007, p = 0.008 respectively) and 25 weeks (p = 0.02). Differences in food consumption were also observed when the mice were fed regular chow diet (Suppl 1D); thus, KO mice consume less food than WT mice regardless of diet.
Fig. 2.
KO mice consume less food due to higher leptin level. miR-150 KO mice (n = 10) and WT mice (n = 8) fed 60% HFD for 17 weeks. A) Food intake was measured weekly. B) Circulating leptin concentration was measured after 12 weeks HFD. C) Protein levels of mTOR in EAT was measured by Western blotting. D) Western blotting results were quantified by ImageJ. GAPDH was used for normalization. Data represents mean ± SEM, *p < 0.05, **p <0.01.
We then analyzed serum leptin levels in relationship to fat mass to determine whether leptin could be involved in reduced caloric intake. We found that leptin normalized by fat mass was higher in miR-150 KO mice than WT mice (p = 0.02, Fig. 2B). To determine whether effects in adipocytes could be mediating greater leptin production, we assessed mTOR as a target of miR-150 and a known regulator of leptin expression [9,10]. Indeed, mTOR protein expression was increased by 1.6 fold in miR-150 KO mice compared to WT (p = 0.02, Fig. 2C and D).
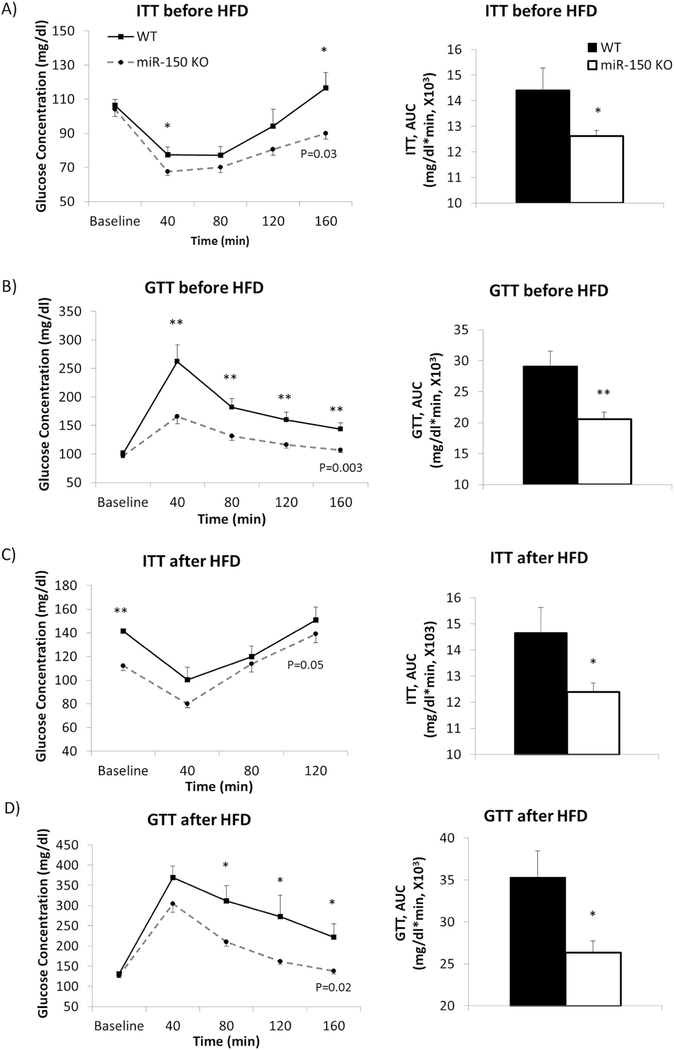
We compared insulin sensitivity and glucose tolerance between WT and KO mice before and after HFD. At 9 weeks of age on normal chow, KO mice had significantly greater insulin sensitivity by ITT when glucose values were analyzed by Rep. Meas. ANOVA (p = 0.03, Fig. 3A). Differences in blood glucose levels at individual time points were statistically lower at 40 and 160 min following insulin injection (p = 0.05, p = 0.01 respectively). KO mice also showed significantly lower AUC for glucose during ITT compared to WT (p = 0.04). The following week, GTT was performed on the same mice. KO mice had significantly better glucose tolerance compared with WT by Rep. Meas. ANOVA (p = 0.003, Fig. 3B). Glucose concentrations were significantly reduced at 40, 80, 120, 160 min following glucose injection in KO mice (p = 0.005, p = 0.005, p = 0.006, p = 0.004 respectively). Comparing AUC, KO mice exhibited significantly lower values than WT (p = 0.003).
Fig. 3.
KO mice exhibit improved insulin sensitivity and glucose tolerance. miR-150 KO mice (n = 10) and WT mice (n = 8) had insulin and glucose tolerance tests. A) ITT was performed before feeding a HFD when they were 9 weeks old. B) A week after, glucose tolerance was tested with the same mice. C) After 16 weeks HFD feeding, insulin sensitivity was tested. D) GTT was performed after 12 weeks HFD feeding. AUC during ITT and GTT was calculated and compared between groups. Data represent mean ± SEM, *p < 0.05, **p < 0.01.
The mice were then fed a HFD for an additional 12–16 weeks, and ITT and GTT procedures were again performed. KO mice showed significantly improved insulin sensitivity by Rep. Meas. ANOVA (p = 0.05, Fig. 3C). Glucose concentrations were significantly reduced at baseline in KO mice (p = 0.0001). KO mice also exhibited significantly lower AUC compared to WT (p = 0.03). In the GTT, KO mice had significantly lower glucose levels at 80, 120 and 160 min after glucose injection (p = 0.01, p = 0.05, p = 0.02 respectively, Fig. 3D) and showed significantly greater glucose tolerance in overall comparison by Rep. Meas. ANOVA (p = 0.02). AUC in KO mice was significantly smaller than WT as well (p = 0.02). Similarly, in mice maintained on normal chow throughout this period, KO mice exhibited improved insulin sensitivity and glucose tolerance compared with WT (Suppl 2A–D).
3.2. miR-150 KO Mice Exhibit Improved Insulin Signaling at Molecular Level
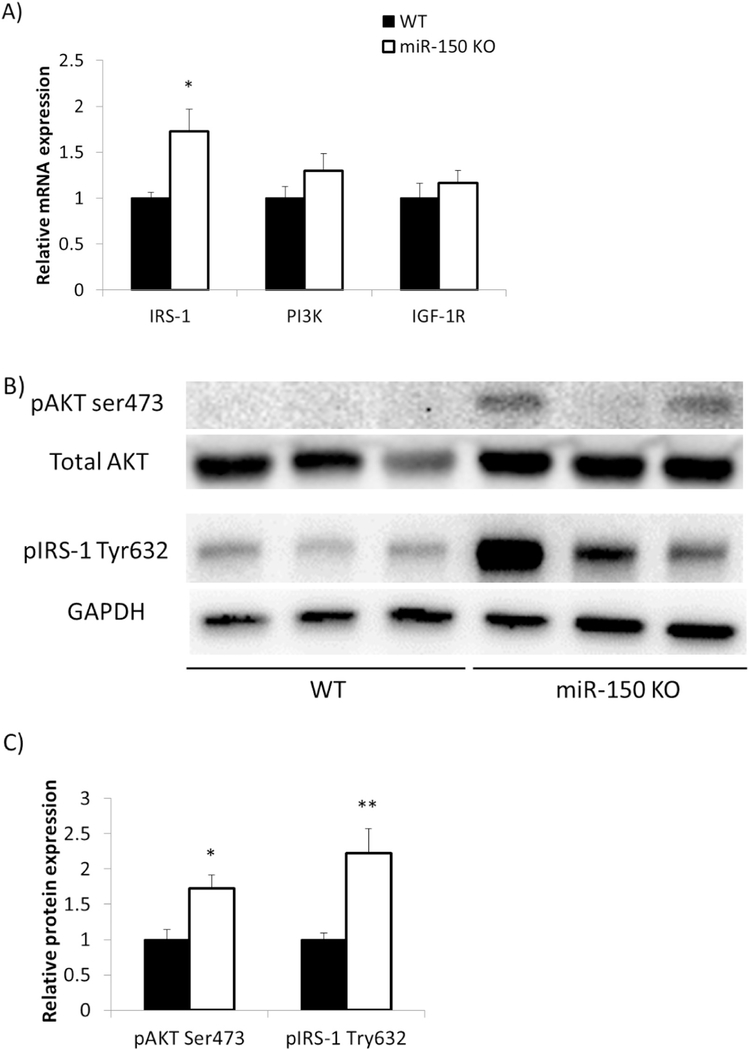
mRNAs involved in insulin signaling in epididymal adipose tissue were measured to examine molecular events underlying systemic effects on insulin sensitivity. Tissues were collected without insulin injection, therefore, the data reflect basal conditions. mRNA level encoding IRS-1, a key molecule in insulin signal transduction, was significantly increased by 1.7 fold (p = 0.02), while increments in phosphatidylinositol-4,5-bisphosphate 3-kinase (PI3K) and insulinlike growth factor 1 receptor (IGF-1R) did not achieve statistical significance (Fig. 4A). At the level of expressed proteins, we found that pAKT and pIRS-1 were both increased in KO mice (Fig. 4B); specifically, pAKT was increased 1.7 fold normalized by total AKT (p = 0.01), and pIRS-1 was increased 2.1 fold normalized by GAPDH (p = 0.005, Fig. 4C). These results suggest that systemic improvements in insulin sensitivity and glucose tolerance in KO mice are accompanied by improved insulin signaling in mouse adipose tissue.
Fig. 4.
KO miceexhibit improved insulin signaling. EATs were dissected from miR-150 KO (n = 7) and WT (n = 7) mice after 17 weeks HFD feeding. A) Gene expression involved in insulin signaling was assessed by qRT-PCR. B) Protein levels of phosphorylated AKT and IRS-1 were measured by Western blotting. C) Western blotting results were quantified by ImageJ. Total AKT and GAPDH were used for normalization respectively. Data represent mean ± SEM, *p < 0.05, **p < 0.01.
3.3. miR-150 KO Mice Have a Promoted Futile TG/FFA Cycle
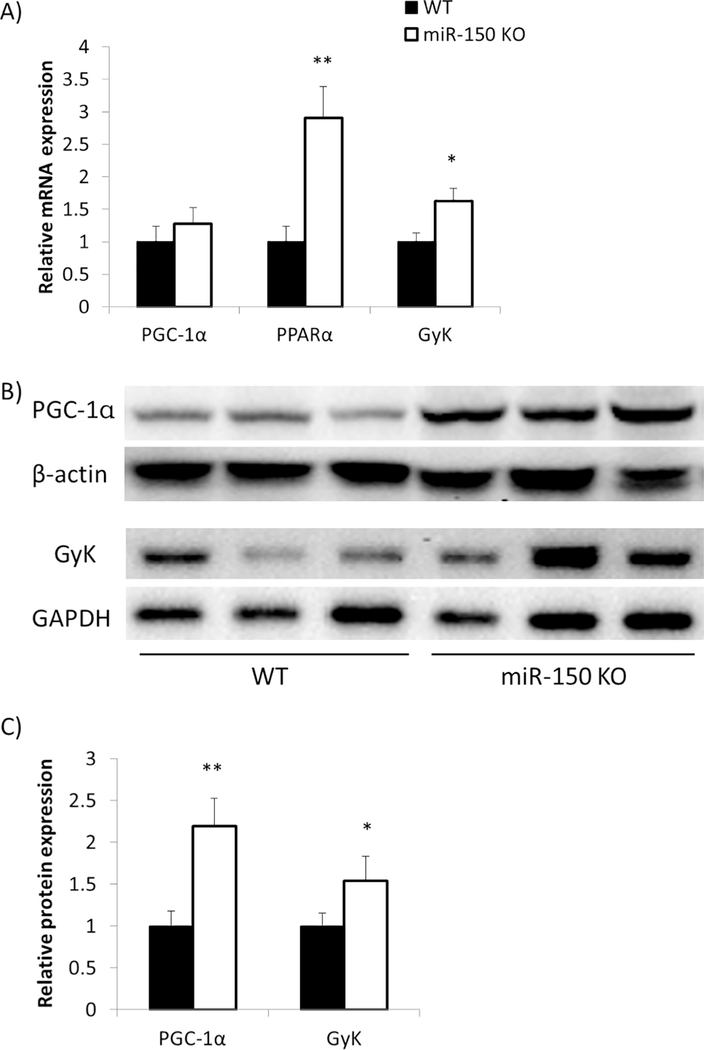
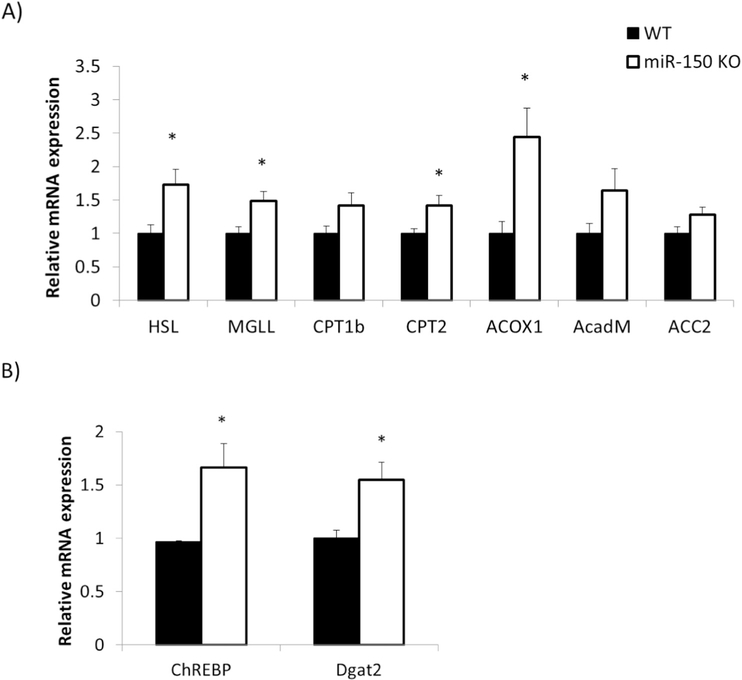
One of the targets of miR-150 is known to be PGC-1α [12]. We found that there were no significant changes in pcg-1α mRNA expression in epididymal fat between WT and KO mice (Fig. 5A). However, PGC-1α protein expression was significantly increased by 2.2 fold in KO mice (p = 0.007, Fig. 5B and C). This suggests that miR-150 suppresses PGC-1α by translational interference rather than by accelerated degradation of the encoding mRNA [14]. An important coactivator of PGC-1α is peroxisome proliferator–activated receptor α (PPARα) [15], and we found that PPARα mRNA expression was also significantly increased in adipose tissue by 2.9 fold in KO mice (p = 0.005, Fig. 5A). PPARα is a key transcription factor in promoting fatty acid betaoxidation [16]. To pursue this idea, we assessed mRNA expression involved in beta-oxidation including peroxisomal acyl-coenzyme A oxidase 1 (ACOX1), acyl-coenzyme A dehydrogenase for mediumchain fatty acids (AcadM), and acetyl-CoA carboxylase2 (ACC2), as well as mRNAs associated with TG degradation such as hormonesensitive lipase (HSL) and monoacylglycerol lipase (MGLL), and mRNAs that transport FFA into mitochondria such as carnitine palmitoyltransferase1 (CPT1) and CPT2 (Fig. 6A). We found that mRNAs encoding HSL, MGLL, CPT2, and ACOX1 were significantly augmented in KO versus WT mice (p = 0.02, p = 0.01, p = 0.03, p = 0.01 respectively), and CPT1b, AcadM, and ACC2 exhibited increased trends that did not reach statistical significance.
Fig. 5.
PGC-1α, PPARα and GyK expression increases in KO mice. EATs were dissected from miR-150 KO (n = 7) and WT (n = 7) mice after 17 weeks HFD feeding. A) PGC-1α, PPARα and GyK gene expression was assessed by qRT-PCR. B) Protein levels of PGC-1α and GyK were measured by Western blotting. C) Western blotting results were quantified by ImageJ. PGC-1α and GyK expression were normalized by β-actin and GAPDH respectively. Data represent mean ± SEM, *p < 0.05, **p < 0.01.
Fig. 6.
mRNAs involved in TG hydrolysis, beta-oxidation and TG synthesis increase in KO mice. EATs were dissected from miR-150 KO (n = 10) and WT (n = 8) mice after 17 weeks HFD feeding. A) Gene expression associated with TG hydrolysis and beta-oxidation was assessed by qRT-PCR. B) Gene expression associated with TG synthesis was measured by qRT-PCR. Data represent mean ± SEM, *p < 0.05.
Another target of PPARα is GyK, an enzyme required for TG synthesis [13]. The mRNA of GyK increased significantly by 1.6 fold (p = 0.03, Fig. 5A), and protein expression was also significantly increased by 1.5 fold (p = 0.03, Fig. 5B and C). Expression of additional mRNAs related to TG synthesis were similarly increased in miR-150 KO mice including carbohydrate-responsive element-binding protein (ChREBP) and diglyceride acyltransferase2 (Dgat2) (p = 0.05, p = 0.01 respectively, Fig. 6B). Overall, a part of important mRNAs and proteins involved in both TG degradation and synthesis was increased simultaneously in KO mice. These results suggest that adipocytes were programmed for augmented rates of both TG degradation and synthesis in KO mice, consistent with a futile cycle [13].
4. Discussion
Global miR-150 KO mice exhibited lower body weight and reduced food consumption than observed in WT mice. The difference in body weight was due to a decrease in % fat mass while the % lean mass was somewhat increased in KO mice. Protein expression of mTOR, a target of miR-150, was increased in adipose tissue of miR-150 KO mice, and mTOR is known to induce leptin expression [9,10]. Consequently, higher circulating leptin concentrations were observed in miR-150 KO mice, which can explain reduced food intake. miR-150 KO mice exhibited improved whole-body insulin sensitivity and glucose tolerance, and the phenotypes were accompanied by significant increments in expression of insulin signaling molecules (pIRS-1 and pAKT) at both mRNA and protein levels in epididymal fat. miR-150 KO mice also showed increased protein expression of PGC-1α, another known target of miR-150, which was accompanied by a predicted increase in the PGC-1α-coactivator gene PPARα. Upregulation of PPARα prompted increased transcription of mRNAs involved in both fatty acid betaoxidation and GyK, required for TG synthesis. Thus, we found that key genes involved in TG hydrolysis, beta-oxidation, and TG synthesis were all concomitantly increased in adipose tissue from miR-150 KO mice.
In our study of miR-150 KO mice, we focused on molecular events occurring in adipose tissue in the context of the changes in body composition and in vivo metabolism. Previous studies found that miR-150 represses mTOR expression in conjunction with miR-99a [9], and that increased mTOR increases leptin production and improves systemic metabolism [10]. In our in vivo model, we observed that miR-150 KO led to increased mTOR, which can explain the increase in serum leptin, lower food consumption, and reduced body weight of KO compared with WT mice.
In addition, an increase in PGC-1α, another target mRNA of miR-150, promoted an energy-consuming futile cycle via co-activation of PPARα together with genes mediating both TG synthesis and hydrolysis [13]. PPARα induces multiple genes mediating beta-oxidation as well as GyK, which enzymatically produces glycerol-3-phosphate from glycerol and ATP as a required step in TG synthesis [17]. miR-150 KO mice were found to exhibit higher protein expression of PGC-1α, and this resulted in upregulation of PPARα and GyK in adipose tissue. The phenotype of miR-150 KO mice in part represents the net effects of this futile cycle. The coupling of TG degradation and synthesis is an energy-consuming process and promotes increased FA oxidation [18]. This predictably would reduce body fat without loss of muscle mass as was observed. The re-synthesis of TG from FFA and glycerol limits export of FFA to the circulation [19], and a lower concentration of circulating FFAs is well known to enhance insulin sensitivity [20]. In fact, this has been demonstrated by Guan and colleagues who found that increased GyK expression in adipocytes reduced FFA release accompanied by an increase in insulin sensitivity [21]. These observations are consistent with our current data showing that miR-150 KO mice display enhanced insulin sensitivity and glucose tolerance.
An interesting question for future research is whether the futile cycle of TG hydrolysis and synthesis in adipose tissue is sufficient to impact total body metabolism and energy balance. Organs such as liver and skeletal muscle are much greater contributors to energy expenditure in comparison to adipose tissue [22]. However, the futile cycle could impact thermogenesis in relationship to browning of adipose tissue [23]. A previous study found that adipocytes under β-adrenergic stimulation exhibit simultaneous breakdown and synthesis of TG in adipocytes with remodeling of lipid droplets from a unilocular to multilocular morphology [24]. In addition, GyK and PGC-1α are transcriptional factors involved in browning process [24,25]. Therefore, activation and recruitment of brown adipose tissue (BAT) by a promoted futile cycle and increased GyK and PGC-1α expression could be another possible mechanism to explain metabolic benefits in miR-150 KO mice. In a previous study, Chou and colleagues found that metabolic benefits and reduced body weight in KSRP KO mice were due to upregulation of brown-fat specific genes in adipose tissue, and this was dependent upon a reduction in miR-150 as a consequence of deleting the RNA binding protein, KSRP, and upregulation of PGC-1α [12]. Activation and recruitment of BAT is considered as a possible therapeutic target for obese individuals [26–28], therefore, the roles of miR-150 in activation of BAT and browning of white adipose tissue could be an interesting future research target. Regarding other limitations, we have not addressed molecular effects of total body miR-150 deletion in tissues other than adipose, and have not assessed the contributions of effects in organs such as liver and muscle to systemic metabolism. In a recent research, Zhuge et al. found that miR-150 KO mice have improved hepatosteatosis and insulin resistance in nonalcoholic fatty liver disease [29]. Finally, our study may not directly reflect the role of miR-150 in human metabolism.
Thomou et al. demonstrated that circulating miR-containing exosomes can substantially impact adipose tissue biology together with systemic metabolism [30]. miRNAs can act locally within tissues and cells to regulate mRNA expression, and, more recently, miRNAs have been shown to exist in the circulation protected from degradation in exosomes or by adherence to circulating proteins [31,32]. Levels of miRNAs in blood can fluctuate as a function of diseases such as diabetes and obesity [33,34]. Circulating miRNAs can be targeted for uptake by specific cell types and alter gene expression in the host cell [30], thus constituting a mechanism for inter-tissue communication. Therefore, miRNAs can potentially serve as biomarkers, or even as therapeutic agents for intravenous administration, regarding certain diseases [35,36]. The current study demonstrates the ability of miR-150 deletion to affect systemic metabolism as a consequence of molecular events in adipose tissue. In addition, miR-150 exists in circulation as a relatively stable form in microvesicles [31]. Therefore, miR-150 may be considered as a future therapeutic target or biomarker relevant to cardiometabolic disease and obesity.
In conclusion, we demonstrated that miR-150 deletion in mice reduces body weight with less food consumption and improves insulin sensitivity and glucose tolerance. These effects on systemic metabolism are accompanied by upregulation of the miR-150 target mRNAs, mTOR and PGC-1α, in adipose tissue. This molecular program induces leptin production and increases gene expression involved in both TG hydrolysis and synthesis. Thus, these molecular effects in adipocytes explain reduced food consumption via the increase in leptin levels, and promote an energy-consuming futile cycle that contributes to reduced adipose tissue mass and enhanced insulin sensitivity as a result of lower circulating FFA. Our findings in the current study help to understand the ability of miR-150 to affect systemic metabolism through molecular action in adipose tissue, and point to miR-150 as a potential therapeutic target in metabolic disease.
Supplementary Material
Acknowledgments
Funding
This work was supported by the National Institutes of Health (R01 DK038765), and the Merit Review program of the Department of Veterans Affairs, as well as the UAB Diabetes Research Center (P30 DK079626).
Footnotes
Appendix A. Supplementary Data
Supplementary data to this article can be found online at https://doi.org/10.1016/j.metabol.2017.12.018.
References
- [1].Flegal KM, et al. Trends in obesity among adults in the United States, 2005 to 2014. JAMA 2016;315(21):2284–91. [DOI] [PMC free article] [PubMed] [Google Scholar]
- [2].Blomain ES, et al. Mechanisms of weight regain following weight loss. ISRN Obes 2013;2013:210524. [DOI] [PMC free article] [PubMed] [Google Scholar]
- [3].Peng Y, et al. MicroRNAs: emerging roles in adipogenesis and obesity. Cell Signal 2014;26(9):1888–96. [DOI] [PubMed] [Google Scholar]
- [4].Kadamkode V, Banerjee G. Micro RNA: an epigenetic regulator of type 2 diabetes. MicroRNA 2014;3(2):86–97. [DOI] [PubMed] [Google Scholar]
- [5].Yang Z, Cappello T, Wang L. Emerging role of microRNAs in lipid metabolism. Acta Pharm Sin B 2015;5(2):145–50. [DOI] [PMC free article] [PubMed] [Google Scholar]
- [6].Fu X, et al. MicroRNA-26a regulates insulin sensitivity and metabolism of glucose and lipids. J Clin Invest 2015;125(6):2497–509. [DOI] [PMC free article] [PubMed] [Google Scholar]
- [7].Flowers E, Froelicher ES, Aouizerat BE. MicroRNA regulation of lipid metabolism. Metabolism 2013;62(1):12–20. [DOI] [PMC free article] [PubMed] [Google Scholar]
- [8].Luo N, et al. MicroRNA-150 regulates lipid metabolism and inflammatory response. J Metab Syndr 2013;2(2). [Google Scholar]
- [9].Warth SC, et al. Induced miR-99a expression represses Mtor cooperatively with miR-150 to promote regulatory T-cell differentiation. EMBO J 2015;34(9):1195–213. [DOI] [PMC free article] [PubMed] [Google Scholar]
- [10].Roh C, et al. Nutrient-sensing mTOR-mediated pathway regulates leptin production in isolated rat adipocytes. Am J Physiol Endocrinol Metab 2003;284(2):E322–0. [DOI] [PubMed] [Google Scholar]
- [11].Sainz N, et al. Leptin resistance and diet-induced obesity: central and peripheral actions of leptin. Metabolism 2015;64(1):35–46. [DOI] [PubMed] [Google Scholar]
- [12].Chou CF, et al. KSRP ablation enhances brown fat gene program in white adipose tissue through reduced miR-150 expression. Diabetes 2014;63(9):2949–61. [DOI] [PMC free article] [PubMed] [Google Scholar]
- [13].Mazzucotelli A, et al. The transcriptional coactivator peroxisome proliferator activated receptor (PPAR)gamma coactivator-1 alpha and the nuclear receptor PPAR alpha control the expression of glycerol kinase and metabolism genes independently of PPAR gamma activation in human white adipocytes. Diabetes 2007;56(10): 2467–75. [DOI] [PubMed] [Google Scholar]
- [14].Liu Z, et al. MicroRNA-150 protects the heart from injury by inhibiting monocyte accumulation in a mouse model of acute myocardial infarction. Circ Cardiovasc Genet 2015;8(1):11–20. [DOI] [PubMed] [Google Scholar]
- [15].Vega RB, Huss JM, Kelly DP. The coactivator PGC-1 cooperates with peroxisome proliferator-activated receptor alpha in transcriptional control of nuclear genes encoding mitochondrial fatty acid oxidation enzymes. Mol Cell Biol 2000;20(5): 1868–76. [DOI] [PMC free article] [PubMed] [Google Scholar]
- [16].Honda K, et al. Role of peroxisome proliferator-activated receptor alpha in the expression of hepatic fatty acid oxidation-related genes in chickens. Anim Sci J 2016;87(1):61–6. [DOI] [PubMed] [Google Scholar]
- [17].Kiskinis E, et al. RIP140 represses the “brown-in-white” adipocyte program including a futile cycle of triacylglycerol breakdown and synthesis. Mol Endocrinol 2014; 28(3):344–56. [DOI] [PMC free article] [PubMed] [Google Scholar]
- [18].Nye C, et al. Reassessing triglyceride synthesis in adipose tissue. Trends Endocrinol Metab 2008;19(10):356–61. [DOI] [PubMed] [Google Scholar]
- [19].Flachs P, et al. Stimulation of mitochondrial oxidative capacity in white fat independent of UCP1: a key to lean phenotype. Biochim Biophys Acta 2013;1831(5): 986–1003. [DOI] [PubMed] [Google Scholar]
- [20].Cree-Green M, et al. Insulin resistance in type 2 diabetes youth relates to serum free fatty acids and muscle mitochondrial dysfunction. J Diabetes Complications 2017; 31(1):141–8. [DOI] [PMC free article] [PubMed] [Google Scholar]
- [21].Guan HP, et al. A futile metabolic cycle activated in adipocytes by antidiabetic agents. Nat Med 2002;8(10):1122–8. [DOI] [PubMed] [Google Scholar]
- [22].Kummitha CM, et al. Relating tissue/organ energy expenditure to metabolic fluxes in mouse and human: experimental data integrated with mathematical modeling. Physiol Rep 2014;2(9). [DOI] [PMC free article] [PubMed] [Google Scholar]
- [23].Flachs P, et al. Induction of lipogenesis in white fat during cold exposure in mice: link to lean phenotype. Int J Obes (Lond) 2017;41(3):372–80. [DOI] [PubMed] [Google Scholar]
- [24].Barneda D, et al. Dynamic changes in lipid droplet-associated proteins in the “browning” of white adipose tissues. Biochim Biophys Acta 2013;1831(5):924–33. [DOI] [PubMed] [Google Scholar]
- [25].Sun L, Trajkovski M. MiR-27 orchestrates the transcriptional regulation of brown adipogenesis. Metabolism 2014;63(2):272–82. [DOI] [PubMed] [Google Scholar]
- [26].Lee P, et al. Temperature-acclimated brown adipose tissue modulates insulin sensitivity in humans. Diabetes 2014;63(11):3686–98. [DOI] [PMC free article] [PubMed] [Google Scholar]
- [27].Ouellet V, et al. Brown adipose tissue oxidative metabolism contributes to energy expenditure during acute cold exposure in humans. J Clin Invest 2012;122(2): 545–52. [DOI] [PMC free article] [PubMed] [Google Scholar]
- [28].Ravussin Y, et al. Effect of intermittent cold exposure on brown fat activation, obesity, and energy homeostasis in mice. PLoS One 2014;9(1):e85876. [DOI] [PMC free article] [PubMed] [Google Scholar]
- [29].Zhuge B, Li G. MiR-150 deficiency ameliorated hepatosteatosis and insulin resistance in nonalcoholic fatty liver disease via targeting CASP8 and FADD-like apoptosis regulator. Biochem Biophys Res Commun 2017;494(3–4):687–92. [DOI] [PubMed] [Google Scholar]
- [30].Thomou T, et al. Adipose-derived circulating miRNAs regulate gene expression in other tissues. Nature 2017;542(7642):450–5. [DOI] [PMC free article] [PubMed] [Google Scholar]
- [31].Zhang Y, et al. Secreted monocytic miR-150 enhances targeted endothelial cell migration. Mol Cell 2010;39(1):133–44. [DOI] [PubMed] [Google Scholar]
- [32].Xu L, Yang BF, Ai J. MicroRNA transport: a new way in cell communication. J Cell Physiol 2013;228(8):1713–9. [DOI] [PubMed] [Google Scholar]
- [33].Goguet-Rubio P, et al. Existence of a strong correlation of biomarkers and miRNA in females with metabolic syndrome and obesity in a population of West Virginia. Int J Med Sci 2017;14(6):543–53. [DOI] [PMC free article] [PubMed] [Google Scholar]
- [34].Parrizas M, Novials A. Circulating microRNAs as biomarkers for metabolic disease. Best Pract Res Clin Endocrinol Metab 2016;30(5):591–601. [DOI] [PubMed] [Google Scholar]
- [35].Reyes RK, Motiwala T, Jacob ST. Regulation of glucose metabolism in hepatocarcinogenesis by microRNAs. Gene Expr 2014;16(2):85–92. [DOI] [PMC free article] [PubMed] [Google Scholar]
- [36].Cui X, et al. Change in circulating microRNA profile of obese children indicates future risk of adult diabetes. Metabolism 2017. [DOI] [PubMed] [Google Scholar]
Associated Data
This section collects any data citations, data availability statements, or supplementary materials included in this article.


