Abstract
This longitudinal study evaluates the association of glycemic control and associated cell stress with the telomere dynamics in a pediatric population with type 1 diabetes during a 7-year follow-up.
Hyperglycemia and abnormal blood glucose levels induce oxidative stress, promote the development of microvascular and macrovascular complications,1 and may increase telomere loss in patients with type 1 diabetes.2,3 All studies of adults with type 1 diabetes, except one, report a shorter telomere length associated with age, duration of type 1 diabetes, and higher glycated hemoglobin A1c (HbA1c) levels.4 To expand these data in a pediatric population at the onset of type 1 diabetes by assessing the association between telomere length and age or HbA1c level,5 we conducted a retrospective longitudinal study evaluating the association of glycemic control and associated cell stress with telomere dynamics during a 7-year follow-up.
Methods
In this study, conducted from January 1, 2010, to December 31, 2016, a total of 61 participants (15 girls and 46 boys; mean [SD] age at the first relative telomere length measurement, 13.0 [3.2] years; mean [SD] duration of disease at the first relative telomere length measurement, 3.2 [2.9] years) were recruited from a national type 1 diabetes registry comprising 997 pediatric candidates, excluding all patients with comorbidities of type 1 diabetes or additional autoimmune disorders, and matched for sex ratio, age, and disease duration with a tolerated difference of ±1 year. The National Medical Ethics Committee approved the study protocol and written informed consent was obtained from the participants or parents prior to the study. Relative telomere length was assessed by the quantitative polymerase chain reaction method using 3 × 3 replicates in 4 to 6 chronological DNA samples per patient. Cumulatively, 297 DNA samples generated more than 2600 raw data points. Relative telomere length values were calculated using the comparative cycle threshold method; only results with a replicate SD less than 15% were further analyzed. The nitrosative stress marker 8-nitroguanine and the high-sensitivity C-reactive protein were assessed in plasma samples. The Mann-Whitney test and linear regression were used to compare parameters and relative telomere length dynamics (GraphPad Prism [version 7.00]). P < .05 indicated statistical significance.
Results
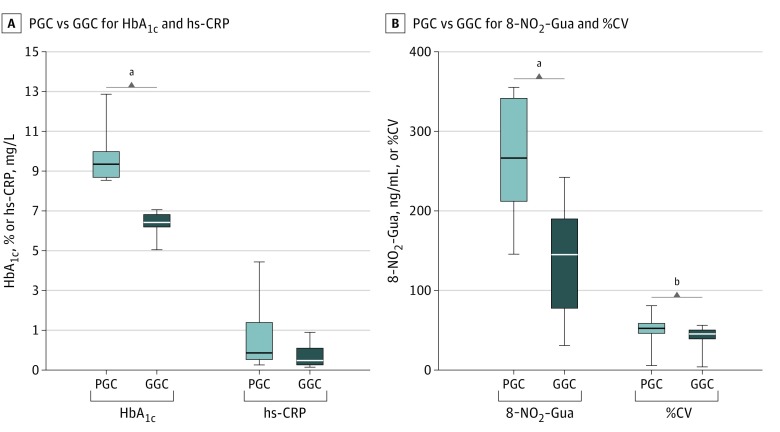
A total of 297 DNA samples from 61 patients, 23 participants with persistently poor glycemic control (PGC) and 38 with persistently good glycemic control (GGC), were assessed. Groups were matched by age, sex, duration of type 1 diabetes, age at onset of type 1 diabetes, and patient body mass index SD score but stratified by mean (SD) HbA1c level (9.83% [0.94%] for participants with PGC vs, 6.92% [0.45%] for participants with GGC [to convert to proportion of total hemoglobin, multiply by 0.01]; P < .001) and mean (SD) glucose variability (as percentage of coefficient of variation) (53.82% [10.95%] for participants with PGC vs 44.71% [7.35%] for participants with GGC; P < .001) during the investigated period (Figure 1).
Figure 1. Comparison of Biochemical Parameters Between the Poor Glycemic Control (PGC) and Good Glycemic Control (GGC) Groups of Children With Type 1 Diabetes.
Differences in glycated hemoglobin A1c level (HbA1c), glucose variability as coefficient of variation (%CV), 8-nitroguanine level (8-NO2-Gua), and high-sensitivity C-reactive protein level (hs-CRP) between the PGC and GGC groups. Analyzed groups were stratified by HbA1c. The level of nitrosative stress marker 8-NO2-Gua and %CV were significantly different between tested groups, while there was no difference in hs-CRP. The horizontal line in each box indicates the median, while the top and bottom borders of the box indicate the 75th and 25th percentiles, respectively. The whiskers above and below indicate maximum and minimum values, respectively.
aP < .001.
bP < .01.
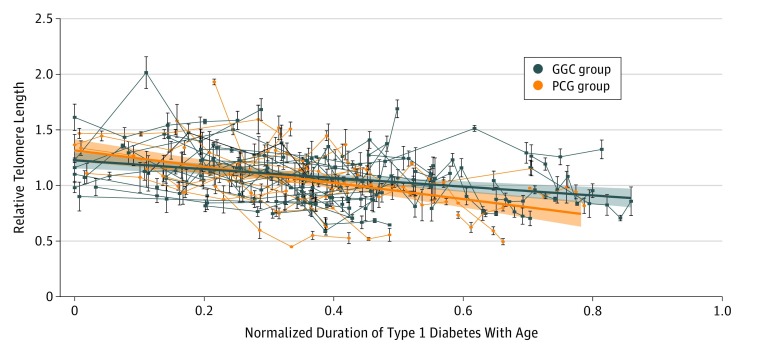
Telomere attrition was accelerated with normalized duration of type 1 diabetes with age in the PGC group compared with the GGC group (best fitted curve [SE] PGC slope, –0.73 [0.12]; best fitted curve [SE] GGC slope, –0.395 [0.083]; P = .03) (Figure 2).6 The mean (SD) level of 8-nitroguanine was significantly higher in the PGC group compared with the GGC group (271.0 [71.9] ng/mL vs 136.2 [66.5] ng/mL; P < .001), while high-sensitivity C-reactive protein levels did not differ significantly (Figure 1). There was no significant difference in relative telomere length dynamics with age or duration of type 1 diabetes between the PGC and GGC groups, although relative telomere length data slopes indicated a stronger association of duration of type 1 diabetes with telomere length attrition compared with the aging of participants (best fitted curve [SE] age slope, –0.015 [0.004]; mean [SD] duration slope, –0.031 [0.004]; P = .002).
Figure 2. Telomere Dynamics in the Poor Glycemic Control (PGC) and Good Glycemic Control (GGC) Groups of Children With Type 1 Diabetes.
The PGC group shows accelerated telomere attrition compared with the GGC group (best fitted curve [SE] PGC slope, –0.73 [0.13]; best fitted curve [SE] GGC slope, –0.395 [0.084]; P = .02). The connecting lines show telomere length dynamics in individual participants. The telomere length may temporarily increase or decrease as the result of multiple contributing factors involved in telomere dynamics, but the overall long-term trend is negative.6 Error bars indicate relative telomere length SD of the samples.
Discussion
Telomere length is variable and is associated with genetic, endocrine, and diverse environmental factors.6 Consequently, a longitudinal approach to telomere length analysis spanning a longer time period could offer a better insight into the effects of investigated factors. To our knowledge, ours is the first longitudinal study assessing telomere length dynamics in association with glycemic control in a population with type 1 diabetes.
We observed accelerated attrition of relative telomere length in the PGC group compared with the GGC group, and this accelerated attrition was associated with normalized duration of type 1 diabetes with age. In addition, a negative correlation was observed between relative telomere length and the investigated factors, with duration of type 1 diabetes having a stronger association with telomere attrition compared with patient age, corroborating results of previous cross-sectional studies.3,4 This effect was previously not observed at the onset of type 1 diabetes.5 Moreover, the 8-nitroguanine level was almost 2 times higher in the PGC group than in the GGC group, most likely indicating increased nitrosative stress associated with the poor quality of management of type 1 diabetes.
In conclusion, a higher HbA1c level and higher glycemic variability may affect nitrosative stress and telomere dynamics relatively early after the onset of type 1 diabetes. This novel finding is in concordance with reported cross-sectional data in the adult population with type 1 diabetes, where shortened telomere length and increased oxidative stress are observed. Our results further emphasize the importance of strict metabolic control in type 1 diabetes from its onset.
References
- 1.de M Bandeira S, da Fonseca LJS, da S Guedes G, Rabelo LA, Goulart MOF, Vasconcelos SML. Oxidative stress as an underlying contributor in the development of chronic complications in diabetes mellitus. Int J Mol Sci. 2013;14(2):3265-3284. [DOI] [PMC free article] [PubMed] [Google Scholar]
- 2.Uziel O, Singer JA, Danicek V, et al. Telomere dynamics in arteries and mononuclear cells of diabetic patients: effect of diabetes and of glycemic control. Exp Gerontol. 2007;42(10):971-978. [DOI] [PubMed] [Google Scholar]
- 3.Ma D, Zhu W, Hu S, Yu X, Yang Y. Association between oxidative stress and telomere length in type 1 and type 2 diabetic patients. J Endocrinol Invest. 2013;36(11):1032-1037. [DOI] [PubMed] [Google Scholar]
- 4.Januszewski AS, Sutanto SS, McLennan S, et al. Shorter telomeres in adults with type 1 diabetes correlate with diabetes duration, but only weakly with vascular function and risk factors. Diabetes Res Clin Pract. 2016;117:4-11. [DOI] [PubMed] [Google Scholar]
- 5.Tesovnik T, Kovac J, Hovnik T, Kotnik P, Battelino T, Trebusak Podkrajsek K. Association of average telomere length with body-mass index and vitamin d status in juvenile population with type 1 diabetes. Zdr Varst. 2015;54(2):74-78. [DOI] [PMC free article] [PubMed] [Google Scholar]
- 6.Svenson U, Nordfjäll K, Baird D, et al. Blood cell telomere length is a dynamic feature. PLoS One. 2011;6(6):e21485. [DOI] [PMC free article] [PubMed] [Google Scholar]


