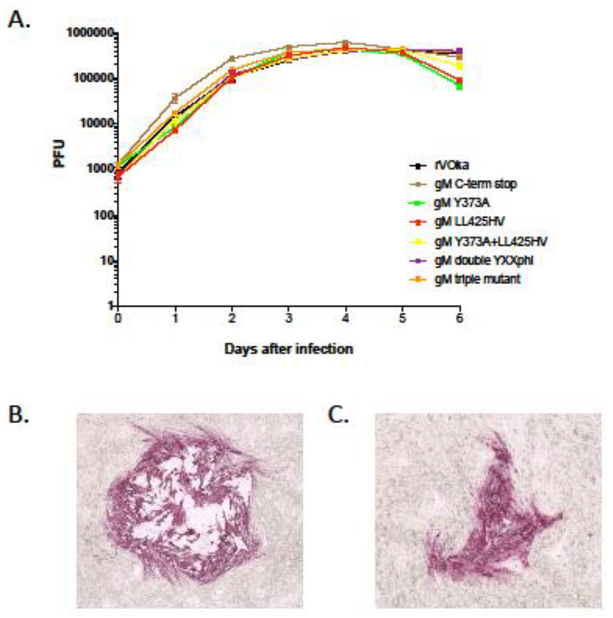
Fig. 2. Replication kinetics of VZV gM C-terminal mutants.
(A) The replication of VZV gM C-terminal mutants was evaluated by growth curve analysis in melanoma cells over a six day interval. The each data point represents the average of three replicate wells per timepoint. Error bars show standard error of mean. Color coding is as follows: rVOka (black), gM C-term stop (brown), gM Y373A (green), gM LL425HV (red), gM Y373A+LL425HV (yellow), gM double YXXΦ (purple), gM triple mutant (orange). (B) Representative plaque from rVOka-infected cells, immunostained using FastRed substrate. (C) Representative plaque from gM C-term stop-infected cells, immunostained using FastRed substrate.

