

Abstract
Summary
Myelodysplastic syndrome (MDS), a largely incurable hematological malignancy, is derived from aberrant clonal hematopoietic stem/progenitor cells (HSPCs) that persist after conventional therapies. Defining mechanisms underlying MDS HSPC maintenance is critical for developing MDS therapy. The deacetylase SIRT1 regulates stem cell proliferation, survival and self-renewal by deacetylating downstream proteins. Here, we show that SIRT1 protein levels were downregulated in MDS HSPCs. Genetic or pharmacological activation of SIRT1 inhibited MDS HSPC functions, whereas SIRT1 deficiency enhanced MDS HSPC self-renewal. Mechanistically, the inhibitory effects of SIRT1 were dependent on TET2, a safeguard against HSPC transformation. SIRT1 deacetylated TET2 at conserved lysine residues in its catalytic domain, enhancing TET2 activity. Our genome-wide analysis identified cancer-related genes regulated by the SIRT1/TET2 axis. SIRT1 activation also inhibited functions of MDS HSPCs from patients with TET2 heterozygous mutations. Altogether, our results indicate that restoring TET2 function through SIRT1 activation represents a promising means to target MDS HSPCs.
eTOC blurb:
Improved understanding of mechanisms regulating myelodysplastic syndrome (MDS) hematopoietic stem/progenitor cell (HSPC) growth and self-renewal is critical for developing MDS therapy. Li and colleagues report that SIRT1-deficiency-induced TET2 hyperacetylation promotes MDS HSPC function, and thus provide an approach to target MDS HSPCs by activating SIRT1 deacetylase.

Introduction
Myelodysplastic syndrome (MDS), a group of clonal hematopoietic disorders, is characterized by morphological dysplasia and ineffective hematopoiesis, leading to cytopenias and a 30% risk of transformation to acute myeloid leukemia (AML) (Sperling et al., 2017). MDS remains incurable by existing nontransplant therapy, which is the only option for elderly patients (Ebert, 2010). The entire MDS bone marrow is derived from a single hematopoietic stem cell (HSC) or early myeloid progenitor (Makishima et al., 2017). Human MDS HSPCs residing in the CD34+ population exhibit increased self-renewal and a growth advantage relative to normal HSCs. They can resist elimination of current therapies, and are considered a potential relapse source (Shastri et al., 2017). Thus, understanding MDS HSPC regulation is crucial for developing targeted therapies against this fatal disease.
Tet methylcytosine dioxygenase 2 (TET2) oxidizes methylated cytosine (5mC) to 5- hydroxymethylcytosine (5hmC), initiating DNA demethylation (Ko and Rao, 2011). TET2 is one of the most frequently mutated genes in MDS, suggesting a role in MDS pathogenesis. TET2 mutations are mostly heterozygous. Loss-of-function TET2 mutations, lead to DNA hypermethylation and dysregulated gene expression in HSPCs, enhancing their self-renewal and promoting aberrant myeloid-specific proliferation (Ko and Rao, 2011; Lin et al., 2014). Thus, TET2 acts as a safeguard against malignant transformation of normal HSPCs. Importantly, a major subset of MDS patient specimens with wild type (WT) TET2 also show significantly lower global 5hmC levels than do normal healthy donors (Liu et al., 2013), suggesting that WT TET2 function may be altered by post-translational regulation. Accordingly, disruption of TET2 mono- ubiquitination at lysine (K) 1299 blocks TET2 binding to chromatin, altering its catalytic activity (Nakagawa et al., 2015). However, it is unknown whether TET2 protein modification contributes to the pathogenesis of hematological malignancies.
The NAD-dependent deacetylase SIRT1 is a well-studied deacetylase that deacetylates histones and non-histone proteins like p53, FOXO, and E2F1, thereby regulating diverse activities such as cell growth, survival and stem cell self-renewal (Chalkiadaki and Guarente, 2015; Han et al., 2008). A recent study showed that SIRT1 protects normal HSCs from transplantation stress (Singh et al., 2013). Moreover, SIRT1 function in cancer is context- dependent (Brooks and Gu, 2009).
Here, we show that SIRT1 deficiency in MDS HSPCs enhances HSPC growth and self-renewal. RNAi screening and proteomics analysis revealed that SIRT1 deacetylates TET2 at conserved lysine residues in the catalytic domain (CD) and enhances TET2 activity. Genome-wide analysis identified genes regulated by the SIRT1/TET2 axis. We also evaluated potential therapeutic effects of SIRT1 agonist on MDS HSPCs in human MDS xenograft models and the NHD13 model, which resembles human MDS and meets diagnostic criteria for murine myeloid dysplasia disease(Chung et al., 2008). Finally, we observed that SIRT1 activation increased TET2 activity in cells that mimic TET2 mutant MDS cells - NHD13+ Tet2 heterozygous KO (Tet2+/−) HSPCs. These studies suggest a unique therapeutic opportunity to selectively increase TET2 activity in MDS HSPCs.
Results
SIRTI-deficient MDS HSPCs exhibit enhanced cell growth and self-renewal.
SIRT1 protein levels in CD34+CD38- primitive progenitors and CD34+CD38+ committed progenitors from both MDS (Table.S1) and normal specimens were assessed by intracellular staining with anti-SIRT1 antibody (Fig.S1A)(Greenberg et al., 1997) (Li et al., 2012). HSPCs from MDS BM specimens (n=18) showed decreased SIRT1 protein levels relative to normal counterparts (n=11) (Fig.1A, S1B left). Western blot analysis confirmed reduced SIRT1 expression in MDS CD34+ cells (Fig. 1B). The human MDS line MDS-L originated from line MDS92, which was derived from an MDS patient with del(5q) and refractory anemia with ring sideroblasts. Blast expansion was not observed over the entire clinical course, and the patient died without leukemic transformation (Matsuoka et al., 2010; Tohyama et al., 1994). Interestingly, SIRT1 protein levels were also relatively low in MDS-L cells (Fig.S1C). SIRT1 mRNA levels were comparable in MDS and normal specimens (Fig.S1B right), a finding consistent with an existing dataset (Pellagatti et al., 2010) (data not shown).
Figure 1. SIRTI-deficient MDS HSPCs exhibit enhanced cell growth and self-renewal.
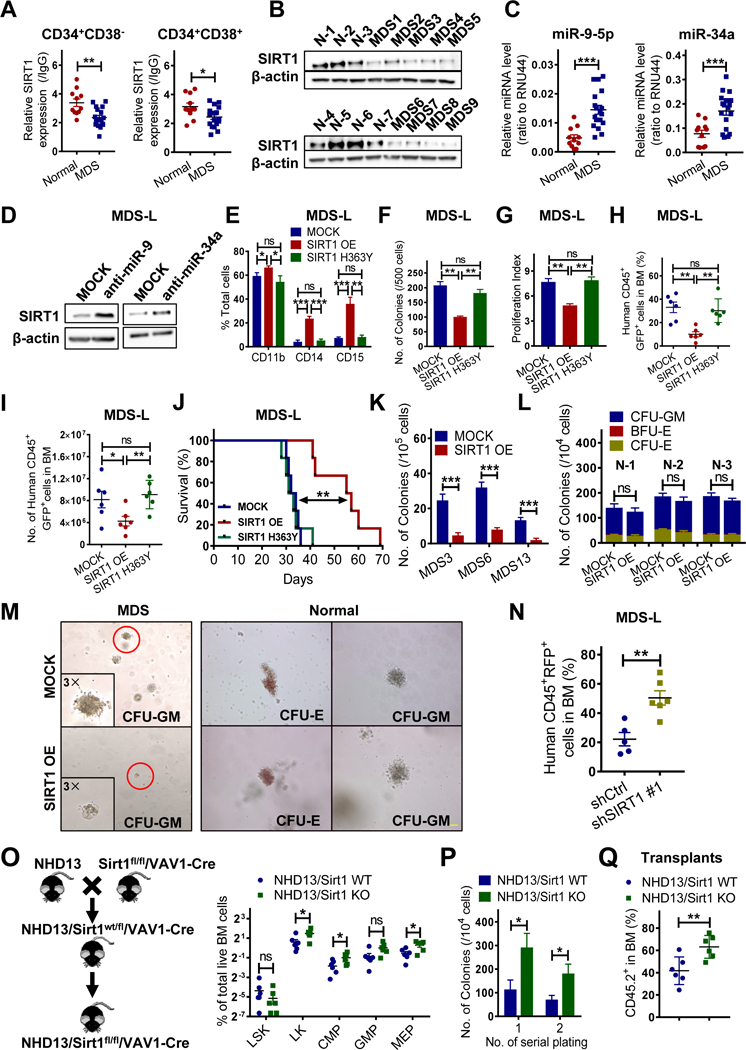
(A) SIRT1 protein expression in indicated normal (n=11) and MDS (n=18) progenitors, as analyzed by intracellular labeling. Median fluorescence intensity is expressed relative to IgG control (see Table S1 for patient information). (B) Western blot showing SIRT1 expression in MDS CD34+ (n=9) relative to normal (N) CD34+ (n=7) cells. (C) miR-9–5p and miR-34a expression in normal (n=11) and MDS (n=18) CD34+ cells. RNU44 served to normalize expression. (D) Western blotting for SIRT1 in MDS-L cells transduced with vector expressing anti-miR-9–5p, anti-miR- 34a or control (MOCK). Results are representative of 3 independent experiments. (E-G) MDS-L cells transduced with vector expressing SIRT1 WT (SIRT1 OE), SIRT1 mutant (SIRT1 H363Y) or MOCK were sorted and assessed for indicated myeloid markers at day 7 (E), for CFC (F), and Dye670-based proliferation assay at day 3 (G). (H-J) Transduced MDS-L cells were transplanted into NSGS mice. Shown is the percentage (H) and number (I) of human CD45+ GFP+ cells engrafted in BM of NSGS mice 4 weeks post-BMT among indicated groups. Survival of mice engrafted with indicated MDS-L cells (n=6 per group) (J). (K-M) CFC assay of primary MDS (n=3) (K) or normal (n=3) (L) CD34+ cells transduced with SIRT1 OE vector or MOCK. Triplicate determinations were made for each experimental point. Representative colonies are shown in (M). Scale bar, 100 μm. (N) Percentage of transduced human CD45+ RFP+ MDS-L cells in BM of NSGS recipients at 4 weeks post-BMT. (O) Shown is a breeding scheme for generating the NHD13/Sirt1 KO animals (left). Percentage of indicated HSPC populations in primary NHD13+Sirt1 KO (n=6) or NHD13+Sirt1 WT (n=6) animals at 17 weeks of age (right). (P) Serial replating of NHD13+ Sirt1 KO or NHD13+Sirt1 WT cells. (Q) Percentage of CD45.2+ donor chimerism in BM of secondary recipients (n=6 per group) receiving cells from NHD13+Sirt1 KO or NHD13+Sirt1 WT mice 16 weeks post-BMT. Significance: *p < 0.05, **p < 0.01, ***p<0.001, compared with controls. Results shown in (E-G, P) represent means ± SEM of three independent experiments. “n” represents the number of samples or animals used. (See also Figure S1 and Table S1.)
Given the differences between SIRT1 protein and transcript levels, we evaluated post- transcriptional regulation of SIRT1, first by assessing expression of miRNAs reportedly targeting SIRT1 and overexpressed in MDS, including miR-22–3p, miR-155–5p, miR-29a-3p, miR-133b, miR-138b, miR-9–5p and miR-34a (Dostalova Merkerova et al., 2011; Rhyasen and Starczynowski, 2012). Among them, miR-9 and miR-34a levels were significantly higher in CD34+ cells from MDS relative to normal counterparts (Fig.1C). miR-9 or miR-34a expression was inversely correlated with SIRT1 protein but not mRNA levels (Fig.S1D-S1E). Inhibition of miR-9 and miR-34a separately increased SIRT1 protein expression in MDS-L cells with minimal effects on mRNA levels (Fig. 1D, S1F-S1G). Moreover, luciferase reporter assays confirmed specific interaction of both miRs and the SIRT1–3’UTR (Fig.S1H). These studies suggest that miR-9 and miR-34a downregulate SIRT1 in MDS cells.
Relevant to gain-of-function, we overexpressed SIRT1 in MDS-L cells. Overexpression (OE) of WT SIRT1 but not its catalytically-defective H363Y mutant promoted modest apoptosis (Fig.S1I- S1J), increased expression of mature markers, suppressed CFC and cell proliferation (Fig.1 E- 1G), suggesting that SIRT1 inhibitory effects require deacetylase activity. Next, we transplanted transduced MDS-L cells into immunodeficient NOD-scid IL2Rgnull-3/GM/SF (NSGS) mice and found that OE of WT SIRT1 but not the H363Y mutant reduced MDS-L cell engraftment in BM, spleen (SP), and peripheral blood (PB) (Fig. 1H-1I, Fig.S1K-S1L) and significantly delayed mortality (Fig. 1J). Similarly, SIRT1 catalytic activation by SRT1720, a small molecule SIRT1 agonist (Hubbard et al., 2013), decreased MDS-L cell proliferation and viability (Fig.S1M-S1N), SIRT1-dependently (Fig.S1N). OE of WT SIRT1 significantly reduced CFC of MDS relative to Mock, an effect not seen in normal CD34+ cells (Fig.1K-1M, S1O). MDS CD34+ cells formed smaller and fewer colonies (Fig.1M), indicating overall that SIRT1 deacetylase inhibits MDS cell growth.
By contrast, shRNA-mediated SIRT1 deficiency in MDS-L cells decreased CD11b expression (Fig.S1Q) and increased the number of cells at S/G2/M phases (Fig.S1R). Although there were no differences of CFC between SIRT1 knockdown (KD) and control cells at the first plating, colony numbers of KD cells exceeded those of controls at the second and third replatings (Fig.S1S). Importantly, SIRT1 KD significantly enhanced MDS-L cell engraftment in NSGS mice (Fig.1 N, S1T). We then asked whether SIRT1 deletion promoted MDS maintenance using NHD13/Sirt1 KO animals (NHD13+Sirt1flox/floxVav1-Cre) generated through mating a conditional Sirtl KO mouse to a NHD13 mouse (Fig.S1U). By 17 weeks of age, those mice (n=6) showed significantly lower WBC and PLT counts than did NHD13/Sirt1 WT mice (Fig.S1V). Like NHD13/Sirt1 WT animals, Sirt1 KO mice exhibited normocellular and dysplastic BMs (Fig.S1W). We also observed elevated frequencies of LKs (Lin-Sca1-Kit+), CMPs, and MEPs (Fig.1O, S1X), and a decrease in Ter119+ erythroid cells and B220+ lymphoid cells in Sirt1 KO animals (Fig.S1Y). CFC and replating capacity were also increased in Sirt1 KO cells (Fig. 1P). Moreover, compared to NHD13/Sirt1 WT transplants, recipients transplanted with NHD13/Sirt1 KO cells showed significantly lower WBC, PLT and RBC counts by week 16 post-BMT (Fig.S1Z). Importantly, Sirt1 KO significantly increased CD45.2+ NHD13+ chimerism in BM (Fig.1Q).
SIRT1 deacetylates TET2 in MDS cells.
We next asked whether deacetylation of specific proteins by SIRT1 was required to inhibit MDS- L growth upon SRT1720 treatment, and if so, suppression of particular substrates would block SIRT1-dependent inhibitory effects on MDS-L We immunoprecipitated (IP’d) acetylated lysine proteins from SIRT1 KD or control MDS-L cells using anti-acetylated lysine antibody and identified proteins containing unique acetylated peptides in KD cells through mass spectrometry (MS) (Table.S2). We then chose the top 32 candidates, each with a minimum 3 acetylated peptides, for further siRNA library screening (Fig.S2A-S2B). Of the 32 proteins, EFTUD2 and SMARCC1 have been reported as acetylation targets of Sirtuin proteins (Kim et al., 2016). MDS-L cells were first transfected with siRNAs and, 36 hours later, exposed to SRT1720 for another 96 hours prior to testing for viability. Finally, we found that TET2 siRNA treatment blocked growth inhibitory effects of SRT1720 (Fig.2A). Sanger sequencing confirmed the presence of a wild type (WT) TET2 allele in MDS-L cells (data not shown) (Delhommeau et al., 2009). Moreover, in contrast to TET2 intact MDS-L cells, TET2-deficient MDS-L (MDS-L- TET2KD) were less responsive to SIRT1 OE or SRT1720 treatment (Fig.2B & S2C-S2D). For example, upon SRT1720 treatment, MDS-L-TET2KD showed more CFC than TET2 intact cells (Fig.2B).
Figure 2. SIRT1 deacetylates TET2 in MDS cells.

(A) Viability of SRT1720 (2.5 µM) treated MDS-L cells transfected with indicated siRNAs. Results were normalized to untreated MDS-L cells transfected with the corresponding siRNA. (B) CFC of SIRT1 OE or MOCK transduced MDS-L cells with/without endogenous TET2 KD. (C) Flag-tagged TET2 or HA-tagged SIRT1 was overexpressed in MDS-L cells, and lysates IP’d for Flag (upper) or HA (bottom), followed by western blotting to assess SIRT1/TET2 interaction. Results are representative of 3 independent experiments. (D) Representative images of Duolink in situ PLA in primary MDS CD34+CD38- cells. Top row, red fluorescent spots indicate SIRT1/TET2 protein interactions (left), DAPI- stained nuclei appear in blue (middle), and the merged image is at right; scale bar, 5 μm. Bottom row, IgG controls. (E) Flag-tagged TET2 fragments (upper) and HA-tagged SIRT1 were co-expressed in 293T cells. Indicated TET2 protein fragments were pulled down with anti-Flag antibody followed by western blotting for HA and Flag. (F-H) Endogenous TET2 protein from MDS-L cells was IP’d followed by western blotting for acetylated lysine (Ac-K) and TET2. Shown are TET2 acetylation levels in MDS-L cells transduced with SIRT1 OE or MOCK (F), MDS-L treated with SRT1720 or vehicle (DMSO) (G), and MDS-L treated with EX527, MS275, or vehicle (DMSO) (H). H3K27ac) served as a positive control for MS275 treatment. (I) Endogenous TET2 was IP’d in primary MDS or normal MNCs, and acetylation levels were evaluated using anti-Ac-K antibody. Significance: *p < 0.05, **p < 0.01, ***p<0.001, compared with controls. Results shown in (B) represent mean ± SEM of three independent experiments. (See also Figure S2 and Tables S2.)
We then validated SIRT1/TET2 interaction by performing co-immunoprecipitation (co-IP) in MDS-L expressing Flag-tagged TET2 or HA-tagged SIRT1 (Fig.2C). We employed proximity ligation assay (PLA) to confirm in situ SIRT1/TET2 interaction in primary MDS CD34+CD38- cells (Fig.2D). Moreover, domain-mapping analysis showed that SIRT1 preferentially interacts with the TET2 C-terminal catalytic domain (CD; 1129aa-2002aa) (Fig. 2E).
Moreover, SIRT1 overexpression or SRT1720 treatment decreased TET2 acetylation (Fig.2F- 2G), while SIRT1 inhibition by shRNA or inhibitor EX527 markedly increased TET2 acetylation without altering total TET2 protein levels (Fig.2H, S2E-S2F). A previous study reported that HDAC1,2 deacetylates TET2 at its N-terminal lysine (K) (Zhang et al., 2017); however, we observed that treatment of MDS-L cells with the class I HDAC inhibitor MS275 only modestly increased TET2 acetylation levels (Fig.2H). We also assessed potential TET2 interactome in MDS-L cells through MS analysis after TET2 IP. Among the factors identified (Table.S2), we found SIRT1, but not HDAC1 or HDAC2, confirming specific regulation of TET2 by SIRT1 in MDS-L cells (Fig.S2G). In primary specimens, TET2 protein was hyperacetylated in MDS cells (n=3) in a manner inversely correlated with SIRT1 expression, while minimal TET2 acetylation was seen in normal cells (n=3) (Fig.2I).
SIRT1 activation suppresses MDS cell growth in a TET2 deacetylation-dependent manner.
To identify TET2 acetylation sites, endogenous TET2 was IP’d from MDS-L cells and subjected precipitates to proteomic analysis. Conserved acetylated lysine (K) residues (K1468, K1472, K1473 and K1478) were identified (Fig.3A, S3A-S3F, Table.S3). TET2 sequence coverage was above 20%. As expected, ectopic SIRT1 expression in MDS-L cells reduced acetylation of all four residues (Fig.S3A-S3F). Moreover, the same four acetylated residues were also identified through MS analysis of exogenous TET2 in 293T cells overexpressing the acetyltransferase CBP (Fig.S3G). In the presence of SIRT1, acetylation of these four residues decreased relative to controls (Fig.S3H). Since these acetylated residues are predicted to be located on the exterior surface of the TET2 catalytic-domain (CD) (Hu et al., 2013), we hypothesize their deacetylation alter TET2 catalytic activity. To assess such regulation, we established a series of TET2 acetylation-deficient mutants (KR, Lysine-to-Arginine [R]) using a Flag-tagged TET2 truncation (TET2-CD) expression vector. TET2-CD expression is sufficient for catalysis (Hu et al., 2013; Ko et al., 2013). Expression of K1472R, K1473R and K1478R (but not TET2 K1468R) each in MDS-L-TET2KD cells resulted in higher 5hmC levels than did the WT control (Fig.S3I & S3J), suggesting deacetylation of those residues enhances TET2 catalytic activity. Importantly, mutating three of the K residues (3KR, K1472R, K1473R and K1478R) abolished most of TET2- CD acetylation in MDS-L-TET2KD cells (Fig.3B, lane 1 vs lane 3). In addition, we also identified multiple lysine residues, including K67, K95, K824, K1188, K1500, K1911, as bona fide acetylation sites in 293T cells (Fig.S3K). However, KR mutation of these residues did not alter TET2 catalytic activity (Fig.S3L-S3M), and we did not analyze them further. In vitro TET2 activity assay demonstrated that acetylation-deficient TET2 protein (TET2-CD 3KR) derived from CBP- expressing 293T cells produced more 5hmC than that of WT TET2 protein (Fig.3C). We then undertook an electrophoretic mobility shift assay (EMSA) to determine whether acetylation at K1472, K1473 and K1478 altered TET2 catalysis by perturbing protein-DNA interactions. Interestingly, TET2-CD 3KR protein showed significant binding to the methylated oligo, while WT TET2 which can be acetylated showed less binding (Fig.3C-3D).
Figure 3. SIRT1 activation suppresses MDS cell growth in a TET2 deacetylation- dependent manner.
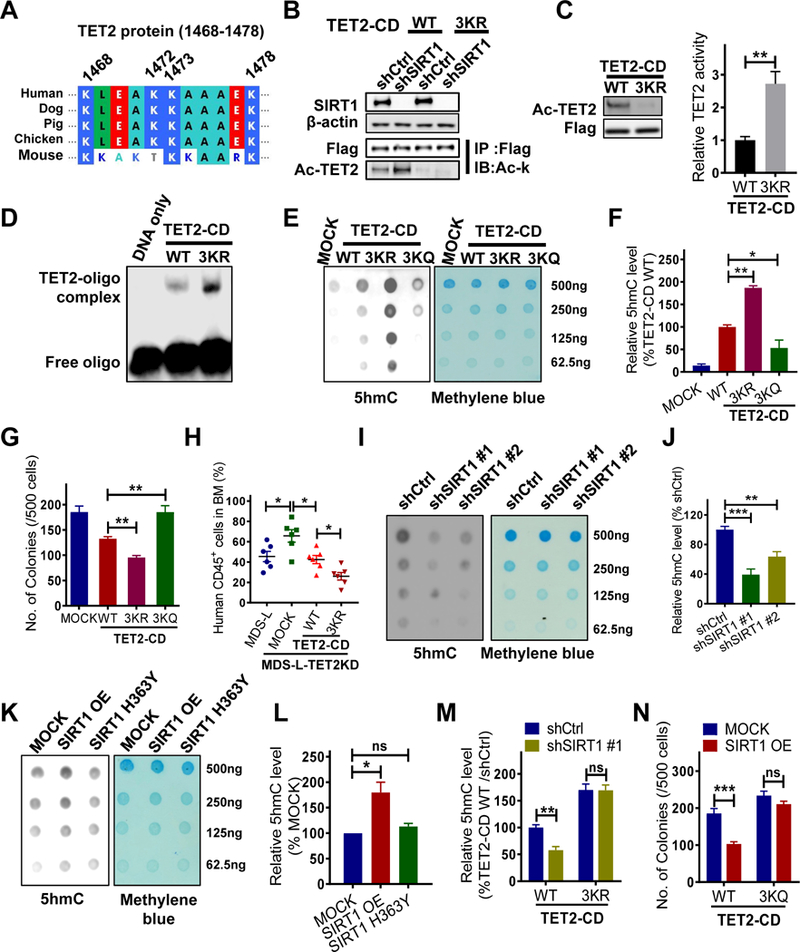
(A) Protein sequence alignment of TET2 proteins in the region encompassing human K1472, K1473 and K1478. (B) MDS-L-TET2KD cells were transduced with either WT TET2-CD or TET2-CD-3KR and then transduced with shSIRT1 or shCtrl. Flag- tagged TET2-CD proteins were IP’d followed by western blotting for Ac-K and Flag. Input is shown at the bottom. (C-D) 293T cells expressing CBP were transfected with 3KR or WT TET2- CD constructs, and then Flag-tagged TET2-CD proteins were IP’d for an in vitro TET2 activity assay (C, right) or EMSA (D). TET2-CD protein levels and acetylation levels were determined by western blotting (C, left). (E-F) 5hmC levels in MDS-L-TET2KD cells expressing indicated TET2-CD constructs were determined by dot blot (E) or ELISA (F). Methylene blue staining serves as a loading control (E right panel). (G) CFC assay of MDS-L-TET2KD cells transduced with indicated TET2-CD constructs. (H) Percentage of human CD45+ GFP+ cells in BM of NSGS mice at 4 weeks post-BMT. Mice were transplanted with MDS-L-TET2KD or MDS-L-TET2KD transduced with indicated TET2-CD constructs. (I-J) 5hmC levels in MDS-L cells transduced with shSIRT1 #1, shSIRT1 #2 or shCtrl were determined by dot blot (I) or ELISA (J). (K-L) 5hmC levels in MOCK, SIRT1 OE, or SIRT1 H363Y MDS-L cells, as determined by dot blot (K) or ELISA (L). (M) MDS-L-TET2KD cells expressing WT or 3KR TET2-CD were further transduced with shSIRT1 #1 or shCtrl. 5hmC levels were determined by ELISA. (N) Indicated MDS-L- TET2KD cells were transduced with MOCK or WT SIRT1 (SIRT1 OE) followed by a CFC assay. Significance: *p < 0.05, **p < 0.01, ***p<0.001, compared with controls. Results shown represent mean ± SEM. Triplicate determinations were made for each experimental point. Results are representative of 3 independent experiments. (See also Figure S3, Table S3.)
To assess function of TET2 acetylation in MDS, we constructed TET2 acetylation mimic (3KQ, K to Glutamine [Q], K1472Q, K1473Q and K1478Q). MDS-L-TET2KD cells were used for the functional analysis, ruling out interference from endogenous TET2. Cells transduced with TET2- CD 3KR mutant generated higher levels of 5hmC (Fig.3E-3F, S3N), in contrast, cells transduced with TET2-CD 3KQ generated less 5hmC than did TET2-CD WT. Phenotypically, expression of TET2-CD 3KQ increased CFC by MDS-L-TET2KD cells relative to TET2-CD WT, while TET2- CD 3KR decreased CFC (Fig.3G). Importantly, expression of TET2-CD 3KR significantly reduced MDS-L-TET2KD cell BM engraftment in NSGS mice (Fig.3H, S3O) relative to that of TET2-CD WT, confirming that acetylation at these three residues inhibits TET2 activity. Moreover, SIRT1 KD in parental MDS-L cells promoted TET2 acetylation (Fig.3B) and decreased TET2 activity (Fig.3I-3J). Similarly, c-Kit+ murine BM cells from Sirt1 KO mice also showed decreased TET2 activity relative to WT counterparts (Fig.S3P). Conversely, OE of WT SIRT1 or SRT1720 treatment significantly increased TET2 activity (Fig.3K-3L, Fig.S3Q).
We knocked down endogenous SIRT1 in MDS-L-TET2KD cells expressing TET2-CD 3KR or WT TET2-CD. SIRT1 KD increased TET2 acetylation and decreased 5hmC levels of TET2-CD WT cells (Fig.3B, 3M), but did not alter those of TET2-CD 3KR cells. We also overexpressed WT SIRT1 in MDS-L-TET2KD expressing TET2-CD 3KQ or TET2-CD WT. Unlike cells expressing TET2-CD WT, cells with 3KQ generated similar 5hmC levels in the presence or absence of SIRT1 OE (Fig.S3R). Phenotypically, the growth inhibitory effects seen following SIRT1 OE were abrogated by TET2-CD 3KQ expression (Fig.3N). These results indicate that TET2 deacetylation is required for growth inhibition following SIRT1 activation in MDS-L.
Identification of SIRT1/TET2 axis target genes in MDS cells.
5hmC modification reportedly promotes gene expression (Yamazaki et al., 2015). Therefore we mapped 5hmC distribution genome-wide in MOCK and SIRT1 OE MDS-L cells using 5hmC DNA IP coupled with high-throughput sequencing (hMeDIP-seq). Aggregate plots of 5hmC distribution within and surrounding all genes revealed an overall increase in 5hmC levels following SIRT1 OE (Fig.4A). Specifically, we identified 1455 differentially-hydroxymethylated peaks exhibiting markedly increased 5hmC (hyper-hydroxymethylation, hyper-5hmC) in SIRT1 OE versus MOCK cells (fold-change >3, p<0.05). Genomic location analysis revealed that 62% of 1455 hyper-hydroxymethylated peaks were within gene bodies or promoters and 6% (96 peaks) were in CpG islands (Fig.4B, S4A-S4B), while only one hypo-hydroxymethylated peak (hypo-5hmC) (fold-change <0.33, p<0.05) was identified in CpG island (Fig.S4B-S4C). As H3K27ac marks active enhancers (Rasmussen et al., 2015), we analyzed 5hmC enhancer occupancy based on an H3K27ac ChIP-seq profile of normal hematopoietic CD34+ cells (ENCODE). Aggregate plots revealed markedly increased 5hmC enrichment at enhancers following SIRT1 OE in MDS-L relative to control cells (Fig.S4D). We further calculated the percentage of 5hmC peaks that co-localized with H3K27ac peaks or with random peaks, and found the probability of hyper-5hmC peaks co-localizing with H3K27ac peaks is greater than with simulated random peaks (p=0.004) (Table.S4). The random peaks were computationally simulated through customized python scripts to match the number and size distribution of H3K27ac peaks along the genome. Interestingly, the probability of hypo-5hmC peaks colocalizing with H3K27ac peaks or random peaks is approximately the same (p=0.82). We obtained similar results following analysis of enhancer sites from other relevant cells (Fig.S4D). Our results suggest that increased 5hmC are more likely enriched in enhancers.
Figure 4. Identification of SIRT1/TET2 axis target genes in MDS cells.
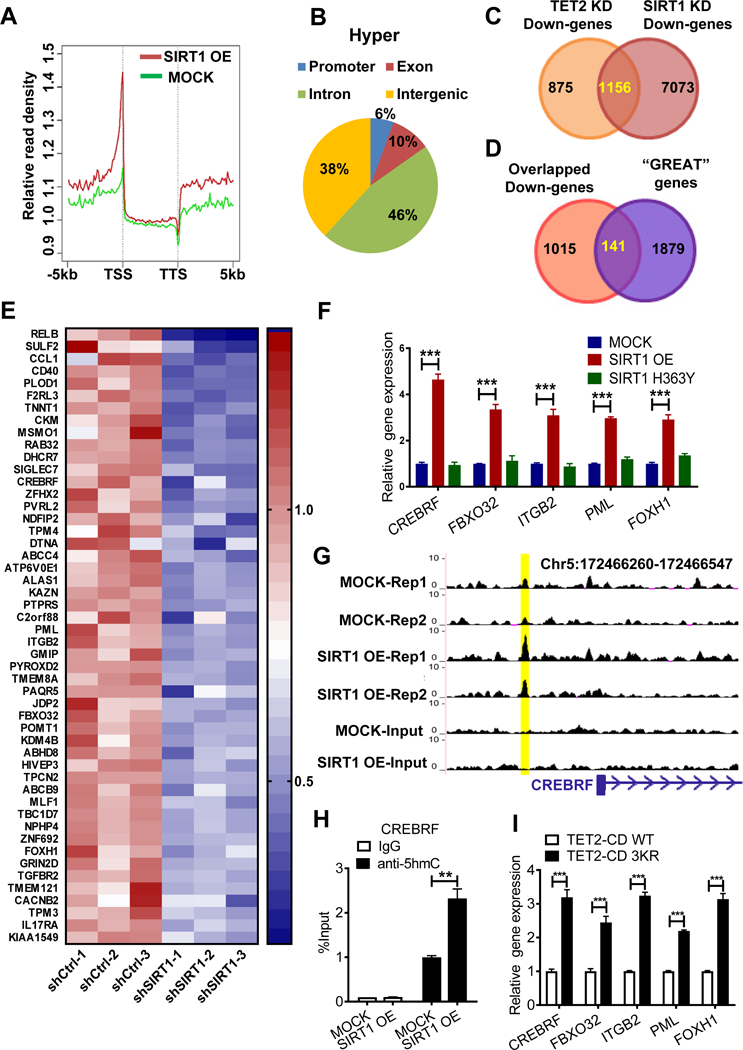
(A) A summary of relative hMeDIP-seq read densities of all genes in SIRT1 OE or MOCK MDS-L cells, displayed as peak density (normalized to Input) within gene bodies and 5kb upstream or downstream of genes. TSS: transcription start site; TTS: transcription termination site. Results are average of two independent replicates. (B) Shown are genomic locations of 1455 hyper-hydroxymethylated (Hyper) peaks (FC>3, p<0.05). (C) Venn diagram of overlapping genes commonly downregulated following SIRT1 KD or TET2 KD in MDS-L cells, based on microarray analysis. See Table S5 for a list of genes. (D) Venn diagram showing overlap of genes associated with hyper-hydroxymethylated peaks (“GREAT” genes) from GREAT analysis and common downregulated genes. See Table S5 for a list of 141 genes. (E) Heatmap shows expression of the top 50 overlapping genes from (D). (F) Target gene expression in SIRT1 OE, SIRT1 H363Y and MOCK transduced MDS-L cells. Gene expression levels were normalized to MOCK. (G) Representative UCSC tracks showing a specific hyper-hydroxymethylated peak associated with CREBRF locus. Tracks show hMeDIP-seq enrichment data from biological replicates of MOCK and SIRT1 OE MDS-L cells. (H) hMeDIP-qPCR analysis of specific 5hmC enrichment in indicated region shown in (G) using SIRT1 OE vs MOCK MDS-L cells. Bars represent mean enrichment over input. (I) Five indicated genes were validated in 3KR versus WT TET2-CD- overexpressing MDS-L-TET2KD cells. Significance: *p < 0.05, **p < 0.01, ***p<0.001, compared with controls. Results shown represent mean ± SEM. Triplicate determinations were made for each experimental point. Results are representative of 3 independent experiments. (See also Figure S4, Tables S4 and S5.)
Using Genomic Regions Enrichment of Annotations Tool (GREAT) analysis (Montagner et al., 2016), we then identified 2020 genes associated with the 1455 hyper-hydroxymethylated peaks (Table.S5). In addition, we undertook microarray analysis of global gene expression to compare SIRT1 or TET2 KD cells with controls (Fig.4C). Among differentially-expressed genes seen in either SIRT1 or TET2 KD MDS-L cells, 1156 were significantly downregulated (log2FC>- 0.35, p<0.05). Importantly, 141 of 1156 genes were associated with hyper-hydroxymethylated peaks (Fig.4C-4D, Table.S5), including genes functioning in proliferation (PML, CREBRF), adhesion (ITGB2), and TGF-β signaling (FBXO32, FOXH1) (Fig.4E). Moreover, when we determined the prognostic value of the 141 genes, we were able to divide a cohort of 176 MDS patients from an existing dataset (GSE19429) into two risk groups (p=0.0209), patients with higher gene expression scores had longer overall survival times, than those with lower scores (Fig.S4E) (Guezguez et al., 2016).
We then assessed whether the genes identified were regulated by SIRT1 activation. Expression of 40 of top 50 genes tested increased following overexpression of WT but not H363Y SIRT1 (Fig.4F, S4F). Importantly, 5hmC enrichment at genomic regions associated with upregulated genes was further validated using hMeDIP-qPCR (Fig.4G-4H, S4G). Those genes were also upregulated in SRT1720-treated cells (Fig.S4H). MDS-L-TET2KD cells expressing TET2-CD 3KR also showed increased expression of these genes relative to cells expressing TET2-CD WT (Fig.4I), confirming that genes identified are SIRT1/TET2 axis targets.
SRT1720 inhibits MDS HSPCs colony formation and their engraftment in NSGS mice.
We cultured MDS (n=11) and normal CD34+ cells (n=5) for 72 hours with SRT1720 or vehicle control and plated for CFC assays. SRT1720 treatment dose-dependently reduced the number of MDS CD34+ derived colonies (Fig.5A-5C, S5A-S5H), as did treatment with SRT2104, a different SIRT1 agonist (n=2) (Fig.S5I-S5J). Interestingly, CFC of healthy donor CD34+ cells was modestly affected by SRT1720 (Fig.5D). Mechanistically, SRT1720 treatment reduced TET2 acetylation levels (Fig.5E), enhanced TET2 catalytic activity as evidenced by increased 5hmC levels (Fig.5F, S5K-S5L). Of note, upon SRT1720 treatment, MDS specimens with monoallelic TET2 point mutations (MDS18, c.5284A>G; MDS23, c.2599T>C) showed reduced CFC and increased 5hmC levels, indicating SIRT1 activation increases remaining WT TET2 activity in MDS cells (Fig.S5G-S5H, S5K-S5L), in agreement with others (Aslanyan et al., 2014). Expression of SIRT1/TET2 target genes was also upregulated in MDS CD34+ cells after SRT1720 treatment (Fig.5G). Moreover, SRT1720 growth inhibitory effects were blocked by overexpression of TET2-CD 3KQ but not TET2-CD WT (Fig.5H). We also observed modestly reduced p53 acetylation in one (MDS22) out of two specimens harboring WT p53 following SRT1720 treatment (Fig.S5M), but treated cells did not show changes in p53 target gene expression (Fig.S5N).
Figure 5. SRT1720 inhibits MDS HSPCs colony formation and their engraftment in NSGS mice.

(A-D) MDS (n=3, A-C) (another 8 samples were shown in Fig.S5) or normal (n=5, D) CD34+ cells were cultured with indicated doses of SRT1720 or DMSO for 72 hours and then plated in methylcellulose progenitor culture medium for a CFC assay. Results in (A-C) are determined in triplicate. (E) Endogenous TET2 was IP’d in primary MDS MNCs upon SRT1720 or vehicle (DMSO), and Ac-K levels were evaluated by western blotting. (F) 5hmC levels in SRT1720-treated MDS CD34+CD38- cells (n=4) were determined by intracellular labeling using a 5hmC-specific antibody. The result of each sample was shown in Fig.S5K. (G) Expression of SIRT1/TET2 axis target genes in MDS CD34+ cells treated with SRT1720 compared with vehicle (DMSO) (n=3). Gene expression levels were normalized to vehicle group. (H) MDS-L- TET2KD cells expressing TET2-CD WT or the 3KQ construct were further treated with SRT1720 or vehicle (DMSO), followed by a CFC assay. (I) MDS CD34+ cells treated ex-vivo with SRT1720 were injected into sub-lethally irradiated NSGS mice. Human engraftment was analyzed 12 weeks post-BMT (J) Representative CD45 and CD33 expression in MDS specimen #19. (K) Percentage of human CD45+ cells in BM of NSGS mice injected with SRT1720- or vehicle-treated MDS cells. (L-M) Percentage of human CD34+CD38- cells in BM of NSGS mice injected with indicated MDS cells. Representative FACS profile is shown in (L). (N) Percentage of indicated subsets within engrafted human cells in BM of NSGS mice injected with SRT1720- or vehicle-treated MDS cells. (O) MDS-L cells were injected into sub-lethally irradiated NSGS mice. Following confirmation of engraftment at 2 weeks, mice underwent oral gavage injection of SRT1720 or vehicle for 2 more weeks (n=6 each group). Human engraftment was analyzed. (P-R) Percentage of human CD45+ cells in BM (P) and PB (Q), number of human CD45+ cells in BM (R) of NSGS mice after treatment. (S) Survival of MDS-L cells xenografted NSGS mice after administration with SRT1720 or vehicle. Significance: *p < 0.05, **p < 0.01, ***p<0.001, compared with controls. Results shown in (D and G) represent mean ± SEM of separated independent experiments. “n” represents the number of samples or animals used. (See also Figure S5, Tables S1 and S6)
We then assessed engraftment capacity of MDS CD34+ cells treated ex vivo with SRT1720 in NSGS mice (Fig.5I). All three MDS specimens, showing successful BM engraftment of >1% in NSGS recipients at 12 weeks post-transplantation, exhibited a typical myeloid bias. SRT1720 treatment reduced BM engraftment of human CD45+ cells including CD34+CD38- population by 12 weeks post-BMT (Fig.5J-5M). SRT1720 treatment also significantly increased CD11b+ and CD14+ cell fractions within BM-engrafted cells from one MDS specimen (Fig.5N). We also tracked specific genetic lesions (SF3B1-K700E, MDS19; U2AF1-S34F, MDS 20) to confirm the MDS origin of xenografted cells and found that human cells assessed before and after xenografting showed an almost identical mutational allele frequency (Fig.S5O, Table.S6). We also validated cells’ MDS origin using FISH analysis in specimen MDS19 with del(5q) (Fig.S5P- S5Q). Due to low levels of longer-term engraftment of primary MDS cells in NSGS mice (Rhyasen et al., 2014), we used a MDS-L cell xenograft model for SRT1720 treatment (Milne et al., 2007) (Fig.5O). SRT1720-treated mice showed reduced human CD45+ cell engraftment in BM and PB (Fig.5P-5R) and also displayed extended overall survival relative to control animals (p=0.0013) (Fig.5S).
SRT1720 treatment reverses dysplastic phenotypes in a murine MDS model.
We next assessed effects of SRT1720 in the NHD13 mouse model. MDS in this model is highly transferable, and secondary recipients receiving primary NHD13+ MDS cells will develop MDS in 4–6 months, allowing generation of a large cohort of mice with similar disease onset time and suitable for preclinical studies of therapeutic interventions (Chung et al., 2008). CD45.2+ BM MNCs from primary donor mice developing MDS were transplanted into sublethally-irradiated congenic recipients expressing CD45.1 (Fig.6A). 120 days post-BMT, recipients showed abnormal CBC counts (Fig.S6A) and a significant number of dysplastic cells in their normocellular BM (Fig.S6B-S6C). We observed no signs of leukemic transformation, as blast cells in BM constituted <20% (Fig.S6D) and there was no hematopoietic cell invasion of non-hematopoietic organs (such as liver, kidney, and lung) (not shown). Primary transplanted animals were then treated for 12 weeks with SRT1720 or vehicle control. SRT1720 treatment partially reversed MDS-like disease, as evidenced by increased in HGB, PLT, RBC, and WBC (Fig.6B). We did not observe apparent toxicity or weight loss following 12 weeks of SRT1720 treatment (data not shown). Numbers of dysplastic cells in BM decreased after drug treatment (Fig.6C-6D). Dysplasia was evident in SP and PB (Fig.S6E-S6F), but again we found no signs of leukemic transformation following treatment (Fig.S6G-S6H). Importantly, engraftment of CD45.2+ MDS cells was largely decreased in PB and BM after SRT1720 treatment (Fig.6E-6F). We also observed significantly reduced CD45.2+ NHD13+ chimerism in LSK and other BM progenitors (Fig.6G). Mechanistically, SRT1720 administration in vivo inhibited LSK and LK cell proliferation (Fig.6H-6I). SRT1720-treated NHD13+ mice also displayed reduced HSPCs frequency, including LKs, MEPs, and GMPs (Fig.6J-6K), and significantly increased B220+ and TER119+ cell frequency (Fig.6L), suggesting that SIRT1 activation induces differentiation. SRT1720 treatment also reduced frequency of aberrant lymphoid (Mac1+/B220+) cells (Fig.6L).
Figure 6. SRT1720 treatment reverses dysplastic phenotypes in a murine MDS model.

(A) BM cells were harvested from pooled 3 primary NHD13 mice that developed MDS. BM MNCs plus WT supporting BM cells were transplanted into sub-lethal irradiated congenic recipients expressing CD45.1. 120 days later, recipients showed abnormal CBCs were treated for 12 weeks with SRT1720 or vehicle (n=6 per group). BM and PB were analyzed. (B-D) CBC (B) and BM dysplasia percentage (C) in NHD13 primary transplants were analyzed after 12 weeks of SRT1720 or vehicle treatment. Representative picture of dysplastic BM cells stained with Wright Giemsa are shown in (D). Green arrow, dysplastic cell; red arrow, blast cell. Scale bar, 10 μm. (E-F) Percentage of CD45.2+ cells in PB (E) and BM (F) of primary transplants after 12 weeks of indicated treatment. (G) CD45.2 chimerism in LSKs and other progenitor populations in BM of primary recipients after 12 weeks of indicated treatment. (H-I) Representative FACS profiles for cell cycle analysis of LK and LSK cells in BM of NHD13 transgenic animals after 4 weeks of indicated treatment (n=6 per group). Cumulative results are shown in (I). (J-L) Percentage of indicated HSPCs (J, K) and mature (L) populations in BM of NHD13 transgenic animals after 4 weeks of indicated treatment. Representative FACS profiles for LK and LSK cells are shown in (J). (M-N) Percentage of CD45.2+ cells in PB (M) and BM (N) of secondary recipients (n=6 per group) transplanted with CD45.2+ BMNCs from SRT1720- or vehicle-treated mice. (O) Shown is a breeding scheme for generating the NHD13/Tet2 KO animals (left). Lin- BM cells from NHD13+Tet2+/−, NHD13+Tet2+/+ and NHD13+Tet2−/− mice were cultured with SRT1720 or vehicle (DMSO) for 72 hours and then plated for a CFC assay (right). Significance: *p < 0.05, **p < 0.01, ***p<0.001, compared with controls. Results shown in (O right) represent mean ± SEM of 3 independent experiments. “n” represents the number of animals used. (See also Figure S6)
To evaluate SRT1720 effects on MDS-initiating cells, we transplanted equal number of CD45.2+ BM cells from vehicle or SRT1720-treated primary transplants into secondary recipients. The latter showed significantly reduced CD45.2+ cell engraftment in PB and BM (Fig.6M-6N), and transplanted animals displayed less severe anemia, thrombocytopenia, and cytopenia, and reduced BM dysplasia (Fig.S6I-S6K), suggesting that SRT1720 ablated MDS-initiating clones.
Next, we asked whether SRT1720 activated TET2 function in NHD13+ MDS cells. SRT1720 treatment decreased TET2 acetylation in NHD13+ MDS BM MNCs (Fig.S6L). Increased 5hmC levels were also observed in Lin- NHD13+ cells after SRT1720 treatment (see later Fig.S6V). Interestingly, Sirt1 KD in NHD13+ cells decreased expression of SIRT1/TET2 target genes (Crebrf, Fbxo32, Pml, Itgb2 and Foxh1) identified from human studies, suggesting that in the murine cells these genes are regulated by SIRT1/TET2 axis (Fig.S6M). Upregulation of these five genes was further validated in SRT1720 treated murine MDS cells (Fig.S6N). Importantly, the 5hmC enrichment region associated with CREBRF is conserved between human and mouse (human Chr5: 172466260–172466547; mouse Chr17: 26705836–26705919). Expectedly, SRT1720 induced CREBRF upregulation was associated with increased 5hmC enrichment on the putative region (Fig.S6O). In addition, expression level of MTSS1, another reported murine TET2 target as well as a tumor suppressor gene (Rasmussen et al., 2015), also increased following SRT1720 treatment (Fig.S6P), correlating to increased 5hmC enrichment on its enhancer region (Chr15: 58979469–58979554) (Fig.S6Q). SRT1720 treatment did not block MDS symptoms or inhibit MDS HSPC engraftment in mice transplanted with NHD13+ Tet2 homozygous KO (NHD13+Tet2−/−) cells (Fig.S6R-S6U). Overall, these results demonstrate that in vivo administration of SRT1720 strongly blocks MDS propagation and ablates long-term maintenance of functional MDS-initiating cells through TET2 activation.
Others have shown that TET2 haploinsufficiency leads to aberrant HSC self-renewal and susceptibility to myeloid transformation (Li et al., 2011; Moran-Crusio et al., 2011). Thus, to determine whether SIRT1 activation could overcome TET2 haploinsufficiency, we evaluated the effects of SRT1720 treatment on Lin- BM cells from NHD13+Tet2+/− mouse. Similar to Tet2 WT cells (NHD13+Tet2 WT), Tet2 heterozygous KO cells (NHD13+Tet2+/−) showed decreased CFC upon SRT1720 treatment (Fig.6O). Strikingly, SRT1720 treatment significantly enhanced 5hmC levels in NHD13+Tet2+/−cells (Fig.S6V). In contrast, Tet2 homozygous KO cells (NHD13+Tet2−/−) failed to respond to SRT1720 treatment. We also transduced NHD13+Tet2+/− BM cells with TET2-CD-3KQ, TET2-CD-WT or empty vector (MOCK) (Fig.S6W). Following SRT1720 treatment, we observed significantly reduced CFC of cells expressing TET2-CD-WT (p=0.005), but TET2-CD-3KQ-expressing NHD13+Tet2+/−cells showed CFC comparable to MOCK cells, confirming that TET2-CD-3KQ protein is not functional (Fig.S6X).
Discussion
MDS is a lethal hematological disorder of particular concern to patients unsuitable for HSC transplantation. Current non-transplant therapies are ineffective to eliminate MDS HSPCs, which serve as sources of disease initiation and relapse (Shastri et al., 2017). Here, we report that SIRT1 downregulation by specific miRs promotes TET2 inactivation, allowing maintenance of MDS HSPCs. Conversely, overexpression or pharmacological activation of SIRT1 enhanced TET2 function and drastically inhibited MDS maintenance. These studies suggest that SIRT1 activation could be developed as a new therapeutic strategy to antagonize MDS HSPCs.
SIRT1, which is the most extensively studied sirtuin, plays an important role in maintaining self-renewal and differentiation of HSCs, especially under cellular stress (Singh et al., 2013). However, SIRT1 function in cancer is controversial (Chalkiadaki and Guarente, 2015). Recent studies, including our own, indicate that SIRT1 has oncogenic activity in tyrosine kinase (TK)- related leukemias in which p53 is deacetylated and inactivated (Sasca et al., 2014). Herein, we propose that it is the identity of SIRT1 targets (p53 in the case of AML, or TET2 in the case of MDS) that determines SIRT1 function and thus cell fate rather than SIRT1 activity levels (Fig.7). To test this, we inhibited Sirt1 expression in NHD13+ BM cells expressing FLT3-ITD (NHD13/FLT3-ITD) as an AML model (Greenblatt et al., 2012) and compared outcomes to similarly-treated MOCK-transduced NHD13+ cells, representing the MDS model (Fig.S7A, later S7G). Sirt1 KD significantly induced p53-dependent apoptosis and decreased CFC (Fig.S7A- S7C, later S7G), confirming that SIRT1 inhibits p53 activity and maintains AML in the context of FLT3-ITD mutation. Sirt1 KD, however, had no inhibitory effect on control NHD13+ MDS cells and markedly increased CFC (Fig.S7D-S7E). Moreover, unlike p53 activation seen in the AML model (Fig.S7F upper), Sirt1 KD in NHD13+ MDS cells only modestly increased p53 acetylation in a manner that did not alter p53 activity (Fig.S7F lower), in agreement with others that in a nonstress context, SIRT1 deficiency-induced p53 hyperacetylation has little effect on p53 activity (Cheng et al., 2003; Solomon et al., 2006). Moreover, in control MDS cells, TET2 hyperacetylation upon Sirt1 KD (Fig.S7G) decreased TET2 activity (Fig.S7H lower) and its target gene expression (Fig.S7I lower). Such TET2 hyperacetylation was confirmed to be required for increased CFC of NHD13 cells (Fig.S7J-S7K). However, in the FLT3-ITD transformed NHD13+ AML model, Sirt1 KD-induced TET2 hyperacetylation decreased TET2 activity (Fig.S7G, S7H upper) but only modestly downregulated TET2 target gene expression (Fig.S7I upper), suggesting a minor function of TET2 acetylation in FLT3-ITD+ cells. Consistently, our new findings support a minor role for the SIRT1/TET2 axis in the context of FLT3-ITD+ AML. First, we observed that FLT3-ITD OE in murine or human MDS cells markedly reduced 5hmC production, through activated SIRT1 and decreased TET2 acetylation levels (Fig.S7L-S7O). Moreover, TET2 activity was modestly lower in FLT3-ITD+ AML CD34+ cells than in normal and MDS counterparts (Fig.S7P). Mechanistically, TET2 repression is associated with transcriptional downregulation and increased protein nuclear export (Fig.S7Q-S7R). The enhanced TET2 nuclear export may be related to elevated Activation-Induced cytidine Deaminase (AID) levels seen following FLT3-ITD transformation (Fig.S7L,S7R), in agreement with others (Arioka et al., 2012). We conclude that loss of TET2 activity induced by FLT3-ITD transformation overrides any potential SIRT1 deacetylase-mediated TET2 activation effect in FLT3-ITD+ AML. Similarly, BCR-ABL expression also markedly reduced 5hmC production in transformed cord blood CD34+ cells (Fig.S7S-S7T).
Figure 7. Differential SIRT1 function in MDS versus FLT3-ITD+ AML.

MDS HSPCs express lower SIRT1 levels than normal counterparts due to a miR-9- and miR-34a-mediated translational block. Decreased SIRT1 deacetylase activity promotes TET2 hyperacetylation without altering total TET2 protein levels. TET2 acetylation decreases TET2 DNA binding capacity, reducing DNA demethylation and TET2 target gene expression, outcomes that allow self-renewal and maintenance of MDS HSPCs. Conversely, low levels of endogenous SIRT1 or experimental SIRT1 KD modestly increase p53 acetylation without changing p53 activity. In FLT3-ITD+ AML HSPCs, SIRT1 protein expression is selectively enhanced through FLT3- ITD/MYC/USP22-mediated increases in SIRT1 protein stability. Such SIRT1 overexpression is required to inhibit p53 activity by deacetylation, allowing self-renewal and maintenance of AML cells under FLT3-ITD-induced oncogenic stress. However, FLT3-ITD expression directly represses TET2 activity transcriptionally and by promoting TET2 protein nuclear export. Such negative regulation outweighs any potential SIRT1 deacetylase-mediated TET2 activation effect, resulting in enhanced maintenance of FLT3-ITD+ AML HSPCs (see also Figure S7).
Previous studies show that TET2 activity blocks aberrant stem cell expansion, indicating that TET2 acts as a tumor suppressor against transformation of normal stem cells (Li et al., 2011). Currently, it is well accepted that loss-of-function TET2 mutations compromise TET2 enzyme activity. However, several studies demonstrated that MDS patient specimens with WT TET2 also showed a reduced TET2 activity (Ko et al., 2010; Liu et al., 2013), potentially because alternative mechanisms govern WT TET2 protein function, a possibility that has sparked considerable interest. For example, mutations of isocitrate dehydrogenase 1 (IDH1) or IDH2 leads to decreased TET2 activity through production of 2-hydroxyglutarate (Ye et al., 2013). Here, we propose that hyperacetylation of the TET2 represents a novel mechanism that contributes to MDS HSPCs proliferation and self-renewal. In contrast to a recent report indicating a positive correlation between catalytic activity and N-terminal acetylation of TET2 (Zhang et al., 2017), we found that acetylation of TET2-CD is associated with lower enzymatic activity, which confers a growth advantage to MDS cells. Specifically, the lysines K1472, K1473 and K1478 are predicted to be located on the exterior surface of the TET2 (Hu et al., 2013). Mechanistically, when acetylated, these residues likely inhibit TET2/DNA interaction, and provide an explanation for inactivation of TET2 catalysis by acetylation, as DNA binding is a prerequisite for TET2 catalysis. Of note, so far no TET2 somatic mutations in K1473 and K1478, which are conserved among all species (Fig. 3A), have been recorded by COSMIC. Overall, our study indicates that, in addition to a mutation hotspot, the catalytic domain of TET2 serve as a site for negative regulation by acetylation, providing an explanation why a major subset of MDS patients without TET2 mutation also showed a reduced TET2 catalytic activity.
To date, few studies have suggested TET activation as a therapeutic approach. Two recent reports demonstrate that Vitamin C administration in vivo can activate TET2-related DNA demethylation and block leukemia progression (Agathocleous et al., 2017; Cimmino et al., 2017). But, lack of specificity and a requirement for high dosage may restrict use of Vitamin C in clinical settings. Herein, we show that SIRT1 deacetylates TET2 and enhances its activity, suggesting a unique therapeutic opportunity to selectively modulate TET2 activity in MDS HSPCs and supporting further analysis of SIRT1 as a viable target in MDS.
A common limitation to current MDS chemotherapy is specificity, as most reagents in use are toxic to normal HSCs. Our results suggest that the SIRT1 agonist SRT1720 (Milne et al., 2007), which directly interacts with and activates SIRT1 through an allosteric mechanism (Hubbard et al., 2013), has little effect on growth of normal CD34+ hematopoietic cells. We also observed no toxicity (as evident by weight loss) in mice after 12 weeks of SRT1720 treatment (data not shown). Consistently, SIRT1 activating agents including SRT1720 were reportedly safe in other animal studies (Mitchell et al., 2014; Zainabadi et al., 2017). Thus, our observations support further investigation of SRT1720 or other SIRT1-activating compounds as potential MDS antagonists. For example, SRT2104 has been tested in a Phase II trial against diabetes (Baksi et al., 2014). Its testing in MDS could be rapidly implemented in clinical trials. Moreover, we have demonstrated that SIRT1 activation can overcome TET2 haploinsufficiency effects in Tet2+/− cells. Given the vast majority of patients with TET2-mutant MDS retain a wild type copy of TET2, future work is warranted to evaluate whether SIRT1 agonist can achieve considerable therapeutic potency in a large cohort of MDS populations with TET2 mutation. In addition, the presence of FLT3-ITD mutations may limit the value of SIRT1 agonists in MDS treatment. Nevertheless, FLT3 mutations are rare in the MDS population (Dicker et al., 2010).
In conclusion, we demonstrate how SIRT1 deficiency in MDS HSPCs promotes TET2 hyperacetylation and inactivation, resulting in MDS cell expansion. Remarkably, SIRT1 activation restores TET2 function and disrupts MDS HSPC maintenance, in particular, MDS- initiating activity. Our work highlights SIRT1 activation as a potential therapeutic approach and provides a rationale for designing SIRT1-directed strategies for the treatment of MDS.
STAR METHODS
KEY RESOURCES TABLE
CONTACT FOR REAGENT AND RESOURCE SHARING
Further information and requests for reagents may be directed to and will be fulfilled by Lead Contact, Ling Li (lingli@coh.org).
EXPERIMENTAL MODEL AND SUBJECT DETAILS
Samples
Mobilized peripheral blood (PB) or bone marrow (BM) samples were obtained from normal donors (n=11), AML (n=6), and MDS (n=26) patients at City of Hope (COH) Comprehensive Cancer Center. See Table S1 for age, sex, cytogenetics, and mutation information on human specimens used in the current study. Detailed information of specimens allocated to experiments is also included in Table S1. Risk groups are based on WHO classification. Of the 26 MDS patient samples used in this study, the male:female ratio is 1.6:1, which is close to the male:female ratio (1.51:1) of the whole MDS population (Greenberg et al., 1997). Gender- related differences were not observed regarding SRT1720’s effect on MDS cells colony formation capacity (Figure 5A–5C, Figure S5A-S5H, 5 male vs 6 female, p=0.64). We included FLT3-ITD+ AML specimens for this study as shown in Table S1. Normal peripheral blood stem cells (PBSCs) (n= 11) were obtained from allogeneic transplant donors. Cord blood samples (n=3) used for BCR-ABL overexpression were obtained from StemCyte or UCLA CFAR Virology Core Lab. All subjects signed informed consent forms. Sample acquisition was approved by the COH Institutional Review Board in accordance with the Helsinki Declaration. CD34+ cells were selected using immunomagnetic columns.
Mice
Immunodeficient NSGS mice used for MDS-L and human MDS cells engraftment experiments were obtained from Jackson Laboratory. Immune competent NHD13 mice were purchased from Jackson Laboratory and kindly provided by Dr. Peter D. Aplan. NHD13 mice were mated with Tet2 KO mice (immune competence, C57BL/6J genetic background, The Jackson Laboratory) to obtain NHD13/Tet2+/− mice. NHD13/Tet2+/− mice were bred to NHD13/Tet2+/− mice to generate NHD13/Tet2+/+, NHD13/Tet2+/− and NHD13/Tet2−/− animals. NHD13 mice were also crossed with Sirt1fl/fl/Vav1-Cre mice (immune competence, C57BL/6J genetic background, from Dr. Philipp
Oberdoerffer) to finally produce NHD13/Sirt1fl/fl/Vav1-Cre (NHD13/Sirt1 KO mice). Additionally, NHD13/Sirt1 KO and NHD13/Tet2−/− mice are fertile and viable. For MDS transplant donors, we used the female mice from strains NHD13, NHD13/Tet2−/− and NHD13/Sirt1 KO at approximately 4 months old, which developed MDS; for transplant recipients, we used female CD45.1+ WT B6 mice at 6–8 wks old or female NSGS mice at 6–8 wks old. Genotyping primers and relevant PCR protocols are listed in Table S7. All mice were drug or test naive and not involved in previous procedures. Mice of the same gender and age were randomly divided into groups. Investigators were blinded to mouse genotype while performing treatment or monitoring engraftment or survival. Experimental mice received autoclaved water and clean food. Mice are subjected to 12-hour light/dark cycles and controlled ambient room temperature and air humidity. Mouse care and experimental procedures were performed in accordance with established institutional guidance and approved protocols of the Institutional Animal Care and Use Committee at COH.
Cell line and primary cell culture
The human MDS cell line MDS-L was provided and developed by Dr. Kaoru Tohyama (Tohyama et al., 1995). According to the inventor, cells were cultured in RPMI 1640 medium with 10% FBS and 1% penicillin-streptomycin in the presence of 30 ng/mL human recombinant human IL-3. For MDS-L, no known reference STR profiling is available. To avoid misidentification, cross-contamination, or genetic drifting during the experiments, we replaced the cultured cells with original frozen stock (100 vials totals) which was originally directly provided from inventor Dr. Kaoru Tohyama every other month. Human CB CD34+, PBSC CD34+ and primary MDS CD34+ cells were maintained in StemSpan Serum-Free Expansion Media (Stemcell Technologies) supplemented with recombinant human SCF (50 ng/mL), Flt3 ligand (100 ng/mL), TPO (100 ng/mL), IL-3 (25 ng/mL), and IL-6 (10 ng/mL).
METHOD DETAILS
Mutated Genes Screening and Tracking
17 genes frequently mutated in MDS, including SF3B1, SRSF2, U2AF1, ZRSR2, DNMT3A, EZH2, IDH1/2, TET2, ASXL1, TP53, CBL, KRAS/NRAS, RUNX1, ETV6, NPM1, were analyzed by targeted next-generation sequencing (NGS) using QIAseq Targeted DNA Panels for Human Myeloid Neoplasms. Mutations of SF3B1 (MDS19) and U2AF1 (MDS20) were tracked before and after xenografts. Specifically, DNA fragments surrounding 2 mutation sites were amplified by PCR using the genomic DNA of primary MDS BM cells and human CD45+ cells sorted from xenografts as templates. PCR products were analyzed for NGS, and mutation frequencies were analyzed. All primers were listed in Table S7.
Fluorescence In Situ Hybridization
To track the MDS origin of xenografted cells, primary MDS BM cells and human CD45+ cells sorted from xenografts were analyzed by FISH using 5q probe provided by Abbott, and the 5p15 probe was used as positive control. Briefly, cells were first fixed in methanol-acetic acid (3:1) and then hybridized for 16 hours with denatured DNA probes specific for 5q31 and 5p15. After washing in standard sodium citrate/NP40 buffer, specimen slides were observed under fluorescence microscope, and orange and green signals present in each nucleus were counted and recorded.
TET2 mutation analysis
To verify TET2 mutation status of MDS-L cells, genomic DNA was extracted using commercial kits (Qiagen) and the consensus coding sequence (CCDS) of TET2 was amplified using 17 pairs of primers as previously reported (Delhommeau et al., 2009) through regular PCR with primers listed in Table S7. Briefly, 200 ng DNA template and 1 μl each of forward and reverse primers were added to the PCR premix (Life Technologies) (20 μl final volume). Amplification parameters were an initial denaturation step of 95°C for 20 s, annealing for 20 s at adequate temperature for each primer, and extension at 72°C for 45 s. The quality and sizes of PCR products were assessed by electrophoresis in a 1.5% agarose gel. Products were purified and analyzed by Sanger sequencing using Life Technologies’ 3730 DNA Analyzer. Sample sequences were compared to WT human TET2 sequence (CCDS47120.1) using SnapGene 4.2.
Clinical outcome analysis
Clinical prognostic analysis was performed as described previously (Guezguez et al., 2016). Briefly, array expression data from MDS CD34+ cells (GSE19429, 176 out of 183 patients with survival information) was filtered based on a 141 gene signature, and multiple probe sets were averaged per gene. The log2 expression values were centered to zero median. Subsequently, the sum of the median-centered log2 expression values was used as the risk score for each patient: 176 patients were split into lower- or high-risk groups, depending on whether the score was higher or lower than the mean score. The statistical significance was assessed by log rank Mantel-Cox test.
Lentivirus transduction
In the case of pCDH lentiviral vectors expressing SIRT1 or TET2 cDNA or SIRT1 or TET2 shRNAs, MDS-L cells were exposed to virus-containing supernatants (MOI=5) via spinoculation and then sorted by flow cytometry, based on GFP/RFP expression, or puromycin selection (2 µg/mL) for lentiviral vectors having a puro resistance gene. NHD13 BM lineage negative (Lin-) cells were cultured in SFEM supplemented with murine growth factors (IL-3, 10 ng/mL; IL-6, 10 ng/mL; Flt3L, 100 ng/mL; SCF, 20 ng/mL, and TPO 20 ng/mL) for 48 hours, followed by two exposures to pLKO-shRNA virus-containing supernatants (MOI=20) via spinoculation. Cells were harvested 48 hours later and selected by flow cytometry based on RFP expression. For SIRT1 OE-transduced MDS CD34+ cells, cells were cultured in SFEM supplemented with growth factors (IL-3, 25 ng/mL; IL-6, 10 ng/mL; Flt3L, 100 ng/mL; SCF, 50 ng/mL, and TPO 100 ng/mL) for 48 hours, followed by two exposures to pCDH-GFP vector based virus-containing supernatants (MOI=50) via spinoculation and then sorted with GFP for further experiments. Replication-incompetent lentiviruses were obtained by transient transfection of 293T cells with pCDH plasmids and the pMD2G, pSAPX2 packaging plasmids followed by harvesting of supernatants and titration of infectious virus. Supernatants containing virus particles were collected, filtered, and concentrated using PEG-it (System Biosciences).
Cell transfection
MDS-L cells were transfected with siRNAs or full length TET2 cDNA in pCDNA3.1 by nucleofection (Lonza). All experiments included a FAM-conjugated siRNA as a transfection control, and FAM positivity above 90% was considered a successful transfection. 293T cells were transfected with DNA using JetPRIME transfection reagents (Polyplus) according to the manufacturer’s protocol. All transfection experiments included a GFP vector as a transfection control, and GFP-positive cells >90% was considered successful.
Flow cytometry and cell sorting
Mouse BM was obtained from tibias and femurs of both legs by aspiration. Spleens were removed from mice and pressed with the end of a plunger. Cells were washed with PBS following filtrated with a 70-µm cell strainer and red blood cell lysis. Before FAC analysis, cells were washed twice by PBS and stained with required antibodies in PBS containing 1% BSA for 15 minute at 4°C. Flow cytometry analysis was performed on a 5-laser, 15-detector LSRII. Cell sorting was performed on a 4-laser, 15-detector FACSAria-III or a 6-laser, 18-detector FACSAria II SORP (BD Bioscience). Data were analyzed using BD FACSDiva or FlowJo software. Dead cells were excluded through DAPI (ThermoFisher Scientific) staining. Live single cells were plotted against surface/intracellular markers. The isotype controls were used to determine the boundary between positive and negative cells. Anti-human CD45 antibody was used to determine human MDS cells engraftment in NSGS mice. Anti-human CD34, CD38, CD33, CD11b, and CD14 antibodies were used to mark MDS HSPCs and analyze cell differentiation in NSGS mice BM. Anti-mouse CD45.1 and CD45.2 antibodies were used to determine engraftment of CD45.2+ donor cells (such as NHD13+ cells, NHD13/Tet2−/− cells and NHD13/Sirt1 KO cells) in CD45.1 expressed transplants. Mouse HSPC percentages were evaluated by staining with anti-mouse c-Kit, Sca-1, CD16/32, CD34 antibodies after incubation with biotin linked linage antibody cocktail (including anti-mouse CD3, CD4, CD8, CD11b, CD11c, CD19, CD41, Ter119, B220, IgM, NK1.1, Gr-1and IL7Ra, eBioscience) and staining with FITC or PE labeled streptavidin. Mouse BM cell differentiation was determined by anti-mouse Mac1, Gr-1, B220, and Ter119. Ki-67/DAPI staining was used in cell cycle analysis.
Intracellular staining for SIRT1 and 5hmC
For intracellular staining, cells were first incubated with biotin linked lineage antibody cocktail (including anti-human CD2, CD3, CD7, CD10, CD19, and CD235a, eBioscience) and staining with PE labeled streptavidin, then labeled with HSC surface markers (CD34 and CD38). The stained cells were fixed with 4% paraformaldehyde for 15 mins and permeabilized with 0.5% Saponin permeabilization solution (BD Bioscience) for 1 hr at room temperature. After washing, cells were further labeled with rabbit anti-human SIRT1 (1/200, 1 hr, at 4°C) or isotype control and Alexa 488-conjugated goat anti-rabbit (1/1000, 30 mins, at 4°C) antibodies (Invitrogen), and further analyzed on a 5-laser, 15-detector LSRII. For 5hmC detection, lineage and HSC markers labeled MDS cells were fixed and permeabilized as mentioned above, then labeled with mouse anti-5hmC (1/200, 1 hr, at 4°C) and Alexa 488-conjugated goat anti-mouse (1/1000, 30 mins, at 4°C) antibodies. After washing twice, cells were resuspended in 1%BSA/PBS and analyzed by flow cytometry. Data were analyzed using FlowJo software (version 8.5.2).
In situ proximity ligation assay (PLA)
Sorted Lin-CD34+CD38” MDS cells were fixed and permeabilized and then subjected to an in situ PLA assay according to the Duolink kit (Sigma) manufacturer’s instructions. In brief, cells were deposited on glass slides and fixed with 4% paraformaldehyde. After permeabilization, slides were blocked by Blocking solution provide by the kit for 1 hr at 37°C. Then slides were incubated with primary mouse anti-SIRT1 (1/500) and rabbit anti-TET2 (1/500) antibodies in Doulink Antibody Diluent for 4 hrs at 4°C. After washing, PLUS and MINUS PLA probes provided by the kit were added on the slides and incubated in a pre-heated humidity chamber for 1 hour at 37C. After washing away the PLA pro bes, slides wereincubated with ligation buffer and amplification buffer sequentially in humidity chamber at 37°C. Finally, slides were mounted using anti-fade medium containing DAPI (Santa Cruz) and imaged on a Zeiss upright LSM 510 2-photon confocal microscope.
Analysis of viability, apoptosis, and colony growth
Cell growth was measured utilizing the Cell Titer-Glo Luminescent Cell Viability Assay Kit. Briefly, cells were cultured under different treatment conditions and transferred to 96-well plates for 30 min before assay. Kit substrate and buffer reagents were added to each well and mixed to allow cell lysis. Addition of an additional solution generates a luminescent signal proportional to ATP levels present, which corresponds to the number of metabolically active cells in culture. Plates were read on a Microplate reader (Beckman culture DTX880). Control wells contained medium without cells to assess background luminescence. Results were expressed as a percentage of untreated or control cells, for three replicates. Apoptosis was assessed by Annexin V/DAPI staining followed by flow cytometry. Colony formation capacity based on CFC number or serial replating assays was determined in methylcellulose progenitor assays.
Morphological Analysis
After SRT1720 treatment in vivo, NHD13 BM cells were spread onto slides, stained and evaluated based on morphology for dysplastic phenotypes. Cytospins from BM, SP samples were prepared by diluting 2×10⁵ cells in 100 μl PBS and spinning them on glass microscope slides. Blood smears were prepared by pipetting 5μl of fresh blood mixed with EDTA on a glass microscope slide and spreading it by pulling the edge of another microscope slide over the surface of the first slide starting from the blood drop. Differential staining was performed as the protocol provided by the Wright-Giemsa Stain kit. Briefly, cells on the slides were fixed in absolute methanol for 1 minute and stained in Wright-Giemsa Stain Solution for 1 minute, then smears were rinsed in Phosphate Buffer pH 6.6 solution for 5 minutes. Slides were examined under a microscope after washing with running water. Three BM cytospin slides were scored from each individual animal. Six animals of each group were evaluated; 100 cells were scored on each slide. Tissue sections were stained with hematoxylin and eosin (H&E) stain for morphologic assessment. Images were acquired and analyzed by ZEN Microscope and Imaging Software.
Immunoprecipitation (IP) and Western Blotting
Cells were lysed in modified RIPA buffer with only 1% NP40 supplemented with protease and phosphatase inhibitors. Antibodies used for IP were conjugated to protein A/G beads (Millipore). Boiled lysates were then resolved on 3–8% gradient gels (ThermoFisher Scientific) or 10% SDS- PAGE gels and transferred to nitrocellulose membranes (Bio-Rad). Proteins of interest were sequentially probed with primary and secondary antibodies. Horseradish peroxidase- conjugated secondary antibodies were from Jackson ImmunoResearch Laboratories (Westgrove). Antibody detection was performed with SuperSignal™ West Pico or Femato kits. Results were imaged by G:BOX Chemi XX6 gel doc systems (Syngene) and visualized in the GeneSys image acquisition software (Syngene).
In vitro TET2 activity assay
To prepare TET2 enzyme, Flag-tagged TET2-CD variants were ectopically expressed in 293T expressing CBP. Flag-tagged TET2-CD proteins were immunoprecipitated using anti-Flag beads and eluted from beads by Flag peptides. Enzyme activity assay was performed using 5mC-Hydroxylase TET Activity/Inhibition Assay Kit. Briefly, methylated DNA substrate as provided by the kit was incubated with purified TET2-CD proteins. 5hmC products, which are proportional to enzyme activity, were detected in each reaction using a specific anti-5hmC antibody through colorimetric measurement by reading the absorbance in a microplate spectrophotometer at a wavelength of 450 nm.
Electrophoretic mobility shift assay (EMSA)
EMSA was performed using a LightShift Chemiluminescent EMSA kit (ThermoFisher Scientific). Biotin-labeled, single-stranded oligonucleotides used for the TET/DNA binding assay were synthesized and annealed. Sequences of single-stranded oligonucleotides used for the methylated CpG probe were: 5’-GTATGCCTCATGCmCGGACTTAACTGCAGTG-3’ and 3’- CATACGGAGTACGGmCCTGAA TTGACGTCAC-5’. Equal amounts of immunopurified Flag- tagged TET2 proteins were incubated in a 20 µl reaction mix containing 1 ng biotin-labeled oligonucleotide at room temperature for 20 minutes. Protein/DNA complexes were resolved on a 6% DNA retardation gel (EC63652BOX, Life Technologies) in 0.5 χ TBE buffer and transferred to a nylon membrane (380mA, 30 mins). After UV-light crosslinking and blocking, the membrane was incubated in stabilized Streptavidin-Horseradish Peroxidase Conjugate buffer and substrate buffer provided by the kit sequentially. Result was imaged by G:BOX Chemi XX6 gel doc systems (Syngene) and visualized in the GeneSys image acquisition software (Syngene).
5hmC quantification by dot blot and ELISA
For dot blot assay, two-fold serial DNA dilutions from a starting amount of 500ng were spotted on a nitrocellulose membrane, and the membrane was UV cross-linked prior to incubation with an anti-5hmC antibody. -Samples were washed and then incubated with HRP-conjugated secondary antibody for 1 hr at room temperature. After three TBST washes, signals were detected using an ECL kit (ThermoFisher Scientific). To ensure equal DNA loading, the membrane was stained in 0.02% methylene blue in 0.3M sodium acetate. ELISA was used to quantify 5hmC levels, according to a protocol provided with the MethylFlash Hydroxymethylated DNA 5-hmC Quantification kit. Briefly, equal amount (100ng) of genomic DNA was bound to the bottom of 96-well plate. 5-hmC was detected by mouse anti-5hmC antibody (1/1000, at room temperature for 30 mins) and further anti-mouse secondary antibody (1/5000, at room temperature for 30 mins) sequentially. After color reaction, the absorbance was determined on a microplate reader (FilterMax F5, Molecular Devices) at 450 nm.
mRNA Microarray
Total RNA was isolated from SIRT1 KD, TET2 KD or control MDS-L cells using Trizol Reagent (Life technologies) following the manufacturer’s instructions. RNA with a RIN quality score >6 was amplified using a Onearray Amino Allyl aRNA Amplification kit (Phalanx Biotech Group) and labeled with Cy5. 0.1µg Cy5-labeled aRNA of a respective sample was fragmented and hybridized onto HlncOA 1.0 (BGI) at 65C for 17 h using a Phalanx OneArray hybridization kit (Phalanx Biotech Group). After washing, arrays were scanned using an Agilent Microarray Scanner (G2505C).
hMeDIP-seq and analysis
hMeDIP was performed according to a protocol provided in the SimpleDIP™ Hydroxymethylated DNA IP kit (Cell Signaling Technology Inc.). First, illumina barcode adapters were ligated to sonicated genomic DNA before hMeDIP, and DNA was then denatured and incubated with anti-5hmC antibody at 4°C overnight. The DNA/antibody complex was then captured on protein G magnetic beads. Enriched DNA was purified and sequenced followed by standard illumina protocols on the Illumina HiSeq 2500 platform (illumina). Sequencing reads were aligned to the human genome build GRCh37/hg19 using the Burrows-Wheeler Aligner (BWA, v0.7.5a).
hMeDIP-qPCR and RT-qPCR analysis
hMeDIP assays were performed based on the manufacturer’s instructions using the SimpleDIP™ kit described above. DNA was denatured and IP’d with anti-5hmC or IgG control antibodies and protein G magnetic beads. After three washes, 5hmC-modified DNA was eluted from beads, purified and used as the template in qPCR. For RT-qPCR, RNA was isolated using Trizol reagent (Invitrogen) or an RNeasy micro kit (Qiagen), following standard manufacturers’ protocols. First-strand cDNA was generated using SuperScript III reverse transcriptase (Invitrogen). Quantitative real time PCR was performed using TaqMan or SYBR Green master mix (Life Technologies) with 0.2µm Taqman probe (Life Technologies) or gene-specific primers. Signals were detected with a QuantStudio 7 Flex Real-Time PCR system (Life Biotechnology). Relative expression levels were determined by normalizing to GAPDH or Beta-actin levels. All primers were listed in Table S7.
Mass spectrometry
For In-gel digestion, proteins IP’d by anti-TET2 or anti-acetylated lysine antibodies were separated by SDS-PAGE. After silver staining, bands of interest were excised and digested by
trypsin. Tryptic peptides were extracted in 50% ACN/0.1% formic acid and dried. LC/MS/MS experiments were performed on a ThermoFisher Scientific Orbitrap Fusion Mass Spectrometer equipped with an Easy Spray source and an Easy-nLC1000 system. Briefly, mobile phases (MP) were composed of MP-A (0.1% formic acid in water) and MP-B (0.1% formic acid in ACN). Samples (10 μL) were loaded onto a trapping column (Acclaim PepMap100, 75μm x 2cm, C18, 3 μm, 100 A; ThermoFisher Scientific) and separated on an integrated Easy-Spray column emitter packed with PepMap C18 (3 μm, 100 A particles (75 μm x 15cm)). Column temperature was maintained at 45°0. Samples were desalted for 2 .4 min with MP-A at a flow rate of 5 μL/min; tryptic peptides were separated at a flow rate of 300 nL/min using a linear gradient from 3% to 35% of MP-B over 25 min, followed by a fast gradient to 90% MP-B in 3 min and then 90% MP-B for 2 min. Data was acquired on an Orbitrap Fusion Mass Spectrometer using a resolution of 120,000 (at 200 m/z) for full scans over a 400–1600 m/z range (a maximum of 0.75s between full scans), followed by collision-induced dissociation fragmentation of individual peptides (at top speed setting) and detection of fragmentation ions in the ion trap. Spray voltage was set at 2300 V, the S-lens RF level to 60 and the heated capillary temperature to 275C. For MS, the AGC target was set at 2.5 × 10⁵ and maximum injection time was 100 ms. For the MS/MS experiment, AGC was set to 1× 10⁴ and injection time to 35 ms. Isolation width was set at 2 Da, and collision energy was set to 35%. One microscan was acquired for one spectrum, and dynamic exclusion was set at 15 s. For data analysis, tandem MS2 mass spectra were processed using Proteome Discoverer. Exported MGF files were searched by Mascot v.2.5.0 (Matrix Science) against the database Uniprot (selected for Homo sapiens, unknown version, 159,552 entries). Mascot parameters were set for peptide searching, including tolerance of three missed cleavages by trypsin, carbamidomethylation as a fixed modification, and lysine acetylation as a variable modification. Precursor mass tolerance was 10 ppm, and product ion tolerance was 0.6 Da. After database searching, DAT files were imported into Scaffold v4.3.2 (Proteome Software Inc.) for analysis.
Human MDS cell-engrafted mouse model
MDS-L cells either overexpressing or deficient in SIRT1 were transplanted (1×10⁶ cells/mouse) via tail vein injection into sublethally-irradiated (250 cGy) 8-week-old female immunodeficient NOD-scid IL2Rgnull-3/GM/SF (NSGS) mice (Jackson Laboratory), and mice were treated with SRT1720 (100mg/kg/day, p.o., n=6) or vehicle (1% DMSO in 20% cyclodextrin, n=6) for 2 weeks. Engraftment of human CD45+ and CD33+ cells in BM, PB or spleen was analyzed by flow cytometry. Survival of mice engrafted with SIRT-overexpressing or SPT1720-treated MDS- L cells was monitored daily. For MDS specimen engraftment, after ex vivo treatment with SRT1720 (2.5 µM) or vehicle (DMSO), CD34+ MDS cells (2×10⁶ cells/mouse) were transplanted into sublethally-irradiated (250 cGy) 8-week-old female NSGS mice (The number of mice is indicated in the figure legend, different number of mice used in groups is due to sample availability). Twelve weeks later, engrafted human cells were identified by labeling BM cells with anti-human CD45 antibody, followed by flow cytometry analysis. Human cell subpopulations were identified by labeling with anti-human CD34, CD38, CD33, CD11b, CD14 antibodies.
In vivo treatment of transgenic NHD13 mice
To assess effects of SRT1720 treatment, we transplanted CD45.2+ cells from 4 months old female primary NHD13 (n=3) mice to a cohort of 8-week-old female CD45.1+ syngenic recipients (n=12). Primary recipients were monitored by performing complete blood counts (CBC) (Drew Hemavet 950FS). While recipients showed abnormal CBC around 120 days after BMT, mice were treated for 12 weeks with SRT1720 (100mg/kg/day, p.o., n=6) or vehicle (1% DMSO in 20% cyclodextrin, n=6). After treatment, animals were euthanized, and PB, BM and spleen cells obtained. The number of total nucleated cells, CD45.2+ cells as well as mature myeloid progenitors was determined by flow cytometry. PB and BM cells were immunophenotyped with the following antibodies: CD45.2, CD45.1, Mac1, Gr1, c-Kit, Ter119 and B220. For progenitor cell analyses, BM cells were stained with the following antibodies: lineage (CD3, CD4, CD8, CD11b, CD11c, CD19, CD41, Ter119, B220, IgM, NK1.1, Gr-1and IL7Ra), Sca1, c-Kit, CD16/32 and CD34. Secondary transplantation was performed using two million BM cells from SRT1720- or vehicle-treated primary recipients. Sixteen weeks later, engraftment of donor-derived cells in PB and BM cells was evaluated.
Quantification and Statistical Analysis
Microarray data analysis
Data processing was performed and analyzed using R language (v3.3.0). Comparisons between samples were calculated by limma package (Bioconductor), p values were calculated by Empirical Bayes Statistics after fitting with linear model. Microarray data files will be deposited in the Gene Expression Omnibus. Table S6 lists genes commonly down-regulated in SIRT1KD and TET2KD cells.
hMeDIP-seq data analysis
MACS2 algorithm (Model-Based Analysis of ChIP-Seq) was utilized to define peaks with significantly enriched signals. Peaks showing higher read coverage in SOE vs MOCK were defined as hyper-hydroxymethylated (FC [SIRT1OE/MOCK] > 3), while peaks showing higher read coverage in MOCK were defined as hypo-hydroxymethylated (FC [SIRT1OE/MOCK] < 0 33), statistical analysis was performed using two-tailed type 2 Student’s t-test, and p values <0.05 were considered statistically significant. Genome browser tracks were normalized by total reads in each library and converted to bigWig format for visualization on the UCSC Genome Browser. Localization of genomic peaks was determined using annotatePeaks (Heinz et al., 2010) based on RefSeq as a reference. Proximal peaks were defined as located within ±5 kb of a TSS; other peaks were classified as distal. The GREAT tool (3.0.0) (McLean et al., 2010) was used with default (5.0 kb upstream, 1.0 kb downstream, plus Distal up to 1000.0 kb). To evaluate 5hmC peaks and enhancer co-localization, we employed H3K27ac ChIP datasets of normal CD34+, CD14+ monocytes, normal PB MNCs and K562 cells from ENCODE to aggregate with our 5hmC distribution datasets. Customized python script was used to generate random regions in the genome with matched number and size distribution to H2K27ac peaks. This simulation was done 10 times independently, and the average number of 5hmC peaks overlapping with random peaks was used. The script is available upon request.
Statistics
Unless otherwise specified, data obtained from independent experiments are reported as means ± SEM, and statistical analyses were performed using two-tailed (non-directional), type 2 (assume equal variance) or type 3 (assume unequal variance) Student’s t test using Graphpad Prim 7 software. As we have indicated in the legends, significance of survival curves were determined using the log-rank (Mantel-Cox) test (Figure 1J and Figure 5S); Linear regression analysis was performed to evaluate the correlation between microRNA level and SIRT1 protein or mRNA expression (Figure S1D-S1E); Effect of SIRT1-TET2 axis target genes expression on MDS patients’ prognosis was determined by univariate Kaplan-Meier analysis with log-rank test (Figure S4E). Differential gene expression was analyzed by Empirical Bayes Statistics, after fitting with linear model (Figure 4C). Significance of 5hmC peaks enrichment at enhancers was determined by Pearson’s Chi-squared test with Yates’ continuity correction (Table S5). p values <0.05 were considered statistically significant. *p < 0.05; **p < 0.01; ***p < 0.001; ns, not significant. The data were normally distributed, and variation within and between groups was not estimated. The sample size was not pre-selected, and no inclusion/exclusion criteria were used. The “n” in the figures or results represents the number of samples or animals used in the indicated experiments. Cells used for transplantation in Figure 1Q, Figure 6A, Figure 6M and Figure 6N were pooled from 6 indicated mice. The experiments involved with primary human samples were performed once: Figure 1A (10 normal, 18 MDS), 1B (7 normal, 9 MDS), 1C (10 normal, 18 MDS), 1K (3 MDS), 1M (3 normal), S1A-S1B (10 normal, 18 MDS), S1D-S1E (18 MDS), 2I (3 normal, 3 MDS), 5A-5C (3 MDS), 5D (5 normal), 5E (2 MDS), 5F (4 MDS), 5G (3 MDS), 5I-5N (3 samples, and 3–6 mice per group), S5A-S5H (8 MDS), S5I-S5J (2 MDS), S5K (4 MDS), S5L (1 MDS), S5M (2 MDS), S5N (1 MDS), S5O (2 MDS), S5P-S5Q (1 MDS), S7P (6 normal, 6AML, 16 MDS); The experiments involved with NHD13 mice model were performed once: Figure 1O (6 mice per group), 1P (3 mice per group), 1Q (6 mice per group), S1U (3 mice per group), S1V-S1Z (6 mice per group), 6A-6O (6 mice per group), S6A-S6L (6 mice per group), S6R-S6U (6 mice per group); The experiment for screening SIRT1 potential targets were performed once: Figure 2A and S2A. Microarray and hMeDIP-seq were performed once: Figure 4A–4E, 4G, S4A-S4E; The experiments involved with MDS-L NSGS engraftment model were performed twice: Figure 1H–1J (6 mice per group), 1N (5 control, 6 SIRT1 KD), 3H (6 mice per group), 5O-5S (6 mice per group). All the other experiments were performed three times.
Data and Software Availability
Microarray data of MDS-L cells with SIRT1 or TET2 knock-down is available at GEO: GSE117272, hMeDIP-seq data of MDS-L cells with SIRT1 overexpression is available at GEO: GSE117363. Also see Key Resources Table.
Supplementary Material
Highlights:
SIRT1 depletion enhances MDS HSPC self-renewal and growth.
SIRT1 insufficiency in MDS promotes TET2 hyperacetylation.
SIRT1 agonist treatment blocks MDS HSPC maintenance.
SIRT 1 activation deacetylates TET2 and enhances its catalytic activity.
Acknowledgments
This work was supported in part by the National Institutes of Health under award number R00CA184411, R01HL141336, the Margaret E. Early Medical Research Trust Award, a Stop Cancer Research Career Development Award, a V Scholar award, and the Gehr Family Center for Leukemia Research (to L.L.). Research reported here includes work performed in the Analytical Cytometry Core, Integrative Genomics Core with technical support from Jinhui Wang, Translational Biomarker Discovery Core, with technical support from Yunan Miao, Pathology (Liquid Tumor) and Animal Resource Center at City of Hope, supported by the National Cancer Institute of the National Institutes of Health under award number P30CA33572. The content is solely the responsibility of the authors and does not necessarily represent the official views of the National Institutes of Health. We are grateful to the COH Comprehensive Cancer Center and patients, donors and their physicians for providing primary specimens for this study. We thank StemCyte for CB samples, the UCLA CFAR Virology core (supported by grant 5P30 AI028697 and the UCLA AIDS Institute) for CB samples, and Dr. Guoliang Xu for TET2 DNA constructs. J.B. and A.P. acknowledge support of Bloodwise UK. H.J. acknowledges grant support from National Natural Science Foundation of China (8171101166; 91740106).
Footnotes
Declaration of Interests
The authors declare that no conflicts of interest exist.
Publisher's Disclaimer: This is a PDF file of an unedited manuscript that has been accepted for publication.As a service to our customers we are providing this early version of the manuscript.The manuscript will undergo copyediting, typesetting, and review of the resulting proof before it is published in its final citable form. Please note that during the production process errors may be discovered which could affect the content, and all legal disclaimers that apply to the journal pertain.
References
- Agathocleous M, Meacham CE, Burgess RJ, Piskounova E, Zhao Z, Crane GM, Cowin BL, Bruner E, Murphy MM, Chen W, et al. (2017). Ascorbate regulates haematopoietic stem cell function and leukaemogenesis. Nature. [DOI] [PMC free article] [PubMed] [Google Scholar]
- Arioka Y, Watanabe A, Saito K, and Yamada Y (2012). Activation-induced cytidine deaminase alters the subcellular localization of Tet family proteins. PloS one 7, e45031. [DOI] [PMC free article] [PubMed] [Google Scholar]
- Aslanyan MG, Kroeze LI, Langemeijer SM, Koorenhof-Scheele TN, Massop M, van Hoogen P, Stevens-Linders E, van de Locht LT, Tonnissen E, van der Heijden A, et al. (2014). Clinical and biological impact of TET2 mutations and expression in younger adult AML patients treated within the EOrTc/GIMEMA AML-12 clinical trial. Annals of hematology 93, 1401–1412. [DOI] [PubMed] [Google Scholar]
- Baksi A, Kraydashenko O, Zalevkaya A, Stets R, Elliott P, Haddad J, Hoffmann E, Vlasuk GP, and Jacobson EW (2014). A phase II, randomized, placebo-controlled, doubleblind, multi-dose study of SRT2104, a SIRT1 activator, in subjects with type 2 diabetes. British journal of clinical pharmacology 78, 69–77. [DOI] [PMC free article] [PubMed] [Google Scholar]
- Brooks CL, and Gu W (2009). How does SIRT1 affect metabolism, senescence and cancer? Nature reviews Cancer 9, 123–128. [DOI] [PMC free article] [PubMed] [Google Scholar]
- Chalkiadaki A, and Guarente L (2015). The multifaceted functions of sirtuins in cancer. Nature reviews Cancer 15, 608–624. [DOI] [PubMed] [Google Scholar]
- Cheng HL, Mostoslavsky R, Saito S, Manis JP, Gu Y, Patel P, Bronson R, Appella E, Alt FW, and Chua KF (2003). Developmental defects and p53 hyperacetylation in Sir2 homolog (SIRT1)-deficient mice. Proceedings of the National Academy of Sciences of the United States of America 100, 10794–10799. [DOI] [PMC free article] [PubMed] [Google Scholar]
- Chung YJ, Choi CW, Slape C, Fry T, and Aplan PD (2008). Transplantation of a myelodysplastic syndrome by a long-term repopulating hematopoietic cell. Proceedings of the National Academy of Sciences of the United States of America 105, 14088–14093. [DOI] [PMC free article] [PubMed] [Google Scholar]
- Cimmino L, Dolgalev I, Wang Y, Yoshimi A, Martin GH, Wang J, Ng V, Xia B, Witkowski MT, Mitchell-Flack M, et al. (2017). Restoration of TET2 Function Blocks Aberrant Self-Renewal and Leukemia Progression. Cell 170, 1079–1095 e1020. [DOI] [PMC free article] [PubMed] [Google Scholar]
- Delhommeau F, Dupont S, Della Valle V, James C, Trannoy S, Masse A, Kosmider O, Le Couedic JP, Robert F, Alberdi A, et al. (2009). Mutation in TET2 in myeloid cancers. The New England journal of medicine 360, 2289–2301. [DOI] [PubMed] [Google Scholar]
- Dicker F, Haferlach C, Sundermann J, Wendland N, Weiss T, Kern W, Haferlach T, and Schnittger S (2010). Mutation analysis for RUNX1, MLL-PTD, FLT3-ITD, NPM1 and NRAS in 269 patients with MDS or secondary AmL . Leukemia 24, 1528–1532. [DOI] [PubMed] [Google Scholar]
- Dostalova Merkerova M, Krejcik Z, Votavova H, Belickova M, Vasikova A, and Cermak J (2011). Distinctive microRNA expression profiles in CD34+ bone marrow cells from patients with myelodysplastic syndrome. European journal of human genetics : EJHG 19, 313–319. [DOI] [PMC free article] [PubMed] [Google Scholar]
- Ebert BL (2010). Preface. The biology and treatment of myelodysplastic syndrome. Hematology/oncology clinics of North America 24, xiii–xvi. [DOI] [PubMed] [Google Scholar]
- Greenberg P, Cox C, LeBeau MM, Fenaux P, Morel P, Sanz G, Sanz M, Vallespi T, Hamblin T, Oscier D, et al. (1997). International scoring system for evaluating prognosis in myelodysplastic syndromes. Blood 89, 2079–2088. [PubMed] [Google Scholar]
- Greenblatt S, Li L, Slape C, Nguyen B, Novak R, Duffield A, Huso D, Desiderio S, Borowitz MJ, Aplan P, and Small D (2012). Knock-in of a FLT3/ITD mutation cooperates with a NUP98-HOXD13 fusion to generate acute myeloid leukemia in a mouse model. Blood 119, 2883–2894. [DOI] [PMC free article] [PubMed] [Google Scholar]
- Guezguez B, Almakadi M, Benoit YD, Shapovalova Z, Rahmig S, Fiebig-Comyn A, Casado FL, Tanasijevic B, Bresolin S, Masetti R, et al. (2016). GSK3 Deficiencies in Hematopoietic Stem Cells Initiate Pre-neoplastic State that Is Predictive of Clinical Outcomes of Human Acute Leukemia. Cancer cell 29, 61–74. [DOI] [PubMed] [Google Scholar]
- Han MK, Song EK, Guo Y, Ou X, Mantel C, and Broxmeyer HE (2008). SIRT1 regulates apoptosis and Nanog expression in mouse embryonic stem cells by controlling p53 subcellular localization. Cell stem cell 2, 241–251. [DOI] [PMC free article] [PubMed] [Google Scholar]
- Hu L, Li Z, Cheng J, Rao Q, Gong W, Liu M, Shi YG, Zhu J, Wang P, and Xu Y (2013). Crystal structure of TET2-DNA complex: insight into TET-mediated 5mC oxidation. Cell 155, 1545–1555. [DOI] [PubMed] [Google Scholar]
- Hubbard BP, Gomes AP, Dai H, Li J, Case AW, Considine T, Riera TV, Lee JE, E SY, Lamming DW, et al. (2013). Evidence for a common mechanism of SIRT1 regulation by allosteric activators. Science 339, 1216–1219. [DOI] [PMC free article] [PubMed] [Google Scholar]
- Kim SY, Sim CK, Tang H, Han W, Zhang K, and Xu F (2016). Acetylome study in mouse adipocytes identifies targets of SIRT1 deacetylation in chromatin organization and RNA processing. Archives of biochemistry and biophysics 598, 1–10. [DOI] [PubMed] [Google Scholar]
- Ko M, An J, Bandukwala HS, Chavez L, Aijo T, Pastor WA, Segal MF, Li H, Koh KP, Lahdesmaki H, et al. (2013). Modulation of TET2 expression and 5-methylcytosine oxidation by the CXXC domain protein IDAX. Nature 497, 122–126. [DOI] [PMC free article] [PubMed] [Google Scholar]
- Ko M, and Rao A (2011). TET2: epigenetic safeguard for HSC. Blood 118, 4501–4503. [DOI] [PubMed] [Google Scholar]
- Li L, Wang L, Li L, Wang Z, Ho Y, McDonald T, Holyoake TL, Chen W, and Bhatia R (2012). Activation of p53 by SIRT1 inhibition enhances elimination of CML leukemia stem cells in combination with imatinib. Cancer cell 21, 266–281. [DOI] [PMC free article] [PubMed] [Google Scholar]
- Li Z, Cai X, Cai CL, Wang J, Zhang W, Petersen BE, Yang FC, and Xu M (2011). Deletion of Tet2 in mice leads to dysregulated hematopoietic stem cells and subsequent development of myeloid malignancies. Blood 118, 4509–4518. [DOI] [PMC free article] [PubMed] [Google Scholar]
- Lin TL, Nagata Y, Kao HW, Sanada M, Okuno Y, Huang CF, Liang DC, Kuo MC, Lai CL, Lee EH, et al. (2014). Clonal leukemic evolution in myelodysplastic syndromes with TET2 and IDH1/2 mutations. Haematologica 99, 28–36. [DOI] [PMC free article] [PubMed] [Google Scholar]
- Liu X, Zhang G, Yi Y, Xiao L, Pei M, Liu S, Luo Y, Zhong H, Xu Y, Zheng W, and Shen J (2013). Decreased 5-hydroxymethylcytosine levels are associated with TET2 mutation and unfavorable overall survival in myelodysplastic syndromes. Leukemia & lymphoma 54, 2466–2473. [DOI] [PubMed] [Google Scholar]
- Makishima H, Yoshizato T, Yoshida K, Sekeres MA, Radivoyevitch T, Suzuki H, Przychodzen B, Nagata Y, Meggendorfer M, Sanada M, et al. (2017). Dynamics of clonal evolution in myelodysplastic syndromes. Nature genetics 49, 204–212. [DOI] [PMC free article] [PubMed] [Google Scholar]
- Matsuoka A, Tochigi A, Kishimoto M, Nakahara T, Kondo T, Tsujioka T, Tasaka T, Tohyama Y, and Tohyama K (2010). Lenalidomide induces cell death in an MDS-derived cell line with deletion of chromosome 5q by inhibition of cytokinesis. Leukemia 24, 748–755. [DOI] [PubMed] [Google Scholar]
- Milne JC, Lambert PD, Schenk S, Carney DP, Smith JJ, Gagne DJ, Jin L, Boss O, Perni RB, Vu CB, et al. (2007). Small molecule activators of SIRT1 as therapeutics for the treatment of type 2 diabetes. Nature 450, 712–716. [DOI] [PMC free article] [PubMed] [Google Scholar]
- Montagner S, Leoni C, Emming S, Della Chiara G, Balestrieri C, Barozzi I, Piccolo V, Togher S, Ko M, Rao A, et al. (2016). TET2 Regulates Mast Cell Differentiation and Proliferation through Catalytic and Non-catalytic Activities. Cell reports 15, 1566–1579. [DOI] [PMC free article] [PubMed] [Google Scholar]
- Moran-Crusio K, Reavie L, Shih A, Abdel-Wahab O, Ndiaye-Lobry D, Lobry C, Figueroa ME, Vasanthakumar A, Patel J, Zhao X, et al. (2011). Tet2 loss leads to increased hematopoietic stem cell self-renewal and myeloid transformation. Cancer cell 20, 11–24. [DOI] [PMC free article] [PubMed] [Google Scholar]
- Nakagawa T, Lv L, Nakagawa M, Yu Y, Yu C, D’Alessio AC, Nakayama K, Fan HY, Chen X, and Xiong Y (2015). CRL4(VprBP) E3 ligase promotes monoubiquitylation and chromatin binding of TET dioxygenases. Molecular cell 57, 247–260. [DOI] [PMC free article] [PubMed] [Google Scholar]
- Pellagatti A, Cazzola M, Giagounidis A, Perry J, Malcovati L, Della Porta MG, Jadersten M, Killick S, Verma A, Norbury CJ, et al. (2010). Deregulated gene expression pathways in myelodysplastic syndrome hematopoietic stem cells. Leukemia 24, 756–764. [DOI] [PubMed] [Google Scholar]
- Rasmussen KD, Jia G, Johansen JV, Pedersen MT, Rapin N, Bagger FO, Porse BT, Bernard OA, Christensen J, and Helin K (2015). Loss of TET2 in hematopoietic cells leads to DNA hypermethylation of active enhancers and induction of leukemogenesis. Genes & development 29, 910–922. [DOI] [PMC free article] [PubMed] [Google Scholar]
- Rhyasen GW, and Starczynowski DT (2012). Deregulation of microRNAs in myelodysplastic syndrome. Leukemia 26, 13–22. [DOI] [PubMed] [Google Scholar]
- Rhyasen GW, Wunderlich M, Tohyama K, Garcia-Manero G, Mulloy JC, and Starczynowski DT (2014). An MDS xenograft model utilizing a patient-derived cell line. Leukemia 28, 1142–1145. [DOI] [PMC free article] [PubMed] [Google Scholar]
- Sasca D, Hahnel PS, Szybinski J, Khawaja K, Kriege O, Pante SV, Bullinger L, Strand S, Strand D, Theobald M, and Kindler T (2014). SIRT1 prevents genotoxic stress- induced p53 activation in acute myeloid leukemia. Blood 124, 121–133. [DOI] [PubMed] [Google Scholar]
- Shastri A, Will B, Steidl U, and Verma A (2017). Stem and progenitor cell alterations in myelodysplastic syndromes. Blood 129, 1586–1594. [DOI] [PMC free article] [PubMed] [Google Scholar]
- Singh SK, Williams CA, Klarmann K, Burkett SS, Keller JR, and Oberdoerffer P (2013). Sirt1 ablation promotes stress-induced loss of epigenetic and genomic hematopoietic stem and progenitor cell maintenance. The Journal of experimental medicine 210, 987–1001. [DOI] [PMC free article] [PubMed] [Google Scholar]
- Solomon JM, Pasupuleti R, Xu L, McDonagh T, Curtis R, DiStefano PS, and Huber LJ (2006). Inhibition of SIRT1 catalytic activity increases p53 acetylation but does not alter cell survival following DNA damage. Molecular and cellular biology 26, 28–38. [DOI] [PMC free article] [PubMed] [Google Scholar]
- Sperling AS, Gibson CJ, and Ebert BL (2017). The genetics of myelodysplastic syndrome: from clonal haematopoiesis to secondary leukaemia. Nature reviews Cancer 17, 5–19. [DOI] [PMC free article] [PubMed] [Google Scholar]
- Tohyama K, Tsutani H, Ueda T, Nakamura T, and Yoshida Y (1994). Establishment and characterization of a novel myeloid cell line from the bone marrow of a patient with the myelodysplastic syndrome. British journal of haematology 87, 235–242. [DOI] [PubMed] [Google Scholar]
- Yamazaki J, Jelinek J, Lu Y, Cesaroni M, Madzo J, Neumann F, He R, Taby R, Vasanthakumar A, Macrae T, et al. (2015). TET2 Mutations Affect Non-CpG Island DNA Methylation at Enhancers and Transcription Factor-Binding Sites in Chronic Myelomonocytic Leukemia. Cancer research 75, 2833–2843. [DOI] [PMC free article] [PubMed] [Google Scholar]
- Ye D, Ma S, Xiong Y, and Guan KL (2013). R-2-hydroxyglutarate as the key effector of IDH mutations promoting oncogenesis. Cancer cell 23, 274–276. [DOI] [PMC free article] [PubMed] [Google Scholar]
- Zhang YW, Wang Z, Xie W, Cai Y, Xia L, Easwaran H, Luo J, Yen RC, Li Y, and Baylin SB (2017). Acetylation Enhances TET2 Function in Protecting against Abnormal DNA Methylation during Oxidative Stress. Molecular cell 65, 323–335. [DOI] [PMC free article] [PubMed] [Google Scholar]
Associated Data
This section collects any data citations, data availability statements, or supplementary materials included in this article.