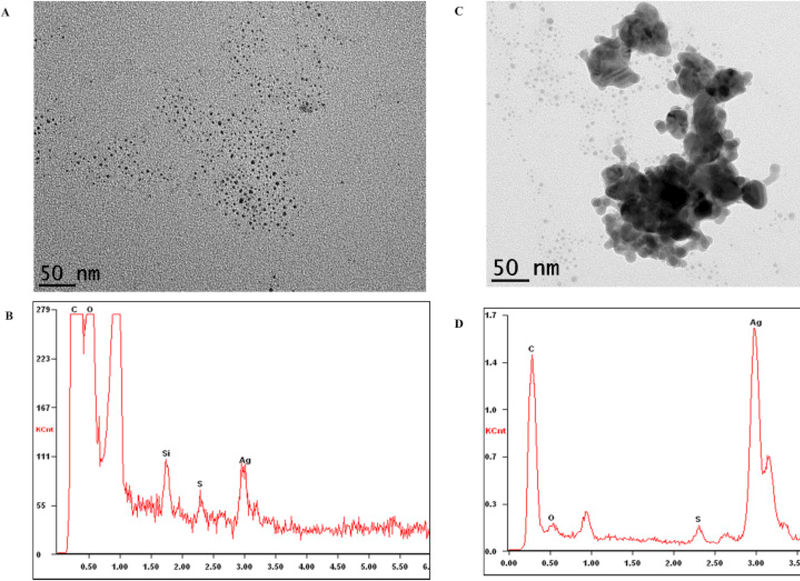
Fig. 5.
(A and C) TEM images of nanosilver after re-circulation through the dental tubing for 3 days. Image A) displays small AgNPs (3–5 nm) and image C) displays a large partially-aggregated Ag particle surrounded by small (3–5 nm) AgNPs. (B and D) are the corresponding EDX spectra of the particles presented in images A and C, respectively.

