

Abstract
Traumatic brain injury (TBI) is associated with trauma-related death. In this study, we evaluated differences in the expression of plasma microRNAs (miRNAs) in patients with different degrees of TBI, and explored the potential of miRNAs for use as diagnostic TBI biomarkers. The miRNA microarray results showed upregulation of 65, 33, and 16 miRNAs and downregulation of 29, 27, and 6 miRNAs in patients with mild, moderate, and severe TBI, respectively, compared with healthy controls. Thirteen miRNAs (seven upregulated and six downregulated) were found to be present in all TBI groups. Seven upregulated miRNAs were selected for validation in an enlarged cohort of samples and showed good diagnostic accuracy. The expression levels of miR-3195 and miR-328-5p were higher in the severe TBI group than in the mild and moderate TBI groups. In summary, our study demonstrates different expression profiles in plasma miRNAs among patients with mild to severe TBI. A subset of seven miRNAs can be used for diagnosis of TBI. Moreover, miR-3195 and miR-328-5p may be utilized during diagnosis to distinguish mild and moderate TBI from severe TBI.
Introduction
Trauma is the fourth leading cause of death after heart disease, cancer, and cerebrovascular accidents. Traumatic brain injury (TBI), which accounts for most trauma-related deaths, is a leading cause of death in young people in China [1, 2]. There are 3–4 million TBI cases in China every year, and the mortality and disability rates occurring as a result of TBI are very high, in spite of the development of treatments [2].
The diagnosis of TBI is mainly based on a neurological examination of the patient, but also on imaging techniques such as computed tomography (CT) or magnetic resonance imaging (MRI) [3]. The Glasgow Coma Scale (GCS) is the most commonly used system for classifying TBI severity; a total score of 13–15 refers to mild TBI, 9–12 to moderate TBI, and 3–8 to severe TBI [4]. CT and MRI scans often fail to detect lesions caused by injury, due to limited sensitivity and the absence of micro-bleeds; this makes the detection of severe TBI easy, but the detection of mild and moderate TBI more difficult [5, 6]. Moreover, the GCS score has limitations in diagnosing mild TBI in the presence of polytrauma, alcohol abuse, use of sedatives, and psychological stress [6, 7].
Biomarkers have been utilized for the diagnosis of multiple diverse diseases and to uncover underlying pathologies in, for example, oncology, cardiology, hepatology, hematology, and infectious diseases [8–12]. Biomarkers are critical for the rational development of drugs and medical devices. However, there is significant confusion about the fundamental definitions and concepts involved in their use in research and clinical practice. A number of subtypes of biomarkers have been defined according to their putative applications. Recently, a joint task force from the U.S. Food and Drug Administration and the National Institutes of Health established common definitions, which divided biomarkers into a number of subtypes according to their putative applications. Among these subtypes, diagnostic biomarkers detect or confirm the presence of a disease or condition of interest, or identify an individual with a subtype of the disease [13, 14]. To date, the lack of diagnostic biomarkers in the field of TBI is a major barrier to the improvement of diagnostic evaluation and clinical care [15, 16]. To assist in the diagnosis of TBI, diagnostic biomarkers in the blood, urine, and cerebrospinal fluid (CSF) are under investigation. Up to now, the majority of TBI biomarker research has focused on protein profiling. The most widely studied blood biomarkers are S100β, glial fibrillary acidic protein, C-terminal hydrolase-L1, neuron-specific enolase, tau protein, amyloid β, and fatty acid binding proteins [17–19]. However, most biomarker candidates have not yet been tested in appropriate clinical settings.
MicroRNAs (miRNAs) represent a category of functional single-stranded small RNAs ranging from 17 to 25 nucleotides in length. MiRNAs mediate the translational control of target genes and play an important role in the regulation of physiological and pathological processes [20, 21]. In 2008, Mitchell et al. found that miRNAs can exist in a stable form in the plasma, escaping ribonuclease degradation [22]. Using high-throughput detection techniques, miRNA profiles are specific to various physiological and pathological conditions, wherein lies their potential as diagnostic biomarkers [23]. MiRNAs have been reported to be specific and sensitive biomarkers in many central nervous system diseases [24]. In this study, we first investigated plasma miRNA expression profiles by using Agilent Human miRNA microarray techniques (miRBase V21.0). The expression profiles of a total of 2549 miRNAs were determined in five patients with mild TBI, five with moderate TBI, and five with severe TBI, within 24 hours of injury, as well as in five healthy volunteers (HVs). Next, some candidate biomarkers were selected for validation using a quantitative reverse transcription polymerase chain reaction (RT-qPCR) technique in an enlarged, separate and independent cohort with 25 subjects in each group, including patients with different degrees of TBI, as well as healthy volunteers. A receiver operating characteristic (ROC) curve was generated to evaluate the accuracy of these candidate miRNAs in diagnosing TBI.
Materials and methods
Participants
Patients were recruited from the Department of Neurosurgery, Affiliated Hospital of Logistics University of PAP, between March 2016 and March 2017. The inclusion criteria were as follows: 1) aged between 18 and 60 years, 2) diagnosed with TBI, and 3) injury had occurred within 24 hours of arrival at the emergency department. The exclusion criteria were as follows: 1) pregnant or nursing; 2) significant polytrauma that would interfere with follow-up and outcome assessment; 3) uncontrolled blood pressure and additional cardiovascular disease; 4) major substance abuse or alcoholism; and 5) major debilitating neurological diseases. Mild TBI included patients with a non-penetrating head trauma and GCS score ≥13, moderate TBI included those with a GCS score of 9–12, and severe TBI included those with a GCS score ≤8. This prospective cohort study was approved by the Logistics University of PAP Review Board prior to data collection. Written informed consent was obtained from all human subjects or from their legal authorized representatives prior to enrollment. All experiments were performed in accordance with relevant guidelines and approval from the Logistics University of PAP Review Board.
Plasma preparation and RNA isolation
The blood samples in ethylene diamine tetra-acetic acid anticoagulant tubes were processed for plasma isolation within 2 h of being drawn. Whole blood was centrifuged at 3000 rpm (1408 rcf) for 10 min at room temperature. Plasma was divided into aliquots and stored at -80°C.
Plasma RNA isolation was performed using the mirVanaTM PARISTM Serum/Plasma Kit (Ambion, Austin, TX, USA). The RNA quantity and quality were assessed using a NanoDrop ND-1000 (Thermo Fisher, Boston, MA, USA) and Agilent 2100 Bioanalyzer (Agilent Technologies, Santa Clara, CA, USA). We used 400 μL and 200 μL of plasma for RNA isolation in the miRNA microarray assay and the RT-qPCR validation experiment, respectively.
miRNA microarray analysis
Human miRNA microarrays from Agilent Technologies (Agilent SurePrint Human miRNA v21.0 microarray, G4872A) (Agilent Technologies, Santa Clara, CA, USA) were used in plasma samples. The total RNA (100 ng) derived from plasma samples was labelled with Cy3. The labelling and hybridization were performed according to the protocols in the Agilent miRNA microarray system. After hybridization, slides were scanned with the Agilent Microarray Scanner and raw data were normalized using the quantile algorithm in GeneSpring software 12.6.
Analysis of microarray data
Normalized data were obtained using the Quantile algorithm in the GeneSpring software program (version 11.0, Agilent Technologies), and these data were transformed to base 2. A relative fold change >2 in the differential expression of miRNAs and a P<0.05 were considered significant. The Gene Cluster (version 3.0) and Java Treeview software programs were used to perform the hierarchical cluster analysis of differentially expressed miRNAs and to visualize the miRNAs.
Quantitative reverse transcription polymerase chain reaction
For the testing of the candidate miRNAs acquired on microarrays, RT-qPCR was performed. The total RNA was reverse transcribed using the miRcute Plus miRNA First-Strand cDNA Synthesis Kit (Tiangen Biotech, Beijing, China) on a Proflex Base PCR System (Thermo Fisher Scientific, MA, USA). Real-time PCR reactions were performed on the PikoReal 96 (Thermo Scientific, MA, USA) in a 20-μL reaction volume containing 2 μL reverse transcription product, 10 μL 2×miRcute Plus miRNA Premix (with SYBR & ROX) (Tiangen Biotech), 0.4 μL PCR forward primer (5 μM, Tiangen Biotech), 0.4 μL reverse primer (10 μM, Tiangen Biotech), and 7.2 μL ddH2O. The reactions were incubated at 95°C for 15 min, followed by 40 cycles (94°C for 20 s and 60°C for 34 s). For the exogenous control, wascel-miR-39 was used; 1 μL of cel-miR-39 mimic (100 nM) was added into 200-μL plasma samples before RNA isolation. Each miRNA was calibrated against tocel-miR-39 to get a delta Ct (ΔCt) value for each miRNA (miRNA Ct value−cel-miR-39 Ct value). 2-ΔCt values in each group were used for the following statistical analysis. Expression fold changes were calculated busing the 2−ΔΔCt method.
miRNA target computational analysis
The target genes of differentially expressed miRNAs were predicted by the following three prediction databases: TargetScan (http://www.targetscan.org), miRanda (http://www.microrna.org/microrna/home.do), and PicTar (http://pictar.mdc-berlin.de/). The enrichment P-values of both the gene ontology (GO) analysis and the Kyoto Encyclopedia of Genes and Genomes (KEGG) pathway enrichment analysis were calculated using Fisher’s exact test, corrected by enrichment q-values (the false discovery rate) that were calculated using John Storey's method. The GO terms were identified in the biological process, cellular component, and molecular function categories. The KEGG database (http://www.genome.jp/kegg/tool/search_pathway.html) was used to map the predicted targets of the miRNAs.
Statistical analysis
Data are presented as mean ± standard deviation (SD). For the miRNA microarrays, the differences in miRNA abundance between HVs and TBI samples (background-adjusted, log2-transformed, balanced fluorescence values) as detected by microarray analysis were calculated, and changes between the signal intensities were evaluated using Student’s t-tests. For the RT-qRCR, 2-ΔCt values obtained from the RT-qPCR experiments in each group were used for the statistical analysis [25]. Data were compared using one-way analysis of variance (ANOVA) and Tukey’s post-hoc test, or an independent samples-test comparison between the HV, mild TBI, moderate TBI, and severe TBI groups. An ROC analysis was utilized to calculate sensitivity and specificity of each biomarker. All analyses were carried out on SPSS version 19.0, with P<0.05 considered statistically significant.
Results
Patient characteristics
The characteristics of the study participants are presented in Table 1. A total of 90 patients with TBI and 30 HVs were enrolled in this study. In the microarray groups, the miRNA profiles of the plasma samples from five subjects in each group were screened using a miRNA microassay. The sampling times in the mild, moderate, and severe TBI groups were 7.54±2.81, 6.08±0.79, and 6.16±1.19, respectively. There were no statistical differences between the groups. In the validation groups, separate and independent cohorts of 25 subjects in each group were enrolled for the validation of selected miRNAs. The sampling times in the mild, moderate, and severe TBI groups were 7.15±1.54, 7.38±1.60, and 6.60±1.63, respectively. There were no statistical differences between the groups.
Table 1. Clinical characteristics of the study subjects.
| Study group | Number of samples | Age [Mean±SD, (Range)] | Gender (M/F) | Sampling time (hours) | GCS | |
|---|---|---|---|---|---|---|
| Microarray group | HV | 5 | 45.2±8.9 (33–55) | 4/1 | ||
| Mild TBI | 5 | 41.4±9.3 (27–50) | 4/1 | 7.54±2.81 | 13.6±0.5 (13–14) | |
| Moderate TBI | 5 | 43.6±6.7 (35–50) | 3/2 | 6.08±0.79 | 10.0±1.0 (9–11) | |
| Severe TBI | 5 | 48.6±9.8 (32–52) | 4/1 | 6.16±1.19 | 4.4±1.5 (3–6) | |
| Validation group | HV | 25 | 39.7±9.3 (29–59) | 18/7 | ||
| Mild TBI | 25 | 44.9±10.9(24–60) | 16/9 | 7.15±1.54 | 13.7±0.5 (13–14) | |
| Moderate TBI | 25 | 46.0±8.8(27–60) | 19/6 | 7.38±1.60 | 10.6±1.0(9–12) | |
| Severe TBI | 25 | 45.4±8.0 (32–57) | 17/8 | 6.60±1.63 | 5.4±1.6(3–8) |
miRNA expression profiles
A microarray containing probes of 2549 human miRNAs was initially used to screen the significant differential expression levels of miRNAs between the groups with different degrees of TBI and the control group. After the normalization, the fold change for the plasma miRNAs in the mild, moderate, and severe TBI groups was calculated using healthy control subjects as the baseline. Compared with the healthy control group, 65, 33, and 16 miRNAs were upregulated, and 29, 27, and six miRNAs were downregulated in patients with mild, moderate, and severe TBI, respectively (S1–S3 Tables). Among these, 13 miRNAs (seven upregulated and six downregulated) were found to be present in all TBI groups (fold change >2, P<0.05) (Table 2, Fig 1). We also performed hierarchical clustering on the normalized data to understand the expression of the 13 common miRNAs between the groups. A clustering analysis showed segregated data suggesting different expressions of these 13 miRNAs across the healthy control and the TBI groups (Fig 2).
Table 2. Common miRNAs altered in plasma samples of mild, moderate and severe TBI patients.
| No. | miRNA | Mild vs control | Moderate vs control | Severe vs control | |||
|---|---|---|---|---|---|---|---|
| Fold change | p-value | Fold change | p-value | Fold change | p-value | ||
| 1 | hsa-miR-6867-5p | 3.28 | 1.36E-02 | 4.05 | 7.41E-03 | 4.32 | 6.29E-03 |
| 2 | hsa-miR-3665 | 3.24 | 2.58E-02 | 2.66 | 4.26E-02 | 3.56 | 2.14E-02 |
| 3 | hsa-miR-328-5p | 2.89 | 5.32E-03 | 2.30 | 1.85E-02 | 2.33 | 1.63E-02 |
| 4 | hsa-miR-762 | 2.72 | 6.99E-03 | 2.96 | 5.45E-03 | 2.39 | 1.22E-02 |
| 5 | hsa-miR-3195 | 2.54 | 1.24E-03 | 3.17 | 1.02E-02 | 3.23 | 6.05E-03 |
| 6 | hsa-miR-4669 | 2.40 | 3.23E-02 | 2.40 | 4.95E-02 | 2.75 | 4.13E-02 |
| 7 | hsa-miR-2861 | 2.19 | 2.83E-02 | 2.07 | 3.44E-02 | 2.13 | 3.23E-02 |
| 8 | hsa-miR-940 | 0.32 | 7.81E-03 | 0.32 | 1.01E-02 | 0.37 | 1.99E-02 |
| 9 | hsa-miR-1281 | 0.25 | 1.06E-03 | 0.24 | 9.00E-04 | 0.39 | 2.36E-02 |
| 10 | hsa-miR-1825 | 0.25 | 7.70E-03 | 0.29 | 1.11E-02 | 0.40 | 4.69E-02 |
| 11 | hsa-miR-4665-3p | 0.22 | 1.24E-03 | 0.21 | 9.69E-04 | 0.33 | 1.54E-02 |
| 12 | hsa-miR-4725-5p | 0.21 | 7.46E-03 | 0.26 | 1.24E-02 | 0.37 | 4.06E-02 |
| 13 | hsa-miR-1304-3p | 0.18 | 2.34E-03 | 0.26 | 5.00E-03 | 0.38 | 3.29E-02 |
Fig 1. MiRNA expression pattern.

Venn diagram shows overlapping different miRNAs in mild, moderate and severe TBI in comparison to health volunteers.
Fig 2. Hierarchical clustering of 13 common miRNAs altered in all TBI groups.

The Hierarchical clustering of hsa-miR-1281, hsa-miR-1304-3p, hsa-miR-1825, hsa-miR-2861, hsa-miR-3195, hsa-miR-328-5p, hsa-miR-3665, hsa-miR-4665-3p, hsa-miR-4669, hsa-miR-4725-5p, hsa-miR-6867-5p, hsa-miR-762 and hsa-miR-940 were conducted. The red and green colors in the heat map represent miRNA expression levels, respectively.
miRNA targets and gene ontology, pathway analysis of different miRNAs in different degree TBI groups
To understand the physiopathological roles of the different distributions of miRNAs in the plasma of patients with mild to severe TBI, GO and pathway enrichment analyses of predicted miRNA targets were conducted. We compared the top 15 biological processes of the GO analysis of miRNA targets in different TBI groups; the results showed that 10 biological processes were present in both the mild and moderate TBI group, which indicates similar physiopathological phenotypes. Different from these two TBI groups, only one biological process, the regulation of systemic arterial blood pressure by vasopressin, was present in the severe TBI group as well as the mild and moderate TBI groups. The other top 15 biological processes observed in the severe TBI group included synaptic vesicle clustering, somatic motor neuron differentiation, presynaptic active zone assembly, optic nerve morphogenesis, and noradrenergic neuron differentiation. These processes were more directly associated with neuron activity (Table 3).
Table 3. Gene ontology enrichment analysis of miRNA targets in different degree TBI groups (Top 15 processes were showed).
| No. | Mild | Moderate | Severe |
|---|---|---|---|
| 1 | somite specification | selenocysteine incorporation | synaptic vesicle clustering |
| 2 | selenocysteine incorporation | response to tumor cell | somatic motor neuron differentiation |
| 3 | ribosomal subunit export from nucleus | renin secretion into blood stream | regulation of systemic arterial blood pressure by vasopressin |
| 4 | ribosomal small subunit assembly | regulation of systemic arterial blood pressure by vasopressin | regulation of skeletal muscle contraction by calcium ion signaling |
| 5 | renin secretion into blood stream | regulation of systemic arterial blood pressure by carotid sinus baroreceptor feedback | regulation of protein heterodimerization activity |
| 6 | regulation of systemic arterial blood pressure by vasopressin | regulation of response to tumor cell | regulation of protein deubiquitination |
| 7 | regulation of systemic arterial blood pressure by carotid sinus baroreceptor feedback | positive regulation of receptor recycling | purine ribonucleosidebisphosphate biosynthetic process |
| 8 | regulation of glutamine family amino acid metabolic process | regulation of immune response to tumor cell | protein repair |
| 9 | regulation of germinal center formation | regulation of germinal center formation | presynaptic active zone assembly |
| 10 | regulation of dendritic cell cytokine production | regulation of dendritic cell cytokine production | positive thymic T cell selection |
| 11 | positive regulation of tolerance induction | positive regulation of tolerance induction | positive regulation of viral entry into host cell |
| 12 | positive regulation of receptor recycling | positive regulation of response to tumor cell | positive regulation of toll-like receptor 3 signaling pathway |
| 13 | positive regulation of neurotransmitter secretion | positive regulation of receptor recycling | Pointed-end actin filament capping |
| 14 | positive regulation of cytokine secretion involved in immune response | positive regulation of cytokine secretion involved in immune response | optic nerve morphogenesis |
| 15 | positive regulation of T cell tolerance induction | positive regulation of T cell tolerance induction | noradrenergic neuron differentiation |
The KEGG pathway is a service offered by the Kyoto Encyclopedia of Genes and Genomes, by constructing manually curated pathway maps that represent the current knowledge on biological networks in graph models [26]. A pathway enrichment analysis suggested that several pathways were present in all TBI groups, including the p53 signaling pathway, the mTOR signaling pathway, the TGF-β signaling pathway, SNARE interactions in vesicular transport, the nicotinate and nicotinamide metabolism, and the neurotrophin signaling pathway. Moreover, only two neurobiological pathways, pantothenate and CoA biosynthesis and long-term depression, were present in the top 15 pathways of the TBI groups (Table 4).
Table 4. KEGG pathway enrichment analysis of miRNA targets in different degree TBI groups (Top 15 pathways were showed).
| No. | Mild | Moderate | Severe |
|---|---|---|---|
| 1 | p53 signaling pathway | p53 signaling pathway | p53 signaling pathway |
| 2 | mTOR signaling pathway | mTOR signaling pathway | mTOR signaling pathway |
| 3 | mRNA surveillance pathway | TGF-beta signaling pathway | Thyroid cancer |
| 4 | TGF-beta signaling pathway | SNARE interactions in vesicular transport | TGF-beta signaling pathway |
| 5 | SNARE interactions in vesicular transport | Purine metabolism | Shigellosis |
| 6 | Pancreatic cancer | Phosphatidylinositol signaling system | SNARE interactions in vesicular transport |
| 7 | Pantothenate and CoA biosynthesis | Non-small cell lung cancer | Purine metabolism |
| 8 | Pancreatic cancer | Nicotinate and nicotinamide metabolism | Prostate cancer |
| 9 | Osteoclast differentiation | Neurotrophin signaling pathway | Phosphatidylinositol signaling system |
| 10 | One carbon pool by folate | Melanoma | Pancreatic cancer |
| 11 | Non-small cell lung cancer | Melanogenesis | Non-small cell lung cancer |
| 12 | Nicotinate and nicotinamide metabolism | Inositol phosphate metabolism | Nicotinate and nicotinamide metabolism |
| 13 | Neurotrophin signaling pathway | Hypertrophic cardiomyopathy (HCM) | Neurotrophin signaling pathway |
| 14 | Melanoma | Hedgehog signaling pathway | NOD-like receptor signaling pathway |
| 15 | Long-term depression | Glycosphingolipid biosynthesis—lacto and neolacto series | Melanoma |
Validation of candidate miRNAs
Next, we selected seven candidate miRNAs—miR-6867-5p, miR-3665, miR-328-5p, miR-762, miR-3195, miR-4669, and miR-2861—to validate their expressions using RT-qPCR. The microarray results showed that the plasma levels of these miRNAs were upregulated in all TBI groups (Table 2). A total of 100 separate and independent samples (25 in each group) were available for RT-qPCR analysis. We used cel-miR-39 as an exogenous control. The validation results showed significant upregulation of the miRNAs in all three TBI groups when compared to the HV samples, which is consistent with our miRNA microarray results (Fig 3). Moreover, the expression levels of miR-3195 and miR-328-5p were higher in the severe TBI group than in the mild and moderate TBI groups (Fig 3C & 3E). The expression levels of miR-6867-5p in the moderate and severe TBI groups were higher than those in the mild TBI group (Fig 3A).
Fig 3. Validation of candidate miRNAs by real time PCR.

A-G, The expression levels of 7 candidate miRNAs (miR-6867-5p, miR-3665, miR-328-5p, miR-762, miR-3195, miR-4669 and miR-2861) were validated by using real time PCR in aseparate and independentcohort of 25subjects in each group with different degree TBI patients and healthy volunteers. *represents compared with HV group, P<0.05; #represents compared with mild TBI group, P<0.05; Δ represents compared with moderate TBI group.
Diagnostic performance of miRNA candidates
Next, we evaluated the accuracy of the seven common upregulated miRNAs in diagnosing TBI. An ROC analysis was conducted to calculate the area under the curve (AUC) to identify the diagnostic accuracy of the miRNAs. The analysis revealed the following AUC values: miR-6867-5p (0.854, P<0.001), miR-3665 (0.877, P<0.001), miR-328-5p (0.888, P<0.001), miR-762 (0.916, P<0.001), miR-3195 (0.899, P<0.001), miR-4669 (0.907, P<0.001), and miR-2861 (0.913, P<0.001) (Fig 4). All miRNAs thus showed good diagnostic accuracy.
Fig 4. ROC curve analysis evaluates the diagnostic performance of the selected microRNA panels for distinguishing TBI from controls.
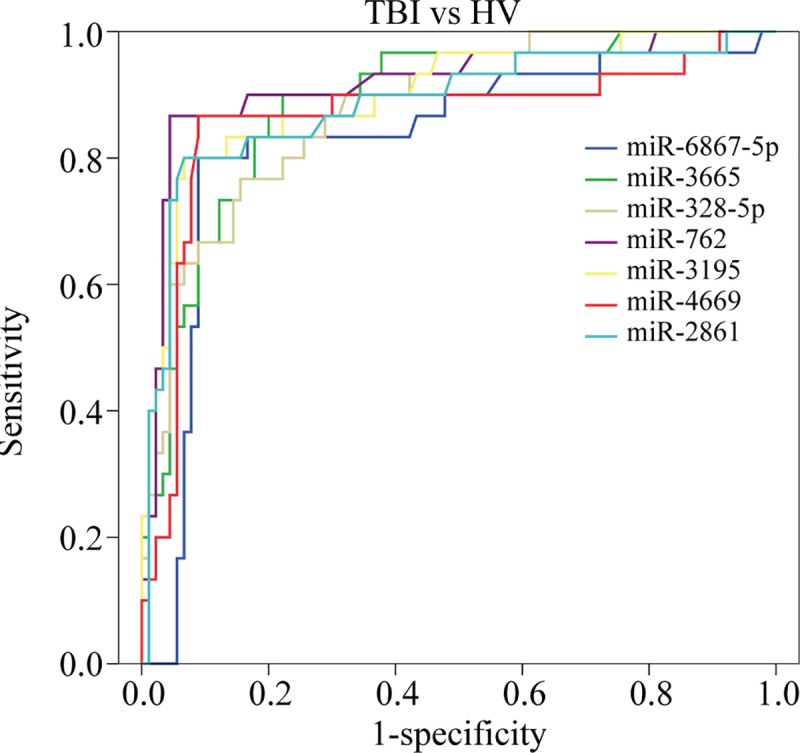
The Area Under roc Curve (AUC) values were as following: miR-6867-5p miR-6867-5p (0.854, P<0.001), miR-3665 (0.877, P<0.001), miR-328-5p (0.888, P<0.001), miR-762 (0.916, P<0.001), miR-3195 (0.899, P<0.001), miR-4669 (0.907, P<0.001), and miR-2861 (0.913, P<0.001).
Determination of diagnostic potential for candidate miRNAs for mild TBI
Since the ROC curve results indicated that candidate miRNAs have a good diagnostic potential for TBI, we next evaluated if these candidate miRNAs could be used to diagnose mild TBI. The analysis yielded the following AUC values: miR-6867-5p (0.765, P<0.001), miR-3665 (0.916, P<0.001), miR-328-5p (0.855, P<0.001), miR-762 (0.921, P<0.001), miR-3195 (0.859, P<0.001), miR-4669 (0.894, P<0.001), and miR-2861 (0.898, P<0.001) (Fig 5A–5G). Thus, while these miRNAs show fair diagnostic accuracy in identifying patients with mild TBI overall, miRNA-3665 and miR-762 show higher accuracy for diagnosing this group of patients.
Fig 5. ROC curve analysis evaluates the diagnostic performance of the selected microRNA panels for distinguishing mild TBI from controls.

A-G, The AUC values were as following: miR-6867-5p (0.765, P<0.001), miR-3665 (0.916, P<0.001), miR-328-5p (0.855, P<0.001), miR-762 (0.921, P<0.001), miR-3195 (0.859, P<0.001), miR-4669 (0.894, P<0.001), and miR-2861 (0.898, P<0.001).
Discussion
miRNAs are well-conserved in both plants and animals and are thought to be a vital and evolutionarily ancient component of gene regulation [27]. The human genome may encode over 2000 miRNAs, which are abundant in many mammalian cell types and appear to target more than 60% of the genes in humans and other mammals [27, 28]. Dysregulation of miRNAs has been shown to be associated with multiple diseases, such as cancer [29], heart disease [30], kidney disease [31], diabetes [32], nervous system diseases [33, 34], and other diseases. However, little research has focused on the roles of miRNAs in TBI. In this study, we evaluated the changes in circulating miRNA expression profiles in the plasma of patients with mild to severe TBI, using miRNA microarrays. The microarray analysis identified 94 miRNAs (65 upregulated, 29 downregulated) in mild TBI, 60 miRNAs (33 upregulated, 27 downregulated) in moderate TBI, and 22 miRNAs (16 upregulated, six downregulated) in severe TBI. Thirteen miRNAs (seven upregulated and six downregulated) were found to be present in all TBI groups.
Next, we focused on the common upregulated miRNAs in all (mild to severe) TBI groups, compared with the healthy control group, validated the changes by real-time PCR in an enlarged, separate, and independent cohort of 25 subjects in each group, and evaluated the diagnostic value of these miRNAs for TBI. The validation assay confirmed that the seven candidate miRNAs were upregulated in all TBI groups. A ROC curve analysis demonstrated that all seven miRNAs showed good diagnostic accuracy for distinguishing patients with TBI from healthy controls. Furthermore, the expression levels of hsa-miR-3195 and hsa-miR-328-5p were higher in the severe TBI group than in the mild and moderate groups, which indicates that these two miRNAs may also be utilized during diagnosis to distinguish mild and moderate TBI from severe TBI.
Sample quality is an important factor as many dysregulated miRNAs found in this study can be affected by factors such as hemolysis or platelet contamination. Numerous studies have shown that cellular contamination and hemolysis of plasma (and serum) samples can be a major cause of variation in miRNA levels not related to any biological difference [35, 36]. In the case of serum samples, clot formation can result in cell lysis and the lease of miRNA within blood cells and platelets. In the case of plasma samples, cells can be inadvertently aspirated during collection [37]. Thus, in this study, we focused on the alterations in miRNA expression profiles in the plasma samples of patients with TBI. To ensure the plasma sample quality, the samples were discarded if there was turbidity, precipitation, or hemolysis. Moreover, we did not aspirate about 50 μL of plasma after centrifugation, to avoid contamination of the cells.
To date, several studies have reported on different miRNA expression after TBI. Some altered miRNAs found in our study showed an overlap with these reports. Bhomia et al. evaluated the serum miRNA expression profile in patients with mild to severe TBI by using TaqMan real-time PCR, and then validated candidate biomarkers. They showed that 10 miRNAs were present in both the mild and moderate as well as the severe TBI group. Among these miRNAs, both our study and Bhomia et al.’s study found upregulation of hsa-miR-328 in all TBI groups. An advanced validation assay showed higher expressions of hsa-miR-328 in the severe TBI group than in the mild and moderate TBI groups. Moreover, five upregulated miRNAs in mild TBI—hsa-miR-20a-5, hsa-miR-27a-3p, hsa-miR-30d-5p, hsa-miR-451a, and hsa-miR-92a-3p were found in both our study and Bhomia et al.’s study [38]. Another study also tested the upregulation of the plasma levels of hsa-miR-92a within the first 24 h after TBI injury [39]. Interestingly, Pietro and colleagues evaluated serum miRNA expression profiles in patients with severe TBI by using the TaqMan low-density array, and then validated candidate biomarkers for mild and severe TBI. They found that hsa-miR-425-5p was significantly downregulated in mild TBI at 0–12 h and returned to normal levels after 48 h [7]. However, our microarray results differed from these findings in that they showed that hsa-miR-425-5p was upregulated in mild TBI (S1 Table). Further validation studies must be conducted to verify the dynamic changes of this miRNA in TBI.
It has been demonstrated that circulating miRNAs can be enwrapped with exosomes or microvesicles and transferred from one cell to another through the exchange of exosomes [22, 40]. These vesicle-enwrapped circulating miRNAs may function as an intercellular communication system in the body [41]. We explored the underlying biological function of changed plasma miRNAs in patients with different degrees of TBI. A GO analysis of miRNA targets showed that only one biological process, the regulation of systemic arterial blood pressure by vasopressin, was present in the top 15 biological processes of all three TBI groups. It has been reported that systemic hypotension can compromise cerebral hemodynamics and cause cerebral ischemia after TBI [42]; lower mean arterial blood pressure has been considered an independent prognostic factor in patients with TBI [43]. Guidelines provided by the Brain Trauma Foundation for the management of TBI recommend avoiding hypotension by maintaining cerebral perfusion pressure [44]. In addition to the regulation of systemic arterial blood pressure by vasopressin, there were two biological processes—renin secretion into the bloodstream and regulation of systemic arterial blood pressure by carotid sinus baroreceptor feedback—in the top 15 biological processes of the mild and moderate TBI groups. This indicates that miRNAs may participate in the regulation of systemic arterial blood pressure after TBI.
More evidence supports that immune system activation and inflammation are central mediators of secondary injury after brain trauma [45]. TBI often promotes the disruption of the blood-brain barrier, thereby induces damage-associated molecular patterns to be released into both the CSF and serum, and triggers the inflammatory response after TBI [45, 46]. Our study identifies four inflammation-related processes in the top 15 biological processes of the mild and moderate TBI groups, including positive regulation of the induction of tolerance, regulation of dendritic cell cytokine production, positive regulation of cytokine secretions involved in the immune response, and positive regulation of the induction of T cell tolerance. However, two different inflammation-related processes—positive regulation of the toll-like receptor 3 signaling pathway, and positive thymic T cell selection—were present in the top 15 biological processes of the severe TBI groups. These results indicate that inflammatory responses differ between patients with mild, moderate, and severe TBI. Moreover, the GO analysis of miRNA target genes showed that five neurobiological processes were present in the top 15 biological processes of the severe TBI group that were positively correlated with the severity of TBI in these patients.
The KEGG pathway enrichment analysis showed that six pathways were present in all TBI groups (Table 4). Among these pathways, the p53 signaling pathway, mTOR signaling pathway, and TGF-β signaling pathway have been reported to be activated in TBI and involved in inflammation and apoptosis [47–49]. Inhibition of these three pathways showed a neuroprotective effect in TBI [49–51]. SNARE proteins are a large protein superfamily that mediates the docking of synaptic vesicles with the presynaptic membrane in neurons. Impaired SNARE complex formation was reported after TBI [52]. Goffus et al. showed that sustained delivery of nicotinamide could limit cortical injury and improve functional recovery following TBI [53]. Neurotrophins, including BDNF, NT-3, NT-4, and NGF, play an active role in the development, maintenance, and survival of the cells of the central nervous system. Several studies support that neurotrophins could protect hippocampal neurons and restore neural connectivity following TBI [54, 55]. The pathway enrichment analysis results thus demonstrate that the changes in serum miRNAs may participate in the process of TBI by regulating these pathways.
In summary, a cohort of seven plasma miRNAs identified in our study can be used as acute biomarkers of TBI. Two miRNAs in particular, miR-3195 and miR-328-5p, may be utilized during diagnosis to distinguish mild and moderate TBI from severe TBI. Further studies will be needed to identify the functions and roles of these candidate miRNAs in TBI.
Supporting information
(DOCX)
(DOCX)
(DOCX)
Acknowledgments
This work is supported by Natural Science Foundation of China (81471823). We would like to thank Department of Neurosurgery, Affiliated Hospital of Logistic University of PAP, for their help on the collection of TBI patients’ plasma samples.
Data Availability
All relevant data are within the paper and its Supporting Information files.
Funding Statement
This work is supported by Natural Science Foundation of China (81471823) (YZ).
References
- 1.Cheng P, Yin P, Ning P, Wang L, Cheng X, Liu Y, et al. Trends in traumatic brain injury mortality in China, 2006–2013: A population-based longitudinal study. PLoS medicine. 2017;14(7):e1002332 10.1371/journal.pmed.1002332 ; PMCID: PMC5507407. [DOI] [PMC free article] [PubMed] [Google Scholar]
- 2.Liu B. Current status and development of traumatic brain injury treatments in China. Chin J Traumatol. 2015;18(3):135–6. 10.1016/j.cjtee.2015.04.002 [DOI] [PubMed] [Google Scholar]
- 3.De Guzman E, Ament A. Neurobehavioral Management of Traumatic Brain Injury in the Critical Care Setting: An Update. Crit Care Clin. 2017;33(3):423–40. 10.1016/j.ccc.2017.03.011 [DOI] [PubMed] [Google Scholar]
- 4.Teasdale G, Maas A, Lecky F, Manley G, Stocchetti N, Murray G. The Glasgow Coma Scale at 40 years: standing the test of time. The Lancet Neurology. 2014;13(8):844–54. 10.1016/S1474-4422(14)70120-6 [DOI] [PubMed] [Google Scholar]
- 5.Maegele M, Schöchl H, Menovsky T, Maréchal H, Marklund N, Buki A, Stanworth S. Coagulopathy and haemorrhagic progression in traumatic brain injury: advances in mechanisms, diagnosis, and management. Lancet Neurol. 2017;16(8):630–47. 10.1016/S1474-4422(17)30197-7 [DOI] [PubMed] [Google Scholar]
- 6.Levin HS, Diaz-Arrastia RR. Diagnosis, prognosis, and clinical management of mild traumatic brain injury. Lancet Neurol. 2015;14(5):506–17. 10.1016/S1474-4422(15)00002-2 [DOI] [PubMed] [Google Scholar]
- 7.Di Pietro V, Ragusa M, Davies D, Su Z, Hazeldine J, Lazzarino G, et al. MicroRNAs as Novel Biomarkers for the Diagnosis and Prognosis of Mild and Severe Traumatic Brain Injury. Journal of neurotrauma. 2017;34(11):1948–56. 10.1089/neu.2016.4857 . [DOI] [PubMed] [Google Scholar]
- 8.Borrebaeck CA. Precision diagnostics_ moving towards protein biomarker signatures of clinical utility in cancer. Nat Rev Cancer. 2017;17(3):199–204. 10.1038/nrc.2016.153 [DOI] [PubMed] [Google Scholar]
- 9.Tonkin AM, Blankenberg S, Kirby A, Zeller T, Colquhoun DM, Funke-Kaiser A, et al. Biomarkers in stable coronary heart disease, their modulation and cardiovascular risk: The LIPID biomarker study. Int J Cardiol. 2015;201:499–507. 10.1016/j.ijcard.2015.07.080 [DOI] [PubMed] [Google Scholar]
- 10.Ma L, Zhang XQ, Zhou DX, Cui Y, Deng LL, Yang T, et al. Feasibility of urinary microRNA profiling detection in intrahepatic cholestasis of pregnancy and its potential as a non-invasive biomarker. Scientific reports. 2016;6:31535 10.1038/srep31535 ; PMCID: PMC4989235. [DOI] [PMC free article] [PubMed] [Google Scholar]
- 11.van Hooij A, Tjon Kon Fat EM, Richardus R, van den Eeden SJ, Wilson L, de Dood CJ, et al. Quantitative lateral flow strip assays as User-Friendly Tools To Detect Biomarker Profiles For Leprosy. Scientific reports. 2016;6:34260 10.1038/srep34260 ; PMCID: PMC5041085. [DOI] [PMC free article] [PubMed] [Google Scholar]
- 12.Xiong SD, Pu LF, Wang HP, Hu LH, Ding YY, Li MM, et al. Neutrophil CD64 Index as a superior biomarker for early diagnosis of infection in febrile patients in the hematology department. Clin Chem Lab Med. 2017;55(1):82–90. 10.1515/cclm-2016-0118 [DOI] [PubMed] [Google Scholar]
- 13.Califf RM. Biomarker definitions and their applications. Exp Biol Med (Maywood). 2018;243(3):213–21. 10.1177/1535370217750088 ; PMCID: PMCPMC5813875. [DOI] [PMC free article] [PubMed] [Google Scholar]
- 14.FDA-NIH Biomarker Working Group. BEST (Biomarkers, EndpointS, and other Tools) Resource. Silver Spring (MD): Food and Drug Administration (US); Bethesda (MD): National Institutes of Health(US). www.ncbi.nlm.nih.gov/books/NBK326791/ [PubMed]
- 15.Zetterberg H, Blennow K. Fluid biomarkers for mild traumatic brain injury and related conditions. Nature reviews Neurology. 2016;12(10):563–74. 10.1038/nrneurol.2016.127 . [DOI] [PubMed] [Google Scholar]
- 16.Bogoslovsky T, Gill J, Jeromin A, Davis C, Diaz-Arrastia R. Fluid Biomarkers of Traumatic Brain Injury and Intended Context of Use. Diagnostics. 2016;6(4):e37 10.3390/diagnostics6040037 ; PMCID: PMC5192512. [DOI] [PMC free article] [PubMed] [Google Scholar]
- 17.Adrian H, Marten K, Salla N, Lasse V. Biomarkers of Traumatic Brain Injury: Temporal Changes in Body Fluids. eNeuro. 2016;3(6):e0294 10.1523/ENEURO.0294-16.2016 ; PMCID: PMC5175263. [DOI] [PMC free article] [PubMed] [Google Scholar]
- 18.Dash PK, Zhao J, Hergenroeder G, Moore AN. Biomarkers for the diagnosis, prognosis, and evaluation of treatment efficacy for traumatic brain injury. Neurotherapeutics. 2010;7(1):100–14. 10.1016/j.nurt.2009.10.019 [DOI] [PMC free article] [PubMed] [Google Scholar]
- 19.Thelin EP, Nelson DW, Bellander BM. A review of the clinical utility of serum S100B protein levels in the assessment of traumatic brain injury. Acta neurochirurgica. 2017;159(2):209–25. 10.1007/s00701-016-3046-3 ; PMCID: PMC5241347. [DOI] [PMC free article] [PubMed] [Google Scholar]
- 20.van Rooij E. The art of microRNA research. Circulation research. 2011;108(2):219–34. 10.1161/CIRCRESAHA.110.227496 . [DOI] [PubMed] [Google Scholar]
- 21.Ambros V. The functions of animal microRNAs. Nature. 2004;431(7006):350–5. 10.1038/nature02871 [DOI] [PubMed] [Google Scholar]
- 22.Mitchell PS, Parkin RK, Kroh EM, Fritz BR, Wyman SK, Pogosova-Agadjanyan EL, et al. Circulating microRNAs as stable blood-based markers for cancer detection. Proceedings of the National Academy of Sciences of the United States of America. 2008;105(30):10513–8. 10.1073/pnas.0804549105 ; PMCID: PMC2492472. [DOI] [PMC free article] [PubMed] [Google Scholar]
- 23.Chen X, Ba Y, Ma L, Cai X, Yin Y, Wang K, et al. Characterization of microRNAs in serum: a novel class of biomarkers for diagnosis of cancer and other diseases. Cell Res. 2008;18(10):997–1006. 10.1038/cr.2008.282 . [DOI] [PubMed] [Google Scholar]
- 24.Jin XF, Wu N, Wang L, Li J. Circulating microRNAs: a novel class of potential biomarkers for diagnosing and prognosing central nervous system diseases. Cell Mol Neurobiol. 2013;33(5):601–13. 10.1007/s10571-013-9940-9 [DOI] [PMC free article] [PubMed] [Google Scholar]
- 25.Schmittgen TD, Livak KJ. Analyzing real-time PCR data by the comparative CT method. Nature Protocols. 2008;3(6):1101–8. 10.1038/nprot.2008.73 [DOI] [PubMed] [Google Scholar]
- 26.Kanehisa M, Furumichi M, Tanabe M, Sato Y, Morishima K. KEGG: new perspectives on genomes, pathways, diseases and drugs. Nucleic acids research. 2017;45(D1):D353–D61. 10.1093/nar/gkw1092 ; PMCID: PMC5210567. [DOI] [PMC free article] [PubMed] [Google Scholar]
- 27.Chen K, Rajewsky N. The evolution of gene regulation by transcription factors and microRNAs. Nat Rev Genet. 2007;8(2):93–103. 10.1038/nrg1990 [DOI] [PubMed] [Google Scholar]
- 28.Friedman RC, Farh KK, Burge CB, Bartel DP. Most mammalian mRNAs are conserved targets of microRNAs. Genome research. 2009;19(1):92–105. 10.1101/gr.082701.108 ; PMCID: PMC2612969. [DOI] [PMC free article] [PubMed] [Google Scholar]
- 29.Di Leva G, Garofalo M, Croce CM. MicroRNAs in cancer. Annual review of pathology. 2014;9:287–314. 10.1146/annurev-pathol-012513-104715 ; PMCID: PMC4009396. [DOI] [PMC free article] [PubMed] [Google Scholar]
- 30.Ikeda S KS, Lu J, Bisping E, Zhang H, Allen PD, Golub TR, Pieske B, Pu WT. Altered microRNA expression in human heart disease. Physiol Genomics. 2007;31(3):367–73. 10.1152/physiolgenomics.00144.2007 [DOI] [PubMed] [Google Scholar]
- 31.Khella HW, Bakhet M, Lichner Z, Romaschin AD, Jewett MA, Yousef GM. MicroRNAs in kidney disease: an emerging understanding. Am J Kidney Dis. 2013;61(5):798–808. 10.1053/j.ajkd.2012.09.018 [DOI] [PubMed] [Google Scholar]
- 32.Chen H, Lan HY, Roukos DH, Cho WC. Application of microRNAs in diabetes mellitus. J Endocrinol. 2014;222(1):R1–R10. 10.1530/JOE-13-0544 [DOI] [PubMed] [Google Scholar]
- 33.DA O. MicroRNA and diseases of the nervous system. Neurosurgery. 2011;69(2):440–54. 10.1227/NEU.0b013e318215a3b3 [DOI] [PubMed] [Google Scholar]
- 34.Witwer KW, Sarbanes SL, Liu J, Clements JE. A plasma microRNA signature of acute lentiviral infection: biomarkers of central nervous system disease. Aids. 2011;25(17):2057–67. 10.1097/QAD.0b013e32834b95bf ; PMCID: PMC3703743. [DOI] [PMC free article] [PubMed] [Google Scholar]
- 35.McDonald JS, Milosevic D, Reddi HV, Grebe SK, Algeciras-Schimnich A. Analysis of circulating microRNA: preanalytical and analytical challenges. Clin Chem. 2011;57(6):833–40. Epub 2011/04/14. 10.1373/clinchem.2010.157198 . [DOI] [PubMed] [Google Scholar]
- 36.Pizzamiglio S, Zanutto S, Ciniselli CM, Belfiore A, Bottelli S, Gariboldi M, et al. A methodological procedure for evaluating the impact of hemolysis on circulating microRNAs. Oncol Lett. 2017;13(1):315–20. Epub 2017/01/27. 10.3892/ol.2016.5452 ; PMCID: PMC5244842. [DOI] [PMC free article] [PubMed] [Google Scholar]
- 37.Foye C, Yan IK, David W, Shukla N, Habboush Y, Chase L, et al. Comparison of miRNA quantitation by Nanostring in serum and plasma samples. PLoS One. 2017;12(12):e0189165 Epub 2017/12/07. 10.1371/journal.pone.0189165 ; PMCID: PMC5718466. [DOI] [PMC free article] [PubMed] [Google Scholar]
- 38.Bhomia M, Balakathiresan NS, Wang KK, Papa L, Maheshwari RK. A Panel of Serum MiRNA Biomarkers for the Diagnosis of Severe to Mild Traumatic Brain Injury in Humans. Scientific reports. 2016;6:28148 10.1038/srep28148 ; PMCID: PMC4919667. [DOI] [PMC free article] [PubMed] [Google Scholar]
- 39.Redell JB, Moore AN, Ward NH 3rd, Hergenroeder GW, Dash PK. Human traumatic brain injury alters plasma microRNA levels. Journal of neurotrauma. 2010;27(12):2147–56. 10.1089/neu.2010.1481 . [DOI] [PMC free article] [PubMed] [Google Scholar]
- 40.Valadi H, Ekstrom K, Bossios A, Sjostrand M, Lee JJ, Lotvall JO. Exosome-mediated transfer of mRNAs and microRNAs is a novel mechanism of genetic exchange between cells. Nature cell biology. 2007;9(6):654–9. 10.1038/ncb1596 . [DOI] [PubMed] [Google Scholar]
- 41.Sohel MH. Extracellular/Circulating MicroRNAs: Release Mechanisms, Functions and Challenges. Achievements in the Life Sciences. 2016;10(2):175–86. 10.1016/j.als.2016.11.007 [DOI] [Google Scholar]
- 42.Jünger EC, Newell DW, Grant GA, Avellino AM, Ghatan S, Douville CM, et al. Cerebral autoregulation following minor head injury. J Neurosurg. 1997;86(3):425–32. 10.3171/jns.1997.86.3.0425 [DOI] [PubMed] [Google Scholar]
- 43.Saadat S, Akbari H, Khorramirouz R, Mofid R, Rahimi-Movaghar V. Determinants of mortality in patients with traumatic brain injury. Ulusal travma ve acil cerrahi dergisi = Turkish journal of trauma & emergency surgery: TJTES. 2012;18(3):219–24. 10.5505/tjtes.2012 . [DOI] [PubMed] [Google Scholar]
- 44.Brain Trauma Foundation; American Association of Neurological Surgeons; Congress of Neurological Surgeons. Guidelines for the management of severe traumatic brain injury. J Neurotrauma. 2007;24 Suppl 1:S1–106. [DOI] [PubMed] [Google Scholar]
- 45.Inflammation Balu R. and immune system activation after traumatic brain injury. Current neurology and neuroscience reports. 2014;14(10):484 10.1007/s11910-014-0484-2 . [DOI] [PubMed] [Google Scholar]
- 46.Corps KN, Roth TL, McGavern DB. Inflammation and neuroprotection in traumatic brain injury. JAMA neurology. 2015;72(3):355–62. 10.1001/jamaneurol.2014.3558 ; PMCID: PMC5001842. [DOI] [PMC free article] [PubMed] [Google Scholar]
- 47.Napieralski JA, Raghupathi R, McIntosh TK. The tumor-suppressor gene, p53, is induced in injured brain regions following experimental traumatic brain injury. Brain Res Mol Brain Res. 1999;71(1):78–86. [DOI] [PubMed] [Google Scholar]
- 48.Chen S, Atkins CM, Liu CL, Alonso OF, Dietrich WD, Hu BR. Alterations in mammalian target of rapamycin signaling pathways after traumatic brain injury. J Cereb Blood Flow Metab. 2007;27(5):939–49. 10.1038/sj.jcbfm.9600393 [DOI] [PubMed] [Google Scholar]
- 49.Patel RK, Prasad N, Kuwar R, Haldar D, Abdul-Muneer PM. Transforming growth factor-beta 1 signaling regulates neuroinflammation and apoptosis in mild traumatic brain injury. Brain Behav Immun. 2017;64:244–58. 10.1016/j.bbi.2017.04.012 [DOI] [PubMed] [Google Scholar]
- 50.Erlich S, Alexandrovich A, Shohami E, Pinkas-Kramarski R. Rapamycin is a neuroprotective treatment for traumatic brain injury. Neurobiology of disease. 2007;26(1):86–93. 10.1016/j.nbd.2006.12.003 . [DOI] [PubMed] [Google Scholar]
- 51.Xue L, Yang SY. The protective effect of p53 antisense oligonucleotide against neuron apoptosis secondary to traumatic brain injury. Zhonghua Wai Ke Za Zhi. 2004;42(4):236–9. [PubMed] [Google Scholar]
- 52.Carlson SW, Yan H, Ma M, Li Y, Henchir J, Dixon CE. Traumatic Brain Injury Impairs Soluble N-Ethylmaleimide-Sensitive Factor Attachment Protein Receptor Complex Formation and Alters Synaptic Vesicle Distribution in the Hippocampus. Journal of neurotrauma. 2016;33(1):113–21. 10.1089/neu.2014.3839 ; PMCID: PMC4700396. [DOI] [PMC free article] [PubMed] [Google Scholar]
- 53.Goffus AM, Anderson GD, Hoane M. Sustained delivery of nicotinamide limits cortical injury and improves functional recovery following traumatic brain injury. Oxid Med Cell Longev. 2010;2(3):145–52. [DOI] [PMC free article] [PubMed] [Google Scholar]
- 54.Kaplan GB, Vasterling JJ, Vedak PC. Brain-derived neurotrophic factor in traumatic brain injury, post-traumatic stress disorder, and their comorbid conditions: role in pathogenesis and treatment. Behavioural pharmacology. 2010;21(5–6):427–37. 10.1097/FBP.0b013e32833d8bc9 . [DOI] [PubMed] [Google Scholar]
- 55.Royo NC, LeBold D, Magge SN, Chen I, Hauspurg A, Cohen AS, et al. Neurotrophin-mediated neuroprotection of hippocampal neurons following traumatic brain injury is not associated with acute recovery of hippocampal function. Neuroscience. 2007;148(2):359–70. 10.1016/j.neuroscience.2007.06.014 ; PMCID: PMC2579330. [DOI] [PMC free article] [PubMed] [Google Scholar]
Associated Data
This section collects any data citations, data availability statements, or supplementary materials included in this article.
Supplementary Materials
(DOCX)
(DOCX)
(DOCX)
Data Availability Statement
All relevant data are within the paper and its Supporting Information files.