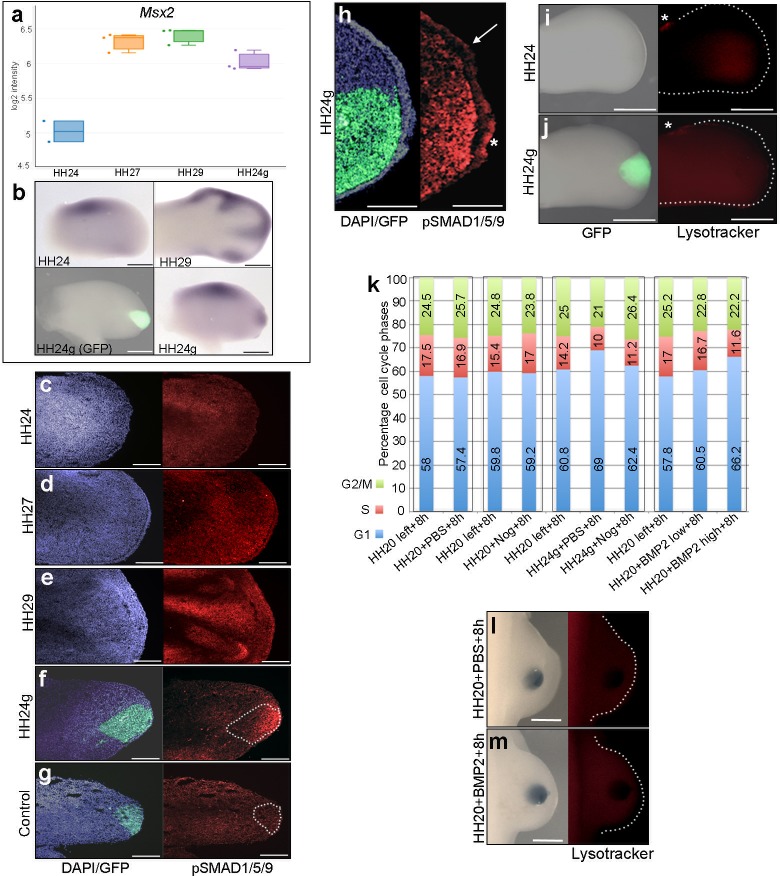
Figure 3. BMP signalling in HH24g mesenchyme.
(a) Expression levels of Msx2 determined by RNA-seq. (b) In situ hybridization showing Msx2 expression - note intense expression in HH24g mesenchyme in grafted area (n = 3/4). (c–h) Immunostaining of pSMAD1/5/9: signal increases in the distal part of chick wing buds over time (c–e) and is enhanced in HH24g mesenchyme (f) compared to contralateral HH24 buds (n = 3/3 c) but not in HH20-HH20 grafts (n = 2/2 g); signal is enhanced in apical ectodermal ridge above grafts in HH24g mesenchyme (asterisk-h) but not adjacent regions of ridge (n = 2/2 - arrow-h). (i–j) Lysotracker staining of apoptotic cells reveals no difference in HH24 (i) and HH24g (j) mesenchyme (n = 5/5) – asterisks indicate anterior necrotic zone. (k) Flow cytometry of wing bud distal mesenchyme: PBS- and Noggin-soaked beads do not significantly affect proportion of cells in G1-phase after 8 hr compared to left wing controls (Pearson’s χ2 test – p=0.1 and p=0.4, respectively); Noggin-soaked beads implanted at HH20 (+Nog) produce a significant decrease in proportion of cells in G1-phase in HH24g grafts compared to PBS-treated controls (+PBS) after 8 hr (Pearson’s χ2 test - p<0.0001); BMP2-soaked beads implanted at HH20 significantly increase G1-phase cells after 8 hr compared to left wing controls (Pearson’s χ2 test - p<0.0001), note boxes indicate separate experiments. (l–m) Lysotracker staining of apoptotic cells reveals no difference in PBS (l) - n = 2/2) and BMP2 (m) - n = 2/2) treated mesenchyme after 8 hr. Scale bars: HH24 buds - 500 μm, HH29 buds - 200 μm in b; 150 μm in c-g; 75 μm in h; 300 μm in i-j and l-m.

