

Abstract
RNAs directly regulate a vast array of cellular processes, emphasizing the need for robust approaches to fluorescently label and track RNAs in living cells. Here, we develop an RNA imaging platform using the cobalamin riboswitch as an RNA tag and a series of probes containing cobalamin as a fluorescence quencher. This highly modular ‘Riboglow’ platform leverages different colored fluorescent dyes, linkers and riboswitch RNA tags to elicit fluorescent turn-on upon binding RNA. We demonstrate the ability of two different Riboglow probes to track mRNA and small non-coding RNA in live mammalian cells. A side-by-side comparison revealed that Riboglow outperformed the dye binding aptamer Broccoli and performed on par with the gold standard RNA imaging system, the MS2-fluorescent protein system, while featuring a much smaller RNA tag. Together, the versatility of the Riboglow platform and ability to track diverse RNAs suggest broad applicability for a variety of imaging approaches.
Introduction
The complex spatiotemporal dynamics of messenger RNAs (mRNAs) and non-coding RNAs (ncRNAs) affect virtually all aspects of cellular function. RNAs associate with a large group of RNA binding proteins that dynamically modulate RNA localization and function1. Such RNA-protein interactions govern mRNA processing, export from the nucleus, and assembly into translationally competent messages, as well as association into large macromolecular granules that are not translationally active, including processing bodies (P-bodies) and stress granules (SGs)2,3. Similarly, uridine-rich small nuclear RNAs (U snRNAs, the RNA components of the spliceosome) dynamically associate with protein components to comprise the functional spliceosomal complex in the nucleus4. During stress, such as nutrient deprivation or bacterial infection, U snRNAs along with the splicing machinery can be transiently sequestered in cytosolic foci called U-bodies5. Given the intricate connection between RNA localization, dynamics and function, there has been a strong push to develop tools for visualization of RNA in live cells to elucidate mechanisms underlying dynamics of the mRNA and ncRNA life-cycle.
While there is a broad spectrum of tools to fluorescently tag proteins in live cells, fewer approaches for live cell imaging of RNA exist. The most common system employs multimer RNA tags that bind an RNA-binding protein (MS2 or PP7 coat protein) fused to a fluorescent protein (FP)6,7. The tag is genetically fused to an RNA of interest and binding of MS2-FP concentrates the fluorescence signal on the RNA. One limitation of this approach is that many copies of the MS2 RNA tag are required to enhance fluorescence contrast, and the large size of the RNA tag bound to MS2-FP complexes (Supplementary Table 1) can perturb localization, dynamics and processing8,9 of the RNA. Still, this system is the gold standard in live cell RNA imaging as it has been used successfully to interrogate mRNA dynamics over time at the single molecule level6,10,11. An alternative approach involves fluorogenic dye-binding aptamers that give rise to a turn-on fluorescence signal when the dye binds the aptamer12–16. While numerous proof-of-principle aptamers have been developed, only the Spinach17, Broccoli18 and Mango19,20 aptamers have been used in live mammalian cells. These dye-binding aptamers have been used to visualize highly expressed RNA polymerase III-dependent transcripts such as 5S and U6 RNA20–22. However, there are no reports of dye-binding aptamers being used to detect RNA polymerase-II dependent transcripts such as mRNAs, snRNAs, or microRNAs.
Here, we introduce a new approach for fluorescent tagging of RNA in live cells using a bacterial riboswitch as the RNA tag and a series of small molecular probes that undergo fluorescence turn-on upon binding the RNA tag. We took advantage of the robust folding of bacterial riboswitches in different genetic contexts in cells23,24, while exploiting specific binding of the riboswitch RNA to its natural ligand, cobalamin (Cbl (1))25. Cbl is an efficient fluorescence quencher when covalently coupled to a synthetic fluorophore26–28. We developed a series of Cbl-fluorophore probes that result in fluorescence turn-on upon binding of Cbl to the RNA tag (Fig. 1a) and demonstrate the ability of this system to track recruitment of mRNA to stress granules and the small non-coding U1 RNA to cytosolic U-bodies in live mammalian cells.
Figure 1.
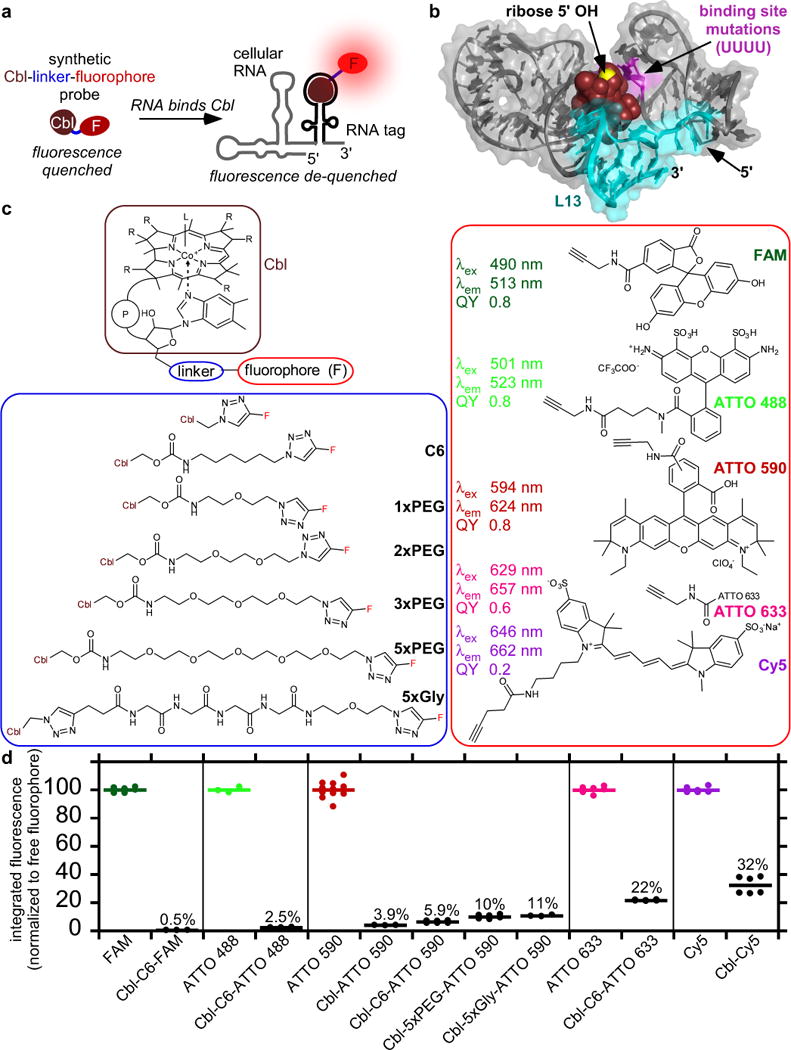
Covalent attachment of fluorophores to Cobalamin (Cbl) results in fluorescence quenching, inducing fluorescence turn-on of the probe upon binding to riboswitch RNA. (a) Principle of RNA-induced fluorescence turn-on for Cbl-fluorophore probes. Cbl (brown) acts as a quencher for the covalently attached fluorophore (red) due to proximity. Upon RNA binding, Cbl is sterically separated from the fluorophore, resulting in de-quenching and fluorescence turn-on. (b) Structure of Cbl riboswitch RNA (variant A) bound to Cbl25. Loop P13 (teal) is at the 3′-end. Cbl is shown in brown spheres and the 5′- hydroxyl residues at the ribose moiety is shown in yellow. Four bases that were mutated to UUUU to abolish binding to Cbl in variant AT,MUT are shown in magenta. (c) Synthetic Cbl-fluorophore probes. The organic linker was attached at the 5′- hydroxyl of the ribose and conjugated to alkyne variants of commercially available fluorophores via click chemistry, resulting in the triazole linkage between linker and fluorophore. Note that ATTO 590 is a mixture of para and meta isomers and the structure of ATTO 633 is proprietary. (d) Comparison of the fluorescence intensity of fluorophore vs. Cbl-fluorophore probes. Fluorescence spectra of 5 μM free fluorophores or Cbl-fluorophore probes were collected, the integrated intensity for each free fluorophore was set to 100% and the value for the Cbl-fluorophore probe was normalized relative to that of the corresponding fluorophore. Data are the mean for n=6, 6, 3, 3, 12, 3, 9, 6, 3, 6, 6, 6, 6 (datasets from left to right) independent measurements.
Results
Design of Cbl-fluorophore probes
The Cbl riboswitch consists of the aptamer (Cbl-binding domain) and expression platform. Variants of both the full-length riboswitch sequence and the shorter aptamer domain were used (Supplementary Fig. 1, Supplementary Table 2), collectively referred to as the ‘riboswitch RNA tag’ in this study. The crystal structure of Cbl bound to the aptamer revealed that the Cbl 5′-hydroxyl group is accessible in the RNA-bound state25 (Fig. 1b), prompting us to use this site for fluorophore conjugation via copper catalyzed alkyne-azide cycloaddition reaction29,30 (Fig. 1c).
To assess how different fluorophores affect quenching, we synthesized a series of probes with different fluorophores conjugated to Cbl via a 6-carbon chain (C6) (Supplementary Note, Supplementary Fig. 2). The fluorescence of each probe was measured and compared to that of the free fluorophore (Fig. 1d). Cbl-C6-FAM (2) and Cbl-C6-ATTO 488 (3) retained only 0.5% and 2.5% fluorescence respectively, indicating that quenching was highly efficient for probes with green fluorophores. In contrast, red and far red probes retained more fluorescence (5.9% for Cbl-C6-ATTO 590 (4), 22% for Cbl-C6-ATTO 633 (5) and 32% for Cbl-Cy5 (6)), corresponding to moderate quenching (Fig. 1d). These results reveal a correlation between quenching efficiency and the excitation/emission wavelengths of the fluorophore.
By systematically varying the length of the chemical linker, we found that increasing linker length reduces quenching efficiency, consistent with observations in the literature26. Addition of a C6 linker (~10.5 Å, lengths estimates in Supplementary Table 3) between Cbl and ATTO 590 resulted in higher residual fluorescence (5.9% for Cbl-C6-ATTO 590 vs. 3.9% for Cbl-ATTO 590 (7)) (Fig. 1d). Increasing the linker further to five polyethylene glycol (PEG) units (~17.5 Å) or a 4x glycine linker (~21.4 Å) increased the residual fluorescence to 10% and 11%, respectively. Similar trends were observed for probes with FAM as the fluorophore (Supplementary Fig. 3), confirming that quenching is most efficient when the fluorophore is close to Cbl.
RNA binding induces fluorescence turn-on
To test whether binding of Cbl to the riboswitch would sterically separate the fluorophore and quencher, resulting in fluorescence turn-on, we measured the fluorescence signal of Cbl-fluorophore probes in the presence and absence of a series of riboswitch variants. An increase in fluorescence was observed for all probes upon binding to Cbl riboswitches (Fig. 2), including the short riboswitch aptamer, AT, the full-length riboswitch A which contains an additional structural element to increase bulkiness, and variants B, C, D with different predicted secondary structure (Fig. 2a-c, Supplementary Fig. 4, see Supplementary Table 4 for a summary of fold turn-on results). Importantly, the fluorescence was not significantly changed in the presence of the negative control RNA AT,MUT that harbors four point mutations to abolish binding to Cbl, and RNA AT did not affect the fluorescence signal of the free fluorophore (Supplementary Fig. 5). Combined, these results suggest that increasing steric bulk of the RNA can lead to increased fluorescence turn-on.
Figure 2.
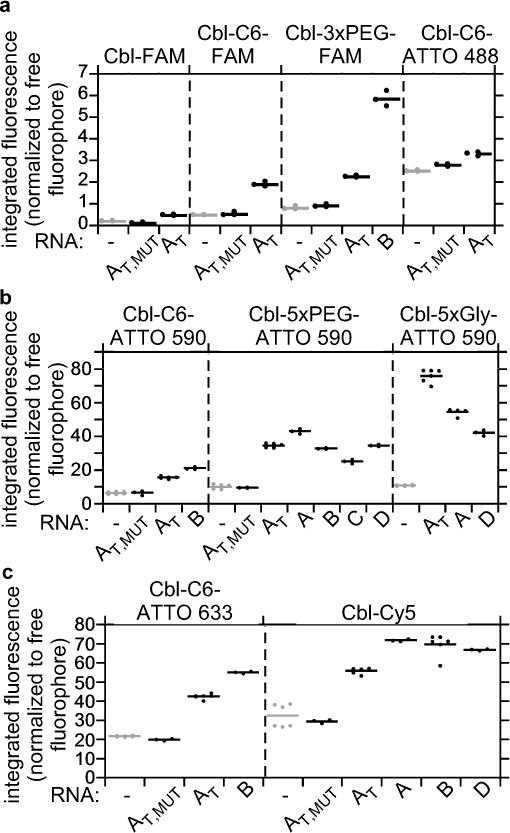
Cbl riboswitch RNAs induce fluorescence turn-on in Cbl-fluorophore probes in vitro. The fluorescence intensity of Cbl-fluorophore probes in the presence or absence of different RNAs was quantified as in Figure 1d and normalized relative to the intensity of the free fluorophore. RNAs A, B, C and D are variants of Cbl-binding riboswitch sequences, where AT refers to a truncated version of A with linker region J1/3 and stem-loop P/L13 deleted (see also Figure 1b). AT,MUT contains four point mutations in the Cbl-binding site (see Figure 1b for the position of these residues). (a) Probes with fluorescence in the green wavelength range (n=3 independent measurements); (b) probes with fluorescence in the red wavelength range (from left to right, n=9, 3, 6, 3, 6, 3, 6, 3, 3, 3, 3, 12, 6, 6, 3 independent measurements), (c) probes with fluorescence in the far red wavelength range (from left to right, n=6, 3, 6, 3, 6, 3, 6, 3, 6, 3). See Supplementary Table 4 for a summary.
Because fluorophore spectral properties impacted the extent of quenching and fluorescence turn-on, we evaluated whether Förster resonance energy transfer (FRET) contributes to quenching by calculating the Förster radius R0 and estimating the distance between the fluorophore and quencher (Supplementary Tables 3, 5, 6). The estimated quencher – fluorophore distance for green fluorescent probes (FAM and ATTO 488) is significantly below the calculated R0 value, consistent with efficient quenching (< 3% residual fluorescence, Fig. 1d, Supplementary Table 5). For these probes, the bulkiest RNAs tested resulted in a fluorescence signal < 6% of the free fluorophore (Fig. 2a), presumably because the length of the linker does not allow for separation of fluorophore and quencher beyond R0. While our theoretical estimates are consistent with a model where FRET contributes to quenching, conjugates in the far red wavelength regime (λem ~660 nm) lack spectral overlap with the Cbl absorbance spectrum (Supplementary Fig. 6), yet still exhibit moderate quenching, suggesting that non-FRET mechanisms such as contact quenching or electron transfer must also contribute. Probes with the ATTO 590 fluorophore have a Förster radius (R0 = 20 Å) close to the estimated distance between the corrin ring and fluorophore (Supplementary Table 5), suggesting these probes are particularly susceptible to large changes in fluorescence intensity for small distance changes.
Biophysical characterization of RNA/probe complexes
We next identified RNA and Cbl-fluorophore probes with ideal photophysical behavior for cellular imaging and characterized their biophysical properties. We reasoned that shorter RNA tags would be less disruptive in RNA fusions. Therefore, we chose RNAs A and AT for their small size (103 and 81 nucleotides, respectively) and induction of strong fluorescence turn-on in vitro (4.9x for A with Cbl-5xPEG-ATTO 590 (8) and 7.3x for AT with Cbl-4xGly-ATTO 590 (9), Supplementary Table 4). We also included D (130 nucleotides), since preliminary studies indicated high binding affinity to Cbl. Indeed, RNA tags A and D bind Cbl-5x-PEG-ATTO 590 tightly with a dissociation constant (KD) of 34 nM and 3 nM, respectively, comparable to the KD for Cbl alone (Supplementary Fig. 7, Supplementary Table 7). The truncated riboswitch, AT, bound Cbl-5xPEG-ATTO590 with a lower affinity with a KD of 1.3 μM.
We chose Cbl-fluorophore probes with red and far red fluorescent properties for further characterization due to decreased cellular autofluorescence in this wavelength regime. Additionally, while green fluorescent probes display efficient quenching and reasonable fluorescence turn-on (up to 7.4x fluorescence turn-on for Cbl-3xPEG-FAM (10) with B), the fluorescence signal after turn-on was low (only ~5% of fluorescence of free FAM (11)), raising concerns about the total signal intensity in microscopy applications. Therefore, red and far red probes (Cbl-5xPEG-ATTO 590, Cbl-4xGly-ATTO 590 and Cbl-Cy5) were selected for cellular studies since they exhibited robust turn-on and a fluorescence signal closer to the free dye (Fig. 2b, c).
The quantum yield of Cbl-5xPEG-ATTO590, Cbl-4xGly-ATTO 590 and Cbl-Cy5 was determined in the presence and absence of A and D (Supplementary Fig. 8, Supplementary Table 8). We observed a decrease in quantum yield for Cbl-fluorophore probes vs. free fluorophores and an increase in the presence of RNA, consistent with results from our plate reader fluorescence assay (Fig. 2b, c). Similarly, the fluorescence lifetime was reduced for Cbl-fluorophore probes vs. the free fluorophore and increased in the presence of the RNA (Supplementary Fig. 9, Supplementary Table 9). Lastly, we assessed photostability of the red Cbl-5xPEG-ATTO 590 and the far red Cbl-Cy5 bound to RNA A in vitro under constant illumination. As seen by others22, DFHBI-1T-Broccoli photobleached to < 20% fluorescence within a second. In contrast, Cbl-Cy5 bound to A retained >80% fluorescence even after 50 s constant illumination (>60% fluorescence after 50 s for Cbl-5xPEG-ATTO 590 bound to A) (Supplementary Fig. 10, Supplementary Table 10). Together, tight binding of our probes to riboswitch variants A and D, robust increase in quantum yield upon RNA binding, as well as substantially slower photobleaching compared with the dye-binding aptamer Broccoli indicate favorable properties for cellular imaging applications.
Visualization of mRNA dynamics in live mammalian cells
We tested our new RNA imaging platform by visualizing recruitment of β-actin mRNA (encoded by ACTB) to SGs in U2-OS cells tagged with the riboswitch variants (Fig. 3, Supplementary Fig. 11). In vitro evolved dye-binding aptamers contain a G-quadruplex fold31,32 which has been shown to complicate RNA folding in mammalian cells33. A scaffold to improve folding in mammalian cells is often included for evolved aptamers when fused to mammalian RNAs20–22, yet certain scaffolds increase undesired RNA processing in mammalian cells34. Our RNA tag did not require the tRNA folding scaffold35 and exclusion of the scaffold prevented unwanted processing (Supplementary Fig. 12) and reduced the overall tag size, prompting us to omit this scaffold for all further live cell experiments. The residual unquenched fluorescence of the three Cbl-fluorophore probes used in cellular studies (Cbl-5xPEG-ATTO 590, Cbl-4xGly-ATTO 590, Cbl-Cy5) revealed that in the absence of the riboswitch RNA, bead loading36–38 the probes in U2-OS cells gave rise to diffuse cytosolic and nuclear localization (Supplementary Fig. 13a-c). Treatment of U2-OS cells with arsenite induces formation of SGs that contain the marker protein G3BP139,40, tagged with GFP or the Halo-tag and subsequently labeled with red or far red fluorophores JF585, SiR594 or JF64641 (Supplementary Fig. 14). ACTB mRNA tagged with A localized to G3BP1-positive SGs39,40 via fluorescence in situ hybridization (FISH) in fixed cells (Supplementary Fig. 15a), similar to endogenous ACTB mRNA (Supplementary Fig. 16). A transfection marker was used to identify cells containing A-tagged ACTB mRNA (Supplementary Fig. 17), Cbl-Cy5 probe was loaded in live cells, and SGs were induced by arsenite (Fig. 3a). We observed robust accumulation of Cbl-Cy5 fluorescence in SGs upon arsenite treatment when 4 copies of A were used, but not when only one copy was used (Fig. 3b, c, Supplementary Fig. 18). Similar results were obtained with the Cbl-4xGly-ATTO 590 probe (Supplementary Fig. 19). Finally, time-lapse imaging enabled detection of the formation of ACTB-(A)4x mRNA-containing SGs and tracking of SG dynamics for ~ 50 min (Supplementary Fig. 20). These experiments demonstrate that ACTB mRNA recruitment to SGs and mRNA dynamics over time can be visualized via the riboswitch tag.
Figure 3.
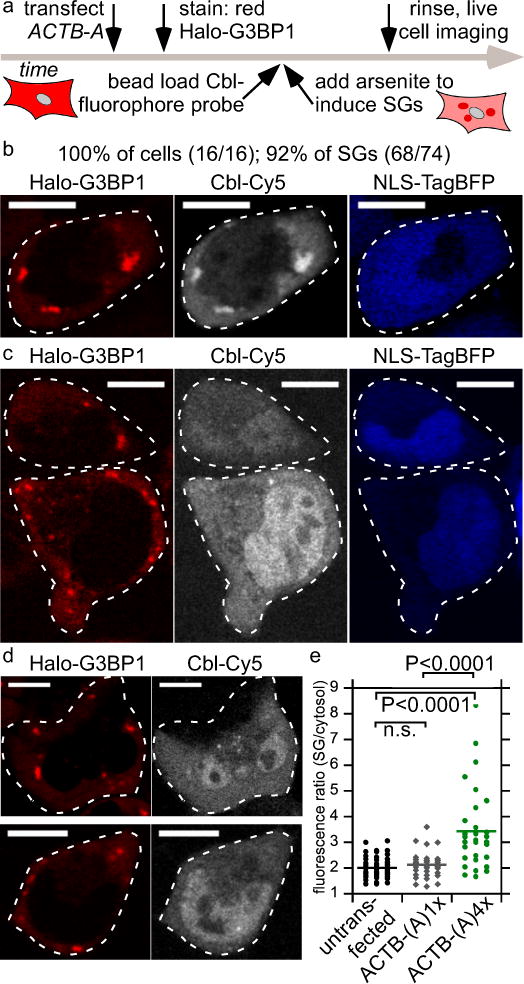
Monitoring ACTB mRNA localization to stress granules (SG) via Cbl-fluorophore probe binding to the RNA tag A. (a) Experimental strategy of labeling the Halo-tagged G3BP1 SG marker protein with the red fluorescent JF585 dye, followed by bead loading the Cbl-fluorophore probe, induction of SGs by arsenite for 30-45 min and live cell imaging. (b) U2-OS cells producing Halo-G3BP1 were transfected with ACTB-(A)4x and the transfection marker TagBFP. 24 h post transfection, cells were stained with the JF585 Halo dye. Shown is a representative live cell to assess colocalization of the SG marker protein Halo-G3BP1 and ACTB mRNA (3 independent experiments, 16 cells, 74 SGs). At least one SG was visible in all 16 cells (100%) and 92% of SGs were detectable. (c) The same experiment as in (b) was performed, except that ACTB-(A)1x was transfected (3 independent experiments, 14 cells, 30 SGs). Two representative live cells are presented. In 43% of the cells at least one SG was detectable and 40% of all SGs were detected in the Cbl-Cy5 channel. (d) The same experiment as in (b) was performed, except that ACTB-(A)4x was not transfected (2 independent experiments, 39 cells, 100 SGs). Two representative live cells are presented. In 38% of the cells at least one SG was detectable and 32% of all SGs were visible in the Cbl-Cy5 channel. (e) Quantification of fluorescence signal accumulation in representative SGs (line represents mean). Scale bar = 10 μm. One way ANOVA (95% confidence limit), post hoc test (Tukey HSD).
The Cbl-Cy5 fluorescence signal remained diffuse throughout the cytosol in untransfected cells even when G3BP1-labeled SGs were induced (Fig. 3d), indicating that Cbl-Cy5 specifically binds to the A aptamer. In the absence of arsenite stress, a very small fraction of transfected cells showed SG formation, in which case Cbl-Cy5 fluorescence localized to SGs (Supplementary Fig. 21). In this case, the SGs result from the process of transfection, which has been shown to induce SGs occasionally42. The expression level of mRNA fusions and probe uptake efficiency (Supplementary Fig. 13a) are heterogeneous, which may explain the broad distribution of Cbl-Cy5 fluorescence increase in SGs (Fig. 3e). To directly confirm accumulation of tagged ACTB mRNA in SGs, we correlated the live cell mRNA signal with FISH on the same cells after fixation (Supplementary Fig. 22). In summary, we demonstrated recruitment of ACTB mRNA to SGs in live cells using our riboswitch tagging system, enabling visualization of 100% cells containing at least 1 SG and 92% of all SGs for the Cbl-Cy5 probe, with the additional benefit of allowing visualization with two orthogonal colors (ATTO 590 and Cy5).
Comparison with Broccoli and MS2
We next compared our riboswitch-based RNA tag with commonly used RNA imaging platforms, namely the dye binding aptamer Broccoli17,21 and the MS2 system6,43 using recruitment of tagged ACTB mRNA to SGs as a model system. ACTB mRNA was tagged with a dimer of Broccoli dimers integrated in the F30 folding scaffold21, such that each tag binds four fluorogens (called 2xdBroccoli) or 1, 2, 4 or 24 copies of the MS2 stem-loop (SL) repeat (Supplementary Fig. 11, Supplementary Table 1). Because each MS2-SL binds a dimer of MS2-GFP44, we chose ACTB-(MS2-SL)2x as a comparison with our platform where four copies of the RNA tag were used (Supplementary Table 1). Tagging of ACTB mRNA with 2xdBroccoli or with up to 24 copies of the MS2-SL does not affect ACTB mRNA localization to SGs (Supplementary Fig. 15b, c).
Before assessing ACTB mRNA recruitment to SGs using the 2xdBroccoli tag, we confirmed that we could visualize Broccoli-tagged 5S and U6 RNA using recommended experimental procedures21 (Supplementary Fig. 23). We then examined mRNA recruitment to SGs and found that in 90% of transfected cells containing SGs in the red fluorescent (Halo-G3BP1) channel, no corresponding SGs in the green Broccoli channel were detectable (401/445 cells, Fig. 4a, Supplementary Fig. 24). In the remaining 10% of cells, green puncta colocalizing with Halo-G3BP1-positive SGs were detectable, but only a minor fraction of all SGs were detected (4% of SG, 64/1790 SGs total). As seen for tagging with the riboswitch, transient transfection occasionally induced G3BP1-positive SGs even in the absence of arsenite treatment (Supplementary Fig. 25). While rapid photobleaching of Broccoli is a well-established complication of the Spinach and Broccoli system22,45 (Supplementary Fig. 10), we used laser scanning confocal microscopy, a modality that resembles pulsed illumination shown to be ideal for Spinach and Broccoli imaging45. Nonetheless, we were unable to robustly visualize recruitment of ACTB mRNA tagged with a total of four Broccoli copies to SGs.
Figure 4.
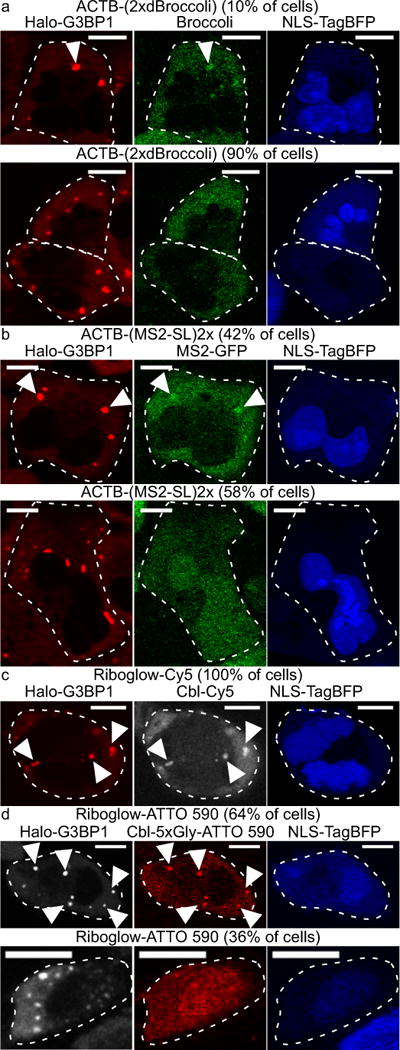
Comparison of ACTB mRNA imaging in stress granules (SG) by RNA tagging systems with four fluorophores per RNA. A plasmid encoding tagged ACTB was transfected into U2-OS Halo-G3BP1 cells with the NLS-TagBFP transfection marker. Halo-G3BP1 was labeled with a Halo dye for SG identification and SGs were induced by arsenite. (a) ACTB-(2xdBroccoli) was transfected, the Broccoli probe DFHBI-1T was added and cells were assessed for SGs in the green channel (445 cells, 3 independent experiments). In 10% of all transfected cells, at least one SG was detected and 4% of all SGs were detected (1790 SGs, 445 cells). (b) ACTB fused with two MS2 SL repeats was transfected with NLS-TagBFP into U2-OS Halo-G3BP1 cells that stably produce MS2-GFP (in 42% of all transfected cells at least one SG was detected and 17% of all SGs were detected; 162 SGs total in 53 cells, 2 independent experiments). (c, d) ACTB tagged with four copies of the riboswitch tag A was transfected with NLS-TagBFP in U2-OS Halo-G3BP1 cells. (c) Cbl-Cy5 was loaded in cells (in 100% of all transfected cells at least one SG was detected in the Cy5 channel and 92% of all SGs were detected; 74 SGs total in 16 cells, 3 independent experiments). (d) Cbl-ATTO 590 was loaded in cells (in 64% of all transfected cells at least one SG was detected in the Cy5 channel and 58% of all SGs were detected; 59 SGs total in 22 cells, 2 independent experiments). Scale bar = 10 μm.
To evaluate the MS2 system, we assessed ACTB mRNA recruitment to SGs tagged with one, two, four or 24 copies of MS2-SL (Supplementary Fig. 26, Fig. 4b). These experiments were performed in a variant of the U2-OS Halo-G3BP1 where NLS-MS2-GFP was also stably produced from the chromosome such that MS2-GFP remains nuclear in the absence of ACTB mRNA fused to MS2-SL (Supplementary Fig. 27). Localization of mRNA tagged with 24x MS2-SL to SGs was readily visualized via MS2-GFP recruitment to SGs in the majority of transfected cells containing SGs (86%, 43/50 cells, Supplementary Fig. 26d). With one, two or four copies of MS2-SL, visualization of ACTB mRNA localization to SGs was less efficient (28% of cells, 26% of all SGs for 1x MS2-SL tag; 42% of cells, 17% of all SGs for 2x MS2-SL tag; 45% of cells, 28% of all SGs for 4x MS2-SL tag, Fig. 4b, Supplementary Fig. 26). The fluorescence contrast for SGs over cytosolic background signal was markedly reduced for 1x, 2x, or 4x-MS2-SL compared to 24x MS2-SL (Supplementary Fig. 26). In summary, our riboswitch tagging system performed similarly to the 24x MS2 system with respect to reliably detecting localization of a candidate mRNA (ACTB) to SGs (Fig. 4c, d), while our platform outperforms both the Broccoli and MS2 system on a fluorophore by fluorophore basis (Fig. 4).
Sequestration of U1 snRNA in U-bodies in live cells
The small size of our truncated RNA tag (AT, 81 nt) opens up the possibility for tagging of ncRNAs such as snRNA U1 in live cells. Proper processing of U snRNA depends on its length with an overall size limit of 200-300 nucleotides (nt)46, limiting the size of any U1 fusion tag to ~100 nt. We introduced one copy of AT (81 nt) near the 5′ end of the U1 coding sequence (Supplementary Fig. 11), a position previously shown to be compatible with short RNA tags47. AT-tagged U1 colocalized with the Cajal body marker protein Coilin in the nucleus of HeLa cells (Supplementary Fig. 28a, b), consistent with previously observed U snRNAs localization48. Treatment of HeLa cells with thapsigargin induced sequestration of endogenous U1 snRNA and AT-tagged U1 in cytosolic U-bodies that contained the marker proteins DEAD-Box Helicase 20 (DDX20) and survival motor neuron (SMN) (Supplementary Fig. 28c, 29). When loading Cbl-fluorophore probes in live HeLa cells, non-specific puncta formation was observed for Cbl-Cy5 and for Cbl-4xGly-ATTO 590, but not for Cbl-5xPEG-ATTO 590, even at elevated probe concentrations (Supplementary Fig. 13d-g), leading us to choose Cbl-5xPEG-ATTO 590 for live U1 snRNA visualization. After thapsigargin-treatment of cells transiently transfected with AT-tagged U1 (Fig. 5a), 24±10% of cells contained cytosolic puncta resembling U-bodies, whereas such puncta were only observed in 6±3% of untransfected cells (Fig. 5b), consistent with previous studies, where ~25% of HeLa cells contained U-bodies upon thapsigargin-treatment5. No cytosolic puncta were observed in the absence of thapsigargin-treatment (Supplementary Fig. 30). Finally, co-transfection of a plasmid encoding GFP-SMN together with a plasmid encoding AT-tagged U1 confirmed colocalization of SMN and U1 (Fig. 5c, Supplementary Fig. 31). Together, we conclude that our riboswitch-based imaging system allows for live cell visualization of small non-coding RNAs such as the snRNA U1.
Figure 5.
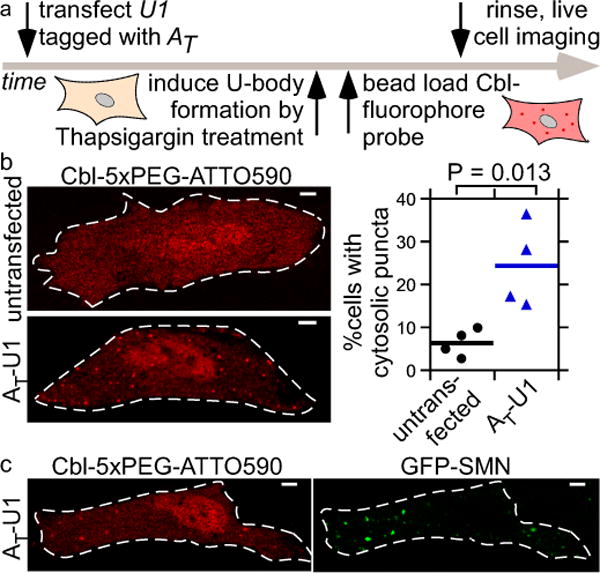
Monitoring cytosolic U-bodies via AT-tagged U1. (a) After transient transfection of AT-U1, U-bodies were induced by thapsigargin treatment followed by live cell microscopy. (b) Cbl-5xPEG-ATTO 590 localization to cytosolic puncta in thapsigargin-treated HeLa cells is more likely when AT-U1 was transfected (AT-U1: mean from 4 independent experiments/326 cells; untransfected: mean from 4 independent experiments/677 cells). One way ANOVA (95% confidence limit), post hoc test (Tukey HSD). (c) Cytosolic puncta in thapsigargin-treated cells producing AT-U1 RNA co-localize to GFP-SMN U-bodies. 3 independent experiments, 10 cells. Scale bar = 5 μm.
Discussion
In this work we introduce a new riboswitch-based RNA imaging platform that we call ‘Riboglow’ characterized by several features that distinguish it from previous RNA-detection systems. First, the RNA tag is small and exploits the selective and high affinity (KD in nM range) binding between a riboswitch and its cognate ligand, Cbl. Second, because the RNA tag binds the fluorescence quencher, Cbl, the system is compatible with a wide range of synthetic fluorophores spanning the green to far red spectral range. The Riboglow-ATTO 590 and Riboglow-Cy5 probes used for live cell studies retain favorable photophysical properties, including slow photobleaching, of the parent dyes when bound to RNA. Indeed, we were able to visualize tagged mRNA over 50 min without detectable photobleaching (Supplementary Fig. 20). Third, our RNA tag is not subjected to undesired processing and hence does not require the tRNA-like scaffold used for other dye-binding aptamers. Fourth, Cbl riboswitches include a large family of RNA sequences that all bind Cbl49 that can be exploited for future optimization and customization of the Riboglow platform. Fifth, the fluorescence lifetime of ATTO 590 and Cy5 in the context of our probes varies when the RNA binds (Supplementary Fig. 9), raising the possibility of using this system for fluorescence lifetime imaging. Finally and perhaps most importantly, we were able to visualize recruitment of RNA polymerase II-dependent transcripts (mRNA and snRNA) to RNA-protein granules, where the short size of the RNA tag (~80 nt for RNA tag AT) enabled tagging and visualization of U1 snRNA in live cells for the first time.
To compare the performance of Riboglow to existing RNA imaging platforms, we characterized recruitment of mRNA to SGs in live cells. Riboglow is most similar to dye-binding systems (Spinach17, Broccoli18 and Mango19,20) in terms of concept, size of the RNA tag, and molar mass of the probe. We used a two-fold repeat of dimer-Broccoli because it is the brightest of the Spinach/Broccoli family and most widely used of the dye-binding aptamers. Compared to Riboglow, a small minority of SGs were detected via the Broccoli-labeled mRNA (4% of SGs versus 92% for Riboglow-Cy5 or 58% of SGs for Riboglow-ATTO 590). This is perhaps not surprising because dye-binding aptamers have not yet been used to detect RNA polymerase-II transcripts, such as mRNA. Rather, these systems have been applied to RNA polymerase-III transcripts20,22 which are expressed at higher levels, particularly in HEK 293 cells. It is noteworthy that Riboglow displays much weaker fold fluorescence turn-on in vitro than the ~1,000-fold in vitro fluorescence enhancement for both Broccoli18 and Mango19,20. However, cellular contrast defined as fluorescence signal in RNA-granules vs. cytosolic background was comparable for our platform (~3-4-fold, Fig. 3d) and Mango-tagged 5S-RNA and U6-RNA foci (~2-3-fold fluorescence turn-on in fixed mammalian cells20). The in vitro-evolved dye-binding aptamers all feature G-quadruplex RNA folds32,33, and it has been shown that the dyes can bind other G-quadruplex RNAs non-specifically in cells33, possible contributing to diminished cellular contrast. Moreover, cellular contrast is influenced by folding of the RNA tag in the cellular environment, temperature- and salt-dependent stability of the RNA-probe complex, and probe photobleaching properties.
The MS2/PP7 system is the gold standard for detection of mRNA dynamics in mammalian cells6,7. Indeed, we found that 1x, 2x, 4x, and 24x copies of the stem-loop all permitted visualization of mRNA recruitment to SGs. Not surprisingly, the 24x tag yielded the strongest fluorescence contrast and led to detection of the greatest number of SGs (76% of all SGs). Our Riboglow platform outperformed the MS2 system when the same number of fluorogens tagged the RNA (Fig. 4). Riboglow even compared favorably with the 24x MS2 system, yielding robust detection of SGs in transfected cells (92% of SGs for Riboglow-Cy5, 58% of SGs for Riboglow-ATTO 590) and 3-4x fluorescence contrast of labeled mRNA in SGs.
There are some properties of Riboglow that are less favorable when compared to other RNA-tagging systems. While the Broccoli probe DFHBI-1T and Mango probe TO1-Biotin are cell-permeable, we use bead loading for cellular Cbl-fluorophore probe uptake. Although we have found bead loading to be a robust and simple procedure that is routinely used in other live cell imaging applications36,37, this process adds an additional step to the imaging process. Utilization of the natural Cbl uptake route may present an alternative in the future50. Additionally, mammalian cells contain at least four known Cbl-binding proteins and it is possible that our Cbl-fluorophore probes could bind to these proteins, yielding fluorescence turn-on (much like dyes binding to G-quadruplexes in cells33). Although we observe robust 3-4x contrast when tracking recruitment of RNA to RNA-protein granules, if non-specific binding is a problem for other applications, the Cbl-fluorophore probes could be further engineered to enhance specificity.
Overall, the Riboglow platform compares favorably in a direct side-by-side comparison with existing RNA imaging platforms and presents an orthogonal approach for live cell RNA imaging applications. The highly modular nature of the Riboglow platform currently allows for choice of imaging wavelength and detection of mRNAs as well as small non-coding RNAs, while presenting a system that is ideally set up for straightforward future customization to include desired features for RNA imaging.
Online Methods
Synthesis of fluorophore probes
Synthesis and characterization of probes are described in the Supplementary Note. All probes are derivatives of CN-Cbl (Supplementary Figure 2, see Supplementary Table 11 for photophysical properties).
RNA synthesis and preparation
For all in vitro experiments, DNA templates were amplified using recursive PCR and transcribed by T7 RNA polymerase using established methods51,52. Transcription reactions were purified using the appropriate percentage denaturing polyacrylamide gel (8 M urea, 29:1 acrylamide:bisacrylamide) based on RNA length. Transcripts were visualized by UV shadowing, excised from the gel and soaked overnight in 0.5x TE buffer (10 mM Tris-HCl, pH 8.0, 1 mM EDTA) at 4°C. RNAs were buffer exchanged into 0.5x TE and concentrated using centrifugal concentrators (Amicon) with the appropriate molecular weight cutoff. RNA concentration was determined using the absorbance at 260 nm and molar extinction coefficients calculated as the summation of the individual bases. Sequences and secondary structures of all riboswitch RNAs used in this study are shown in Supplementary Table 2 and Supplementary Fig. 1 and the published sequence for the Broccoli sequence was used (5′-GGA GCG CGG AGA CGG TCG GGT CCA GAT ATT CGT ATC TGT CGA GTA GAG TGT GGG CTC CGC GC)21.
Absorbance measurements and quantum yield determination
Absorbance spectra were collected using a Cary 500 UV-VIS-NIR spectrophotometer and buffer subtracted. The quantum yield (Q) of probes was determined by comparison with the published Q of ATTO 590 (0.80, Atto tec) or Cy5 (0.28, Lumiprobe). All experiments were done in RNA buffer (100 mM KCl, 10 mM NaCl, 1 mM MgCl2, 50 mM HEPES, pH 8.0). First, absorbance was determined at the excitation wavelength (Supplementary Table 11) for a dilution series of free fluorophore and Cbl-fluorophore probes +/− different RNAs. To ensure saturation of binding, the concentration was chosen such that the final concentration of RNA was above 5 μM in the most diluted sample. The fluorescence spectrum at the emission range (Supplementary Table 11) for each sample was then recorded using a PTI-fluorimeter (1 nm steps, 1 s integration time, 2 nm slits for the excitation and 4 nm slits for detector). After subtracting the buffer background signal, the fluorescence signal for each sample was integrated and plotted vs. the absorption. The steepness of the resulting linear plot for each dilution series reports on Q relative to the reference of the free fluorophore (Supplementary Table 8). These measurements were done once for the Q determination, and spectra were comparable with absorbance/fluorescence measurements done for fold fluorescence measurements.
Fluorescence lifetime measurements
The fluorescence lifetime of Cbl-fluorophore probes in the presence and absence of RNA (Supplementary Table 9) was measured in RNA buffer (100 mM KCl, 10 mM NaCl, 1 mM MgCl2, 50 mM HEPES, pH 8.0) using Time-Correlated Single Photon Counting. A PicoQuant FluoTime 100 fluorescence spectrometer and PicoQuant Picosecond Pulsed Diode Laser Heads with wavelengths 561 nm (LDH-D-TA-560) and 640 nm (LDH-P-C-640B) were used. Data were iteratively reconvoluted from the Instrument Response Function with one to three exponential decay functions, and the intensity weighted average lifetime values are reported.
Photobleaching measurements
Cbl-fluorophore probes and RNA were mixed, then 3-4x of microscope immersion oil (Olympus immersion oil type-F) was added and the solution was emulsified to generate droplets. Samples were prepared in RNA buffer for Cbl-fluorophore samples (100 mM KCl, 10 mM NaCl, 1 mM MgCl2, 50 mM HEPES, pH 8.0) and in Broccoli buffer (40 mM HEPES pH 7.4, 100 mM KCl, 1 mM MgCl 2) for the DFHBI-1T/Broccoli sample. The droplets were sandwiched between a glass slide and a coverslip. The sample was placed on the sample stage of a Nikon Ti-E HCA widefield fluorescence microscope with the coverslip facing a 20× objective lens. All samples were continuously illuminated throughout the experiment at the irradiance reported in Supplementary Table 10. We assessed photostability by fixing the excitation rate, i.e. the number of absorbed excitation photons were the same for the Cbl-fluorophore/RNA samples and the DFHBI-1T/Broccoli sample. The high irradiance for the DFHBI-1T/Broccoli sample is a result of its low extinction coefficient. Images were acquired every 50 ms for DFHBI-1T/Broccoli and every 250 ms for others for 3 seconds, then every second for 47 seconds or longer, and the exposure time of each image was 15 ms for DFHBI-1T/Broccoli and 40 ms for others. A total of 6 to 15 droplets were analyzed for each sample.
In vitro fluorescence measurements
The concentration of Cbl-fluorophore probes, free fluorophores and free Cbl was determined using extinction coefficients listed in Supplementary Table 11. All in vitro experiments were conducted in RNA buffer (100 mM KCl, 10 mM NaCl, 1 mM MgCl2, 50 mM HEPES, pH 8.0). For the Cbl-fluorophore probes, the extinction coefficient of the fluorophores was used to determine the concentration. The shape of the absorption spectra did not change significantly for the conjugated probes compared with the sum of spectra for free fluorophores and free Cbl (Supplementary Fig. 32). The fluorescence intensity of each probe was measured +/− RNA as technical triplicates in a Tecan Safire-II fluorescence plate. The concentration of the probe was 0.25 μM or 0.5 μM and the RNA concentration was at least 5 μM, significantly above the dissociation constant (KD) of the RNAs tested25,52. Samples were incubated for at least 20 min at room temperature in the dark to allow for Cbl-binding of the RNA prior to data collection. The excitation wavelength for each probe is listed in Supplementary Table 11 and the emission spectrum was collected in 1 nm increments for the range listed in Supplementary Table 11. Spectra were buffer subtracted, integrated and normalized to the signal of the free fluorophore at the same concentration.
Isothermal titration calorimetry (ITC)
ITC experiments were performed using protocols previously established and described25,52. Briefly, the RNA was dialyzed overnight at 4°C into RNA buffer (100 mM KCl, 10 mM NaCl, 1 mM MgCl2, 50 mM HEPES, pH 8.0) using 6-8000 Dalton molecular weight cutoff dialysis tubing (Spectra/Por). The dialysis buffer was used to dissolve Cbl and Cbl-5xPEG-ATTO590, and to dilute RNA to the desired concentration. Titrations were performed at 25°C using a MicroCal ITC200 microcalorimeter (GE Healthcare) and data were fit using the Origin software suite as previously described53.
Estimation of theoretical photophysical properties and distances in probes
The overlap integral J(λ) of each fluorophore with Cbl absorbance was calculated from equation (1)54:
| (1) |
where FD is the emission spectrum of the fluorophore normalized to unity and εA is the extinction coefficient of the acceptor (Cbl) in M−1 cm−1 using a MATLAB script (a|e - UV-Vis-IR Spectral Software 1.2, FluorTools, www.fluortools.com). Fluorescence was recorded with a PTI-fluorimeter (1 nm steps, 1 s integration time, 2 nm slits for the excitation and 4 nm slits for detector). Cbl absorbance and fluorophore emission spectra (Supplementary Fig. 6) were converted in units of M−1 cm−1 (for absorbance of Cbl) and to unity (for emission of fluorophores) to calculate J(λ). The Förster distance R0 was calculated from equation (2)54
| (2) |
where κ2 is a factor describing the relative orientations of the transition dipoles and was assumed as κ2 = 2/354 and the refractive index n was assumed to be 1.4 for aqueous solutions. The quantum yield Q of each donor fluorophore is available from the manufactures (Supplementary Table 8).
The maximal distance between quencher and fluorophore in each probe was estimated as the length of the chemical linker (Supplementary Table 3) plus the distance between the 5′ hydroxyl moiety of Cbl (where the linker is attached) and the corrin ring in the structure of Cbl25, assuming that this region of Cbl harbors quenching properties. The distance between 5′ hydroxyl moiety and the corrin ring was estimated to be 9 Å from the Cbl crystal structure25. This distance was added to each linker lengths, resulting in the distances listed in Supplementary Table 5.
Construction of plasmids for mammalian expression of RNA tag variants
Plasmids to produce RNA tags in mammalian cells were constructed by standard molecular cloning techniques (see Supplementary Fig. 11 for an overview and Supplementary table 2 for RNA sequences). To construct mRNA fusions, the commercially available vector pmCherry-C1 (Clontech) with a CMV promoter was used as a starting point. A NheI restriction site was introduced immediately following the stop codon by site directed mutagenesis. The sequence of mCherry was then replaced with the ACTB sequence after PCR amplification of the insert from an existing plasmid (sequence was verified to be identical with Homo sapiens beta actin (ACTB), NCBI Reference Sequence NM_001101.3) with flanking NheI restriction sites. RNA tags were inserted between the stop codon and the polyA site using existing KpnI and BamHI restrictions sites. Inserts encoding for RNA tags were purchased as g-blocks or ultramers with restriction site overhangs from IDT. Sequences for RNA tags are summarized in Supplementary Table 2 and the published tRNA scaffold sequence17 was used. The monomeric RNA tag was introduced by ligating a purchased insert into the plasmid with KpnI/BamHI restriction sites resulting in ACTB-(A)1x. Additional copies were introduced sequentially, where the second and third copy was encoded on a g-block with KpnI/KpnI and BamHI/BamHI restriction sites, respectively, resulting in ACTB-(A)2x and ACTB-(A)3x. ACTB-(A)4x was the result of the third ligation step, where colonies were screened for insertion of more than one copy of A. ACTB-(AT)4x was constructed using the same strategy.
The 2xdBroccoli sequence21 to generate ACTB-2xdBroccoli and 1x and 2x copies of MS2 stem-loop (SL) sequences were purchased as a g-block with KpnI and BamHI overhangs and ligated downstream of the ACTB sequence as described for the riboswitch tag. The 4x MS2 SL sequence was generated by ligating a second 2x MS2 SL g-block sequence with KpnI restriction sites on both ends in the ACTB-(MS2-SL)2x plasmid. The 24xMS2 SL tag was built by first replacing the RNA tag downstream of ACTB with a short g-block sequence consisting of NotI and PmeI sites using flanking KpnI and BamHI sites. Plasmid ACTB-(MS2-SL)24x was produced by cutting the 24x MS2-SL repeat from plasmid PGK1-24×MS2-SL9 with NotI and PmeI sites and ligating it downstream of the ACTB sequence via NotI and PmeI sites. Plasmids pAV5S-F30-2xdBroccoli and pAVU6+27-F30-2xdBroccoli34 were gifts from Samie Jaffrey (Addgene plasmid # 66845 and # 66842).
The existing plasmid pU1(human)55 was modified to add the sequence of the RNA tag AT immediately following the first 11 nucleotides of U1, analogous to previous U1 snRNA fusions47. The parent plasmid was digested with two existing unique restriction sites (BglII is upstream of the U1 coding sequence and PstI is in the 3′ region of the U1 coding sequence). An insert that contains the sequence for AT and the surrounding U1 coding sequence including both restriction sites was purchased as a g-block from IDT and ligated, resulting in AT-U1. All plasmids were verified by sequencing.
Cell culture and cell lines
U2-OS cells56, HeLa cells and HEK 293T cells (both purchased from ATCC) were maintained in Dulbecco’s modified eagle medium (DMEM, Gibco) supplemented with 10% fetal bovine serum (FBS; Gibco) at 37°C/5% CO2. To generate a U2-OS cell line that stably produces GFP-G3BP1, the GFP-G3BP1 coding sequence was PCR amplified from a peGFP-C1-based vector with EcoRI and NotI overhangs and ligated into a Piggybac Dual Promoter plasmid that includes a Puromycin resistance cassette for selection (System Biosciences, Catalog # PB510B-1), resulting in plasmid pGFP-G3BP1-Piggybac. U2-OS cells were chemically transfected with pGFP-G3BP1-Piggybac and Super PiggyBac Transposase expression vector (System Biosciences, Catalog # PB220PA-1) using TransIT according to manufacturer recommendations (Mirus). After selection with 1 μg/mL Puromycin, U2-OS cells stably producing GFP-G3BP1 were FACS enriched for the brightest 30% of GFP-fluorescent cells.
To generate a U2-OS cell line that stably produces MS2-GFP, the MS2-GFP sequence was PCR amplified from plasmid pMS2-GFP (a gift from Robert Singer, Addgene plasmid # 27121) with XbaI and NotI overhangs, ligated into the Piggybac Dual Promoter plasmid, transfected in U2-OS cells with a Halo-G3BP1 genetic background, selected and FACS enriched as described above.
Introduction of an N-terminal 3xFLAG-HALO epitope tag to the endogenous G3BP1 protein was performed as previously described57 with the following modifications (Supplementary Fig. 33). First, two single-strand breaks were generated flanking the translational start site of G3BP1 with dual CRISPR-Cas9 nickases (D10A) in U2-OS cells. Correct targeting of crispr guides was confirmed by T7 Endonuclease assay (NEB). Cells were selected with Puromyocin to enrich for edited cells containing the sequence for the tags and the LoxP-flanked, SV40-driven Puromycin expression cassette. Removal of the Puromyocin expression cassette and in frame expression of 3xFlag-HALO was achieved by transient transfection of eGFP-Cre plasmid. Transiently transfected cells were enriched by FACS. Correctly edited cells were confirmed by PCR, Western blot and immunofluorescence using standard protocols.
Halo-staining
Halo dyes JF585, SiR594 and JF646 were gifts from Luke Lavis. Cells were incubated with 1 μM Halo dye in DMEM/5%FBS media for 20 min at 37 °C/5% CO2. Unbound dye was washed out by replacing the media first with PBS and then with DMEM/5%FBS media before further treatment was performed (arsenite treatment, bead loading, see below).
Bead loading
Cells were seeded in home-made imaging dishes (35 mm diameter) with a ~10 mm center hole covered by cover glass (No. 1.5, VWR). Culture media was removed and the Cbl-fluorophore probe (3 μL of a 50 μM stock in PBS for U-body imaging in HeLa cells, 3 μL of a 0.5 μM stock in PBS for mRNA imaging via Cbl-Cy5 in U2-OS cells and 3 μL of a 5 μM stock in PBS for mRNA imaging via Cbl-4xGly-ATTO 590 in U2-OS cells) was added directly on the cells. Microbeads were sprinkled onto the cells and the dye was loaded as described previously36–38. Culture media was added immediately, supplemented with arsenite for stress granules imaging (see below).
Stress granule (SG) assay
U2-OS cells producing GFP-G3BP1 or Halo-G3BP1 were seeded at 0.25×10⁶ cells in imaging dishes. One day after seeding, cells were chemically transfected with 2 μg plasmid DNA (1 μg of the ACTB-RNA tag fusion mixed with 1 μg of the transfection marker pNLS-TagBFP) using the TransIT transfection system following manufacturer recommendations (Mirus). On the next day, cells were stained with Halo dye and loaded with the Cbl-fluorophore probe as described above. Media added after bead loading contained 0.5 mM sodium arsenite and cells were incubated at 37 °C/5% CO2 for 30-45 min to induce stress granules. Cells were rinsed once in PBS and Fluorobrite media (Gibco), supplemented with 0.5 mM sodium arsenite, was used for live cell imaging. For correlative imaging where cells were first imaged live, followed by fixation and FISH/immunofluorescence imaging of the same cells, the following modifications were made: gridded imaging dishes (MatTek) were coated with 1 μg/mL fibronectin (Sigma) for 4 hours, following one rinse with full media, plasmid ACTB-(AT)4x was used and 3 μL of 50 μM Cbl-5xPEG-ATTO 590 was bead loaded.
U-body assay
HeLa cells were seeded at 0.1 - 0.15×10⁶ cells per imaging dish. One day after seeding, cells were chemically transfected with 1 μg plasmid DNA (AT-U1) using TransIT following manufacturer recommendations (Mirus). For experiments with marker proteins, 0.25 μg of GFP-SMN58 (a gift from Greg Matera, Addgene plasmid #37057) was co-transfected. For colocalization experiments with Coilin, 0.5 μg pEGFP-coilin59 (a gift from Greg Matera, Addgene plasmid #36906) was transfected with or without co-transfection of 0.5 μg plasmid DNA encoding for AT-U1. Imaging or fixation was performed the following day. For live cell imaging, cells were treated with 10 μM thapsigargin for 3 hours before the Cbl-fluorophore probe was bead loaded and imaged within 1 hour after loading. For immunofluorescence or FISH analysis, cells were fixed 3-4 hours after thapsigargin treatment.
Fluorescence microscopy and image analysis
Fluorescence microscopy was performed on a Nikon A1R Laser Scanning Confocal Microscope with a 100x oil objective (1.45 NA, Plan Apo I), a pixel size of 0.25 μm and an integration time of 2.2 μsec unless otherwise noted below or in Supplementary Table 12. Images were acquired at 16-bit depth with Nikon Elements Software and processed in ImageJ2 using the Fiji plugin. All live images were acquired with an environment chamber at 37°C. Laser lines used were 405 nm (DAPI, for nuclear staining and NLS-TagBFP imaging), 488 nm (GFP, for GFP-tagged proteins and Broccoli-tagged mRNA), 561 nm (TRITC, for ATTO 590 in Cbl-fluorophore probes and Alexa 546, Alexa 594 and Alexa 568 in FISH probes and secondary antibodies and for Halo-dyes JF595 and SiR594) and 638 nm (Cy5, for Cy5 and Halo-dye JF646). Image acquisition settings for each experiment are listed in Supplementary Table 12.
For live imaging of Broccoli-tagged 5S and U6 RNA, published protocols were used21. Briefly, plasmids pAVU6+27-F30-2xdBroccoli and pAV5S-F30-2xdBroccoli21 were transfected in HEK 293T cells and split into imaging dishes 48 h post transfection. 24 h later, DFHBI-1T was added at a final concentration of 40 μM and cells were imaged under widefield illumination conditions as recommended21 using a 60x oil objective and 250 ms exposure. No ND filters were used.
Immunofluorescence
Cells were fixed in 4% paraformaldehyde (EM grade, Electron Microscopy Sciences) for 10 min, rinsed three times in PBS and permeabilized for 10 min in PBS/0.2% Triton X-100 at room temperature, followed by three rinses in PBS. After blocking for 30 min at room temperature in PBS/5% FBS, slides were incubated with the primary antibody against DDX20 (mouse monoclonal, sc-57007, Santa Cruz Biotechnology, 1:200 dilution) or SMN (rabbit polyclonal, sc-15320, Santa Cruz Biotechnology, 1:200 dilution) in PBS/5% FBS at 4°C overnight. After three rinses in PBS, slides were incubated with the secondary antibody (1:1,000 dilution in both cases) and Hoechst nuclear dye (1:10,000 dilution) for 90 min at room temperature. The secondary antibody for DDX20 was a goat anti-mouse Alexa 594 antibody (Invitrogen) and the secondary antibody for SMN was a donkey anti-rabbit Alexa 568 antibody (Invitrogen). Slides were rinsed three times in PBS and once in water. If no FISH was performed subsequently, slides were mounted.
Fluorescence in situ hybridization (FISH)
When no immunofluorescence was performed prior to FISH, cells were fixed in 4% paraformaldehyde and permeabilized in 0.2% Triton X-100 as described above. When FISH was performed after immunofluorescence, no additional permeabilization step was performed. Cells were dehydrated sequentially in 70%, 95% and 100% ethanol for 5 minutes each. After a two minute drying step, cells were rehydrated in 2x SSC (1x SSC is 150 mM NaCl, 15 mM sodium citrate dihydrate, pH 7.0)/50% formamide (molecular biology grade) for 5 min. Slides were pre-hydrated in pre-hybridization solution (50% formamide, 2x SSC, 0.5 mg/mL UltraPure Salmon sperm DNA (ThermoFisher Scientific), 1 mg/mL UltraPure BSA (ThermoFisher Scientific), 0.13 mg/mL E. coli tRNA (Sigma Aldrich), 1 mM Vanadyl ribonucleoside complexes solution (Signal Aldrich) and 100 mg/mL dextran sulfate in ultrapure water) for 30 min at 37°C. After pre-hybridization, samples were hybridized with the probe (Supplementary Table 13) in pre-hybridization solution overnight at 37°C. On the following day, samples were washed twice in 2x SSC/50% formamide for 30 minutes each. Slides were rinsed in PBS once and sealed.
Northern blotting
Production and processing of RNA fusion variants was assessed in HEK 293T cells. Dishes were coated with 10 μg/mL Poly-L-Lysine for 1 h, rinsed and 2×10⁶ cells were seeded per 10 cm dish. On the following day, 15 μg plasmid DNA was transfected per dish using the TransIT (Mirus) chemical transfection system according to manufacturer recommendations. Cells were harvested 48 h after transfection and total RNA was extracted using the RNeasy (Qiagen) kit according to manufacturer recommendations. The final RNA concentration was typically 500-1000 ng/μL.
All solutions for gel electrophoresis and Northern blotting were made in diethylpyrocarbonate (DEPC)-treated and autoclaved water. 10 μg total RNA per lane were tried in a SpeedVac and the RNA was brought up in 15 μL of RNA sample buffer (50% v/v formamide, 6.3% v/v formaldehyde, 0.2M MOPS, 50 mM sodium acetate pH 5.2, 10 mM EDTA pH 8.0) plus 2 μL of RNA loading buffer (50% glycerol, 1 mM EDTA pH 8.0, 0.4% Bromophenol blue, 1 mg/mL ethidium bromide). Samples were heated at 65°C for 5 min and loaded on a 1% agarose/formaldehyde gel (50 mM sodium acetate pH 5.2, 10 mM EDTA pH 8.0, 1% w/v agarose, 6.3% formaldehyde). 10 μL of a Low Range ssRNA Ladder (New England Biolabs) was loaded as well. The gel was run in running buffer (50 mM sodium acetate pH 5.2, 10 mM EDTA pH 8.0, 6.3% formaldehyde) at 60 V for 2.5 h. To assess the quality of the isolated RNA, the gel was then stained with ethidium bromide (10 μL of 10 mg/mL ethidium bromide in 400 mL running buffer).
After destaining in water for 5 min, the RNA was transferred to a nylon membrane (Amersham Hybond-N+, GE Healthcare) using standard procedures. The RNA was crosslinked to the membrane by exposure to UV light, washed in 0.1X SSC and 0.1% sodium dodecyl sulfate (SDS) at 65°C for 1 h and prehybridized for 1 h in hybridization solution (6X SSC, 10X Denhardts solution (Life Technologies), 0.1% SDS) at 42°C. The membrane was then incubated with hybridization solution supplemented with the radioactive, labeled probe overnight at 42°C. After 3 wash steps for 5 min at room temperature in washing solution (6X SSC, 0.1% SDS) and an additional wash step at 48°C for 20 min, the membrane was dried and exposed overnight. Exposure and visualization of the 32P signal was done using the Phosphor Screen and Cassette System from GE Healthcare. The membrane was stripped to subsequently hybridize with another probe.
Radioactive probes (sequence listed in Supplementary Fig. 12c) were produced as follows. From a 100 μM stock of DNA probes, 2 μL were mixed with 2 μL 32P-ATP, 2 μL T4 Polynucleotide Kinase (PNK) (NEB), 2 μL of 10X T4 PNK buffer (NEB) in water and incubated at 37°C for at least 1 h. The DNA was then passed over a G-25 column (GE Healthcare) according to manufacturer recommendations to remove unincorporated ATP.
Data availability statement
The datasets generated during and/or analyzed during the current study are available from the corresponding author on reasonable request.
Supplementary Material
Acknowledgments
The authors would like to acknowledge financial support from the Human Frontiers Science Project and NIH Director’s Pioneer Award GM114863 (to A. E. Palmer). We acknowledge support from the National Science Centre, SYMFONIA DEC-2014/12/W/ST5/00589 to D. Gryko and A. J. Wierzba, the National Institutes of Health (5R01 GM073850) to R. T. Batey, and NSF Physics Frontier Center at JILA (PHY1734006) to R. Jimenez. We thank L. Lavis for providing fluorophores JF585, SiR594 and JF646 for Halo staining, S. Shukla and J. Garcia for helpful discussions and for providing cell lines, antibodies and plasmids, T. Stasevich, D. Muhlrad, J. Lee and M. Lo for technical expertise, and to J. Eberhard and J. Gassensmith for helpful discussions. The imaging work was performed at the BioFrontiers Institute Advanced Light Microscopy Core, whose Nikon A1R microscope was acquired by the generous support of the NIST-CU Cooperative Agreement award number 70NANB15H226. R.Jimenez is a staff member in the Quantum Physics Division of the National Institute of Standards and Technology (NIST). Certain commercial equipment, instruments, or materials are identified in this paper in order to specify the experimental procedure adequately. Such identification is not intended to imply recommendation or endorsement by the NIST, nor is it intended to imply that the materials or equipment identified are necessarily the best available for the purpose.
Footnotes
Author contributions
EB, JTP, RTB and AEP conceptualized and designed the study. JTP and RTB rationally designed riboswitch variants. EB, JTP, RTB, AJW, DG and AEP designed organic probes. AJW and MC synthesized organic probes. JTP and ZH purified riboswitch variants for in vitro work. EB performed in vitro work, designed and performed cellular work, and analyzed data with input from all authors. DB constructed plasmids and assisted with cellular work. STH performed in vitro fluorescence lifetime and bleaching experiments. JRW made the Halo-G3BP1 U2-OS cell line. RP and RJ provided critical advice. EB and AEP wrote the manuscript with edits from all authors.
Competing financial interests statement
The authors declare no competing financial interests.
References
- 1.Gerstberger S, Hafner M, Tuschl T. A census of human RNA-binding proteins. Nat Rev Genet. 2014;15:829–845. doi: 10.1038/nrg3813. [DOI] [PMC free article] [PubMed] [Google Scholar]
- 2.Buchan JR, Parker R. Eukaryotic Stress Granules: The Ins and Outs of Translation. Mol Cell. 2009;36:932–941. doi: 10.1016/j.molcel.2009.11.020. [DOI] [PMC free article] [PubMed] [Google Scholar]
- 3.Decker CJ, Parker R. P-Bodies and Stress Granules: Possible Roles in the Control of Translation and mRNA Degradation. Cold Spring Harb Perspect Biol. 2012;4:a012286. doi: 10.1101/cshperspect.a012286. [DOI] [PMC free article] [PubMed] [Google Scholar]
- 4.Matera AG, Wang Z. A day in the life of the spliceosome. Nat Rev Mol Cell Biol. 2014;15:108–21. doi: 10.1038/nrm3742. [DOI] [PMC free article] [PubMed] [Google Scholar]
- 5.Tsalikis J, et al. Intracellular bacterial pathogens trigger the formation of U small nuclear RNA bodies (U bodies) through metabolic stress induction. J Biol Chem. 2015;290:20904–20918. doi: 10.1074/jbc.M115.659466. [DOI] [PMC free article] [PubMed] [Google Scholar]
- 6.Fusco D, et al. Single mRNA molecules demonstrate probabilistic movement in living mammalian cells. Curr Biol. 2003;13:161–7. doi: 10.1016/s0960-9822(02)01436-7. [DOI] [PMC free article] [PubMed] [Google Scholar]
- 7.Wu B, Chen J, Singer RH. Background free imaging of single mRNAs in live cells using split fluorescent proteins. Sci Rep. 2014;4:3615. doi: 10.1038/srep03615. [DOI] [PMC free article] [PubMed] [Google Scholar]
- 8.Tutucci E, et al. An improved MS2 system for accurate reporting of the mRNA life cycle. Nat Methods. 2018;15:81–89. doi: 10.1038/nmeth.4502. [DOI] [PMC free article] [PubMed] [Google Scholar]
- 9.Garcia JF, Parker R. MS2 coat protein bound to yeast mRNAs block 5′ to 3′ degradation and trap mRNA decay products: implications for the localization of mRNAs by MS2-MCP system. RNA. 2015;21:1393–5. doi: 10.1261/rna.051797.115. [DOI] [PMC free article] [PubMed] [Google Scholar]
- 10.Wu B, Eliscovich C, Yoon YJ, Singer RH. Translation dynamics of single mRNAs in live cells and neurons. Science. 2016;352:1430–5. doi: 10.1126/science.aaf1084. [DOI] [PMC free article] [PubMed] [Google Scholar]
- 11.Katz ZB, et al. Mapping translation ’hot-spots’ in live cells by tracking single molecules of mRNA and ribosomes. Elife. 2016;5:1–17. doi: 10.7554/eLife.10415. [DOI] [PMC free article] [PubMed] [Google Scholar]
- 12.Nguyen DH, DeFina SC, Fink WH, Dieckmann T. Binding to an RNA aptamer changes the charge distribution and conformation of malachite green. J Am Chem Soc. 2002;124:15081–15084. doi: 10.1021/ja027635d. [DOI] [PubMed] [Google Scholar]
- 13.Babendure JR, Adams SR, Tsien RY. Aptamers Switch on Fluorescence of Triphenylmethane Dyes. J Am Chem Soc. 2003;125:14716–14717. doi: 10.1021/ja037994o. [DOI] [PubMed] [Google Scholar]
- 14.Arora A, Sunbul M, Jäschke A. Dual-colour imaging of RNAs using quencher- and fluorophore-binding aptamers. Nucleic Acids Res. 2015;43:e144. doi: 10.1093/nar/gkv718. [DOI] [PMC free article] [PubMed] [Google Scholar]
- 15.Sunbul M, Jäschke A. Contact-mediated quenching for RNA imaging in bacteria with a fluorophore-binding aptamer. Angew Chem Int Ed Engl. 2013;52:13401–4. doi: 10.1002/anie.201306622. [DOI] [PubMed] [Google Scholar]
- 16.Tan X, et al. Fluoromodules Consisting of a Promiscuous RNA Aptamer and Red or Blue Fluorogenic Cyanine Dyes: Selection, Characterization, and Bioimaging. J Am Chem Soc. 2017;139:9001–9009. doi: 10.1021/jacs.7b04211. [DOI] [PubMed] [Google Scholar]
- 17.Paige JS, Wu KY, Jaffrey SR. RNA mimics of green fluorescent protein. Science. 2011;333:642–6. doi: 10.1126/science.1207339. [DOI] [PMC free article] [PubMed] [Google Scholar]
- 18.Filonov GS, Moon JD, Svensen N, Jaffrey SR. Broccoli: Rapid Selection of an RNA Mimic of Green Fluorescent Protein by Fluorescence-Based Selection and Directed Evolution. J Am Chem Soc. 2014;136:16299–308. doi: 10.1021/ja508478x. [DOI] [PMC free article] [PubMed] [Google Scholar]
- 19.Dolgosheina EV, et al. RNA Mango Aptamer-Fluorophore: A Bright, High-Affinity Complex for RNA Labeling and Tracking. ACS Chem Biol. 2014;9:2412–2420. doi: 10.1021/cb500499x. [DOI] [PubMed] [Google Scholar]
- 20.Autour A, et al. Fluorogenic RNA Mango aptamers for imaging small non-coding RNAs in mammalian cells. Nat Commun. 2018;9:656. doi: 10.1038/s41467-018-02993-8. [DOI] [PMC free article] [PubMed] [Google Scholar]
- 21.Filonov GS, Jaffrey SR. RNA Imaging with Dimeric Broccoli in Live Bacterial and Mammalian Cells. Curr Protoc Chem Biol. 2016;8:1–28. doi: 10.1002/9780470559277.ch150174. [DOI] [PMC free article] [PubMed] [Google Scholar]
- 22.Song W, et al. Imaging RNA polymerase III transcription using a photostable RNA-fluorophore complex. Nat Chem Biol. 2017;13:1187–1194. doi: 10.1038/nchembio.2477. [DOI] [PMC free article] [PubMed] [Google Scholar]
- 23.Ceres P, Trausch JJ, Batey RT. Engineering modular ‘ON’ RNA switches using biological components. Nucleic Acids Res. 2013;41:10449–61. doi: 10.1093/nar/gkt787. [DOI] [PMC free article] [PubMed] [Google Scholar]
- 24.Ceres P, Garst AD, Marcano-Velázquez JG, Batey RT. Modularity of select riboswitch expression platforms enables facile engineering of novel genetic regulatory devices. ACS Synth Biol. 2013;2:463–72. doi: 10.1021/sb4000096. [DOI] [PMC free article] [PubMed] [Google Scholar]
- 25.Johnson JE, Reyes FE, Polaski JT, Batey RT. B12 cofactors directly stabilize an mRNA regulatory switch. Nature. 2012;492:133–7. doi: 10.1038/nature11607. [DOI] [PMC free article] [PubMed] [Google Scholar]
- 26.Lee M, Grissom CB. Design, synthesis, and characterization of fluorescent cobalamin analogues with high quantum efficiencies. Org Lett. 2009;11:2499–502. doi: 10.1021/ol900401z. [DOI] [PubMed] [Google Scholar]
- 27.Smeltzer CC, et al. Synthesis and characterization of fluorescent cobalamin (CobalaFluor) derivatives for imaging. Org Lett. 2001;3:799–801. doi: 10.1021/ol006825v. [DOI] [PubMed] [Google Scholar]
- 28.Fedosov SN, et al. Application of a fluorescent cobalamin analogue for analysis of the binding kinetics. A study employing recombinant human transcobalamin and intrinsic factor. FEBS J. 2006;273:4742–53. doi: 10.1111/j.1742-4658.2006.05478.x. [DOI] [PubMed] [Google Scholar]
- 29.Chromiński M, Gryko D. ‘Clickable’ vitamin B12 derivative. Chem - A Eur J. 2013;19:5141–8. doi: 10.1002/chem.201203899. [DOI] [PubMed] [Google Scholar]
- 30.Loska R, Janiga A, Gryko D. Design and synthesis of protoporphyrin IX/vitamin B-12 molecular hybrids via CuAAC reaction. J Porphyrins phtalocynines. 2013;17:104–117. [Google Scholar]
- 31.Trachman RJ, et al. Structural basis for high-affinity fluorophore binding and activation by RNA Mango. Nat Chem Biol. 2017;13:807–813. doi: 10.1038/nchembio.2392. [DOI] [PMC free article] [PubMed] [Google Scholar]
- 32.Warner KD, et al. Structural basis for activity of highly efficient RNA mimics of green fluorescent protein. Nat Struct Mol Biol. 2014;8:658–63. doi: 10.1038/nsmb.2865. [DOI] [PMC free article] [PubMed] [Google Scholar]
- 33.Jeng SCY, Chan HHY, Booy EP, McKenna SA, Unrau PJ. Fluorophore ligand binding and complex stabilization of the RNA Mango and RNA Spinach aptamers. RNA. 2016;22:1884–1892. doi: 10.1261/rna.056226.116. [DOI] [PMC free article] [PubMed] [Google Scholar]
- 34.Filonov GS, Kam CW, Song W, Jaffrey SR. In-gel imaging of RNA processing using Broccoli reveals optimal aptamer expression strategies. Chem Biol. 2015;22:649–660. doi: 10.1016/j.chembiol.2015.04.018. [DOI] [PMC free article] [PubMed] [Google Scholar]
- 35.Ponchon L, Dardel F. Recombinant RNA technology: the tRNA scaffold. Nat Methods. 2007;4:571–576. doi: 10.1038/nmeth1058. [DOI] [PubMed] [Google Scholar]
- 36.Morisaki T, et al. Real-time quantification of single RNA translation dynamics in living cells. Science. 2016;6392:1425–1429. doi: 10.1126/science.aaf0899. [DOI] [PubMed] [Google Scholar]
- 37.Hayashi-Takanaka Y, et al. Tracking epigenetic histone modifications in single cells using Fab-based live endogenous modification labeling. Nucleic Acids Res. 2011;39:6475–6488. doi: 10.1093/nar/gkr343. [DOI] [PMC free article] [PubMed] [Google Scholar]
- 38.McNeil PL, Warder E. Glass beads load macromolecules into living cells. J Cell Sci. 1987;88:669–678. doi: 10.1242/jcs.88.5.669. [DOI] [PubMed] [Google Scholar]
- 39.Nelles DA, et al. Programmable RNA Tracking in Live Cells with CRISPR/Cas9. Cell. 2016;165:488–496. doi: 10.1016/j.cell.2016.02.054. [DOI] [PMC free article] [PubMed] [Google Scholar]
- 40.Zurla C, Lifland AW, Santangelo PJ. Characterizing mRNA interactions with RNA granules during translation initiation inhibition. PLoS ONE. 2011;6:e19727. doi: 10.1371/journal.pone.0019727. [DOI] [PMC free article] [PubMed] [Google Scholar]
- 41.Grimm JB, et al. A general method to fine-tune fluorophores for live-cell and in vivo imaging. Nat Methods. 2017;14:987–994. doi: 10.1038/nmeth.4403. [DOI] [PMC free article] [PubMed] [Google Scholar]
- 42.Kedersha N, Tisdale S, Hickman T, Anderson P. Methods in enzymology. Elsevier Inc; 2008. Real-time and quantitative imaging of mammalian stress granules and processing bodies; p. 448. [DOI] [PubMed] [Google Scholar]
- 43.Wu B, Chao JA, Singer RH. Fluorescence fluctuation spectroscopy enables quantitative imaging of single mRNAs in living cells. Biophys J. 2012;102:2936–44. doi: 10.1016/j.bpj.2012.05.017. [DOI] [PMC free article] [PubMed] [Google Scholar]
- 44.Ni CZ, et al. Crystal structure of the MS2 coat protein dimer: implications for RNA binding and virus assembly. Structure. 1995;3:255–263. doi: 10.1016/S0969-2126(01)00156-3. [DOI] [PubMed] [Google Scholar]
- 45.Han KY, Leslie BJ, Fei J, Zhang J, Ha T. Understanding the photophysics of the Spinach-DFHBI RNA aptamer-fluorogen complex to improve live-cell RNA imaging. J Am Chem Soc. 2013;135:19033–19038. doi: 10.1021/ja411060p. [DOI] [PMC free article] [PubMed] [Google Scholar]
- 46.McCloskey A, Taniguchi I, Shinmyozu K, Ohno M. hnRNP C Tetramer Measures RNA Length to Classify RNA Polymerase II Transcripts for Export. Science. 2012;335:1643–1646. doi: 10.1126/science.1218469. [DOI] [PubMed] [Google Scholar]
- 47.Ishikawa H, et al. Identification of truncated forms of U1 snRNA reveals a novel RNA degradation pathway during snRNP biogenesis. Nucleic Acids Res. 2014;42:2708–2724. doi: 10.1093/nar/gkt1271. [DOI] [PMC free article] [PubMed] [Google Scholar]
- 48.Hutten S, Chachami G, Winter U, Melchior F, Lamond AI. A role for the Cajal-body-associated SUMO isopeptidase USPL1 in snRNA transcription mediated by RNA polymerase II. J Cell Sci. 2014;127:1065–1078. doi: 10.1242/jcs.141788. [DOI] [PMC free article] [PubMed] [Google Scholar]
- 49.Nahvi A, Barrick JE, Breaker RR. Coenzyme B12 riboswitches are widespread genetic control elements in prokaryotes. Nucleic Acids Res. 2004;32:143–50. doi: 10.1093/nar/gkh167. [DOI] [PMC free article] [PubMed] [Google Scholar]
- 50.Quadros EV, Sequeira JM. Cellular uptake of cobalamin: transcobalamin and the TCblR/CD320 receptor. Biochimie. 2013;95:1008–18. doi: 10.1016/j.biochi.2013.02.004. [DOI] [PMC free article] [PubMed] [Google Scholar]
- 51.Edwards AL, Garst AD, Batey RT. Determining Structures of RNA Aptamers and Riboswitches by X-Ray Crystallography. Methods Mol Biol. 2009;535:135–63. doi: 10.1007/978-1-59745-557-2_9. [DOI] [PMC free article] [PubMed] [Google Scholar]
- 52.Polaski JT, Holmstrom ED, Nesbitt DJ, Batey RT. Mechanistic Insights into Cofactor-Dependent Coupling of RNA Folding and mRNA Transcription/Translation by a Cobalamin Riboswitch. Cell Rep. 2016;15:1100–1110. doi: 10.1016/j.celrep.2016.03.087. [DOI] [PMC free article] [PubMed] [Google Scholar]
- 53.Gilbert SD, Batey RT. Monitoring RNA-Ligand Interactions Using Isothermal Titration Calorimetry. Methods Mol Biol. 2009;540:97–114. doi: 10.1007/978-1-59745-558-9_8. [DOI] [PubMed] [Google Scholar]
- 54.Lakowicz JR, editor. Principles of Fluorescence Spectroscopy. Springer; 2006. Quenching of Fluorescence; pp. 277–330. [Google Scholar]
- 55.Beckley Sa, Liu P, Stover ML, Gunderson SI, Rowe DW. Reduction of Target Gene Expression by a Modified U1 snRNA Reduction of Target Gene Expression by a Modified U1 snRNA. Mol Cell Biol. 2001;21:2815–25. doi: 10.1128/MCB.21.8.2815-2825.2001. [DOI] [PMC free article] [PubMed] [Google Scholar]
- 56.Wheeler J, Matheny T, Jain S, Abrisch R, Parker R. Distinct stages in stress granule assembly and disassembly. Elife. 2016;5:1–25. doi: 10.7554/eLife.18413. [DOI] [PMC free article] [PubMed] [Google Scholar]
- 57.Xi L, Schmidt JC, Zaug AJ, Ascarrunz DR, Cech TR. A novel two-step genome editing strategy with CRISPR-Cas9 provides new insights into telomerase action and TERT gene expression. Genome Biol. 2015;16:1–17. doi: 10.1186/s13059-015-0791-1. [DOI] [PMC free article] [PubMed] [Google Scholar]
- 58.Shpargel KB, Matera AG. Gemin proteins are required for efficient assembly of Sm-class ribonucleoproteins. Proc Natl Acad Sci USA. 2005;102:17372–17377. doi: 10.1073/pnas.0508947102. [DOI] [PMC free article] [PubMed] [Google Scholar]
- 59.Shpargel KB. Control of Cajal body number is mediated by the coilin C-terminus. J Cell Sci. 2003;116:303–312. doi: 10.1242/jcs.00211. [DOI] [PubMed] [Google Scholar]
Associated Data
This section collects any data citations, data availability statements, or supplementary materials included in this article.
Supplementary Materials
Data Availability Statement
The datasets generated during and/or analyzed during the current study are available from the corresponding author on reasonable request.