

Abstract
Preterm birth (PTB) is responsible for over one million infant deaths annually worldwide. Often, the first and only indication of PTB risk is the onset of early labor. Thus, there is an urgent need for an early PTB risk diagnostic that is inexpensive, reliable, and robust. Here, we describe the development of a microchip electrophoresis (μCE) method for separating a mixture of six PTB protein and peptide biomarkers present in maternal blood serum. μCE devices were photografted with a poly(ethylene glycol) diacrylate surface coating to regulate EOF and reduce non-specific analyte adsorption. Separation conditions including buffer pH, buffer concentration, and applied electric field were varied to improve biomarker peak resolution while minimizing deleterious effects like Joule heating. In this way, it was possible to separate six PTB biomarkers, the first μCE separation of this biomarker panel. Limits of detection were also measured for each of the six PTB biomarkers. In the future, this μCE separation can be integrated with upstream maternal blood serum sample preparation steps to yield a complete PTB risk diagnosis microdevice.
Keywords: point-of-care diagnostics, rapid analysis, integrated microfluidics, surface photografting, disease diagnosis
1 Introduction
Preterm birth (PTB) or birth before the 37th week of gestation is the leading cause of pregnancy-related complications and infant death (https://www.cdc.gov/reproductivehealth/maternalinfanthealth/pretermbirth.htm). The World Health Organization has estimated that over one in ten births is preterm, resulting in over one million infant deaths every year [1]. In addition to the high mortality rates for preterm infants, many struggle with incomplete development of vision, hearing, lungs, heart, or brain. While some of these complications can be resolved with proper intensive care treatment, others will last for the infant’s entire life [2]. The cost to care for these complications was at least $26 billion in 2013 in the United States [3], and these numbers have only increased in recent years.
Many PTB casualties are associated with incomplete development of vital organs. However, it is possible to increase developmental rates in some cases prior to birth if given enough advance notice to administer treatment. For example, treatment with antenatal corticosteroids prior to birth can improve lung development and reduce preterm infant mortality by over 370 thousand deaths annually [1,4]. The challenge is predicting PTB risk before the onset of early labor. While some factors such as environment, high blood pressure, a history of PTB, diabetes, or multiple pregnancies (i.e., twins, triplets, etc.) [5–8] are indicative of higher PTB risk, there are many cases in which none of these factors is present. Unfortunately, for many women, the first indication of PTB risk is the occurrence of early contractions.
In addition to physical factors, many chemical factors have been studied [9–12] in an attempt to diagnose PTB risk early. Recently, Esplin et al. [13] found three serum peptides indicative of PTB risk. The combined detection of these three peptides and six previously identified protein and peptide biomarkers [8] (Table 1) at a gestational age of 28 weeks allowed for the diagnosis of PTB risk with 87% selectivity and 81% specificity four weeks prior to the onset of early labor. However, the method that Esplin et al. used to identify these biomarkers involved solvent treatment to access the low-molecular-weight proteome, followed by LCMS analysis. This type of analysis, though powerful, is difficult and expensive to automate, especially for large scale preparation of samples [14]. Other approaches such as sandwich or competitive immunoassays are similarly limited by difficulty in multiplexing, the lack of two regions for antibody recognition in the smaller peptides, or lower sensitivity and specificity for competitive immunoassay [15]. Thus, an urgent, unmet need exists for a diagnostic platform capable of PTB biomarker analysis in a clinical environment. Ideally, this platform would be inexpensive, easy to use, and robust while allowing low limits of detection even in a complex matrix [16].
Table 1.
Panel of nine PTB biomarkers and their molecular masses.
| PTB Biomarker | Abbreviation | Mass (kDa) |
|---|---|---|
| PTB Peptide 1 | P1 | 2.0 |
| Corticotropin Releasing Factor | CRF | 2.7 |
| PTB Peptide 2 | P2 | 4.2 |
| PTB Peptide 3 | P3 | 4.2 |
| Defensins | Def | 3–6 |
| Tumor Necrosis Factor-α Receptor Type 1 | TNF | 26 |
| Lactoferrin | LF | 80 |
| Thrombin-Antithrombin III | TAT | 95–110 |
| Ferritin | Fer | 470 |
Microfluidics are uniquely situated to fill the needs posed for PTB biomarker analysis; indeed, integrated microfluidics allow many laboratory-based techniques and processes to be miniaturized onto a single platform [16–21]. Additionally, integrated microfluidics require less sample and reagent volumes than most benchtop methods, limit sample loss, and allow for automation of complete analyses. The field of integrated microfluidic biomarker analysis has been growing rapidly. Just in recent years, new microfluidic platforms for biomarker analysis have emerged with capabilities for colorimetric or electrochemical assays [22–23], ELISA [24], and other biosensors [25–26]. However, a common disadvantage of most of these studies is that they were only capable of analyzing a single analyte per device. Tang, et al.’s work [23] was an exception where four cancer biomarkers were measured, but this analysis required off-chip sample preparation and an array of sensors to achieve multiplexing.
In an effort to create an integrated microfluidic PTB biomarker analysis system capable of multiplexing, our lab has previously demonstrated SPE enrichment of select PTB biomarkers and integration of this system with μCE for subsequent separation [27–29]. Additionally, we have shown the ability to capture and purify PTB biomarkers from blood serum using immunoaffinity extraction coupled with μCE for subsequent separation [30]. In each of these cases, studies were only performed with one or two biomarkers. For greater sensitivity and specificity in PTB risk analysis to be realized, more biomarkers need to be separated and analyzed.
Here, we describe the development of a μCE method capable of separating six of the nine PTB biomarkers in this panel. We found that the resolution between the biomarker peaks could be influenced by the running buffer concentration and voltage. Additionally, LODs were determined for each of the PTB biomarkers in the μCE separation. After future integration with sample preparation steps, this μCE method should play a critical role in an integrated microfluidic PTB risk diagnostic test and allow for multiplexed identification and quantification of PTB biomarkers.
2 Materials and Methods
2.1 Reagents and Materials
The following chemicals were ordered from Sigma (St. Louis, MO): CHES, hydroxypropyl cellulose (HPC; 106 Da), poly(ethylene glycol) diacrylate (PEGDA; 575 Da), inhibitor remover beads, DMSO, and benzoin methyl ether (BME). FITC was purchased from Life Technologies (Carlsbad, CA). PTB biomarkers were obtained from the following sources: Fer from EMD Millipore (Billerica, MA), LF from Sigma (St. Louis, MO), P1 and P2 from Biomatik (Wilmington, DE), CRF and FITC-labeled P1 from GenScript (Piscataway, NJ), and TNF from ProSpec (East Brunswick, NJ). All solutions were made with deionized water (18.3 MΩ cm) from a Barnstead EASYpure UV/UF system (Dubuque, IA). Methanol was purchased from Macron (Center Valley, PA), sodium hydroxide from Mallinckrodt Baker (Paris, KY), and sodium bicarbonate from Merck (Darmstadt, Germany). HEPES, cyclohexane, and Amicon ultra 0.5 mL centrifugal (3, 10, 30, and 50 kDa cutoff) filters were purchased from EMD Millipore. Zeonor 1060R cyclic olefin copolymer (COC) was purchased in 1 and 2 mm thick sheets (Zeon Chemicals; Louisville, KY) cut to 2.2 x 5 cm pieces with an industrial bandsaw. Silicon wafers were from Fairchild (Phoenix, AZ) and S1805 photoresist came from MicroChem (Westborough, MA).
2.2 Device Fabrication
Fabrication of “T-shaped” microchips in COC was performed using methods described previously. Briefly, silicon wafers were patterned and etched using standard photolithography and etching techniques [31]. The pattern was transferred into a 1 mm thick piece of COC, which was subsequently bonded to a 2 mm thick piece of COC with corresponding reservoir holes made with a drill press (Cameron; Sonora, CA) [30,32]. Finally, cyclohexane was applied to the device edges to enhance bonding. Channel dimensions were approximately 20 μm tall x 50 μm wide. A device photograph is given in the Supporting Information in Figure S1.
Prior to μCE experiments, COC device channels were coated using a photografting method adapted from one used previously in our lab [28]. PEGDA was filtered through inhibitor remover beads to remove the methyl ether hydroquinone polymerization inhibitor. A solution of 4% PEGDA and 1% BME was made in a 50:50 (v/v) mixture of water and methanol. The channels and reservoirs were filled with this solution, and the device was exposed to UV light (Uvitron; West Springfield, MA) for 12 min then flushed twice with water to remove excess photografting solution.
2.3 PTB Biomarker Preparation
To fluorescently label the PTB biomarkers, P1, P2, and CRF were dissolved in 10 mM bicarbonate buffer (BCB, pH 10). FITC was dissolved at a concentration of 10 mM in DMSO and added to the individual biomarker solutions such that the dye-to-biomarker molar ratio was 3:2, and these solutions were incubated overnight in the dark at 37 °C. The other three biomarkers (LF, TNF, and Fer) were labeled under similar conditions except they were incubated at room temperature and with dye-to-biomarker molar ratios of 15:1, 20:1, and 30:1, respectively. All biomarkers except P1 were then filtered in the Amicon cutoff filter most closely correlated to the biomarker’s size. Each was filtered four times for 15 min at 14000 RPM to remove excess dye. The dye-to-biomarker ratios were chosen based on visual inspection of the filtrate during filtration; if most of the excess dye was not removed by the fourth iteration, the labeling dye-to-biomarker ratio was reduced. Although this was a simple method for determining an adequate dye-to-biomarker labeling ratio, the visual inspection results were well correlated with μCE data. Finally, the biomarkers were diluted in 1 mM BCB (pH 9) prior to μCE.
2.4 Instrumentation
The LIF detection system (Figure 1) had a 488 nm laser (CrystaLaser; Reno, NV) aimed into a Zeiss Axio Observer.A1 inverted microscope (Jena, Germany) fitted with a Chroma ET-488 nm laser bandpass set (Rockingham, VT). Laser power exiting the 20x microscope objective was 4.8 mW. The microscope was fitted with a Hamamatsu PMT (Bridgewater, NJ) with a Stanford Research Systems SR-560 preamplifier (Sunnyvale, CA). Analog PMT voltage signal was converted to digital using a NI USB-6212 analog-to-digital converter (ADC; National Instruments; Austin, TX) and recorded at 20 Hz using LabVIEW software (National Instruments). μCE voltages were controlled using two high voltage power supplies (Stanford Research Systems) and a custom designed voltage switching box. Platinum electrodes ran from this box to the microchip reservoirs to apply the injection and separation voltages. Microchips were operated using pinched sample loading [33] with a 60 sec injection time as described previously [34]. Separation fluorescence signal was measured 2 cm down the channel from the intersection. All separations were performed at room temperature [35–36].
Figure 1.

Schematic of LIF detection instrumentation involving a laser directed into a microscope fitted with a laser bandpass filter set, with filter wavelengths corresponding to the laser and fluorescence wavelengths. Fluoresced light exits the microscope and passes through a pinhole into the PMT creating an analog signal, which is first amplified and then converted to digital in the ADC. This digital signal is then recorded using LabVIEW software on the computer.
3 Results and Discussion
A critical component in developing a biomarker panel analysis for PTB risk is separation and quantification of these analytes. Factors that typically affect an electrophoretic separation include pH, buffer composition, surface properties, and analyte mobility. Each of these was investigated to develop a separation of this PTB biomarker panel.
Initial μCE experiments had inconsistent EOF between different COC devices. Specifically, sample continued to bleed into the separation channel from the injection arms, rather than being pulled back into the reservoirs once the separation voltage was applied. This flow was contrary to the expected direction of migration and was also observed by Sonker et al. [28], who photografted the COC surface with PEGDA to yield more reproducible EOF. We used a similar photografting method to that of Sonker et al. with two minor differences. First, the use of a water-methanol solvent in the photografting mixture yielded more reliable results than using just methanol as the solvent. Second, we used a 4% PEGDA solution: we found that 3% PEGDA was not sufficient to eliminate the undesired migration of analyte while 5% PEGDA tended to block the channels and prevent fluid flow. While these COC devices are compatible with standard 2D micromachining, we note that it is also feasible to 3D print microfluidic devices from PEGDA [37–39]. These 3D printed devices may be appealing for future analyses to avoid this photografting step.
Figure S2 shows a comparison of μCE in photografted and untreated devices. Electropherograms from photografted devices yielded a reproducible, symmetrical peak for Fer, while untreated devices yielded inconsistent results and had a rising baseline. Results from photografted devices were also comparable to electropherograms measured on a conventional CE system (Figure S3), showing the viability of these μCE devices for accurate and reproducible analyses.
For optimization experiments, we used only a representative portion of the PTB biomarkers in the separations. This simplified the electropherograms for both visualization and quantification of results. Fer was chosen because, at 470 kDa, it is the largest biomarker. Likewise, P1 was used in many of these experiments because it is the smallest biomarker (2.0 kDa). LF was chosen both for its large size (80 kDa) and high pI value; initial experiments found that biomarkers like LF and P2 with high pI values were more adsorptive to the microchannel surfaces and difficult to fluorescently label than biomarkers with lower pI values.
To test the dependence of separation efficiency on pH, two of the biomarkers, Fer and LF, were fluorescently labeled and separated in photografted COC devices at four different pHs from 7 to 10 (Figure 2). Because FITC fluorescence intensity is pH dependent (Figure S3), this range was chosen to encompass most of its fluorescent range. The results from these separations indicate that photografting largely suppressed EOF, resulting in the running buffer pH having little effect on separation efficiency. The most significant effect of running buffer pH was on the resolution of the dye peaks at the beginning of the run. Notably, the resolution of these dye peaks was greatest for the pH 8 and 10 runs. Likely, this difference is due to the higher ionic strength of these buffers compared to those at pH 7 and 9, which originates from titrating the buffer with greater amounts of NaOH to reach the desired pH. Differences in ionic strength were confirmed by monitoring the electrical current through the microchip channels during each separation, which revealed higher current for the pH 8 and 10 separations than the other two.
Figure 2.
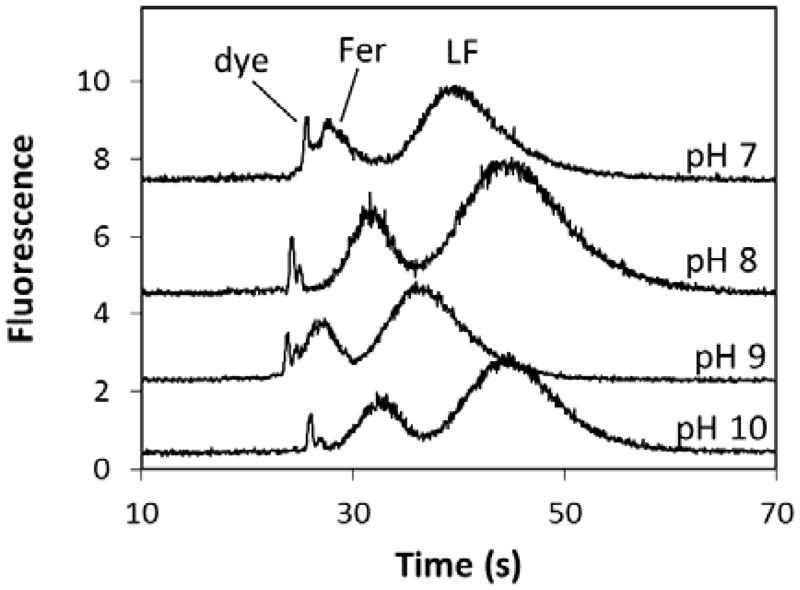
μCE of FITC-labeled Fer (10 nM) and LF (60 nM) at 500 V/cm with different running buffers: pH 7, 100 mM HEPES; pH 8, 100 mM HEPES; pH 9, 100 mM CHES; pH 10, 100 mM CHES. Signals are offset for clarity.
The results from Figure 2 suggested that our PTB biomarker separations were affected by ionic strength more than the pH of the running buffer between pH 7–10. To confirm this, separations of three biomarkers (Fer, P1, and LF) were performed with different running buffer concentrations (Figure 3). It was found that increasing the buffer concentration improved resolution for P1 and LF while diminishing the resolution for Fer and P1. It was also found that the resolution approached a maximum or minimum value as the buffer concentration continued to increase. This meant that the P1-LF resolution could be improved to a certain point without completely deteriorating the Fer-P1 resolution. However, using higher running buffer concentrations also increased the electrical current in the microchannels, which could lead to Joule heating and other deleterious effects. To balance improved P1-LF resolution with reasonable electrical current, a running buffer concentration of 100 mM was used for later experiments. While a resolution of 0.5 for P1-LF is enough to distinguish these peaks, it may not be sufficient to precisely quantitate these two biomarkers.
Figure 3.
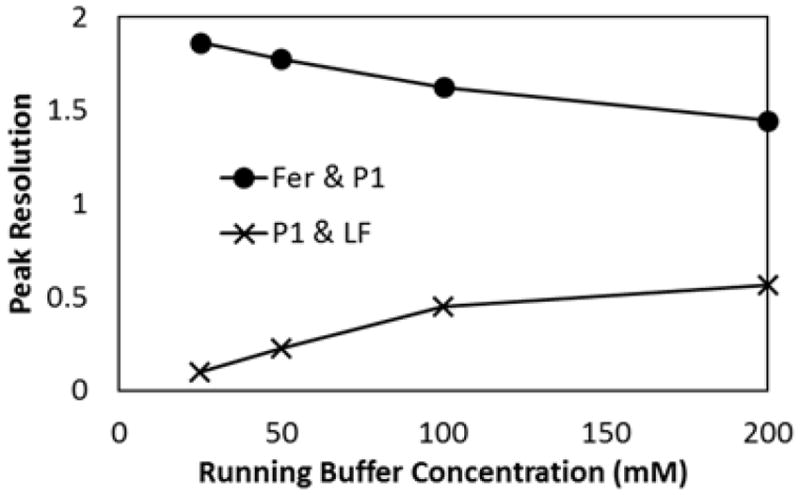
Resolution of Fer, P1, and LF with changing running buffer concentration. Separations were performed in HEPES buffer (pH 8) at 500 V/cm.
Another factor known to affect electrophoretic separation resolution and Joule heating is the applied voltage [40–41]. Separations were performed with the same three PTB biomarkers (Fer, P1, and LF) and 100 mM HEPES buffer having 0.5% HPC (pH 8) using different applied voltages. Figure 4A shows that increasing the applied voltage did not significantly affect the P1-LF resolution but did decrease the Fer-P1 resolution. As can be seen, if the applied voltage was doubled, the Fer-P1 resolution decreased by about a factor of two. The added HPC in the buffer increased viscosity and narrowed the biomarker peaks by reducing any residual biomarker-microchannel surface interactions that persisted after photografting. This improved the P1-LF resolution but resulted in closer Fer-P1 migration times, which degraded the Fer-P1 resolution.
Figure 4.

Effect of voltage on PTB biomarker separations. (A) Resolution of Fer and P1, and P1 and LF as a function of electric field. (B) Separation run time as a function of electric field. Separations were performed in 100 mM HEPES (pH 8) with 0.05% HPC.
Besides affecting peak resolution, increasing the applied electric field decreased the migration times of all analytes, as expected (Figure 4B). Higher electric field allows for a PTB analysis to be performed more quickly and limits the time in which diffusional band broadening can occur. To balance these benefits with the decreasing Fer-P1 resolution, 500 V/cm was applied to the microchannels in future separations. This allowed us to separate the PTB biomarkers in under one minute while maintaining satisfactory resolution between the biomarker peaks.
The conditions selected for our separation of the PTB biomarker panel were a photografted COC microchip run at 500 V/cm with a 100 mM running buffer of any pH between 7 and 10 at room temperature. Using these conditions, it was possible to separate six of the PTB biomarkers (Figure 5): Fer, P1, LF, P2, CRF, and TNF. This separation is significant because it is the first μCE separation of most of the components of this biomarker panel. It is also significant because of the large mass range of analytes in the panel—from 2 to 470 kDa. Finally, most protein μCE separations contain three or fewer (often model) analytes [42]; this separation contains three peptides in addition to three proteins that are implicated in PTB.
Figure 5.

μCE of six PTB biomarkers labeled with FITC: Fer, 60 nM; P2, 130 nM; P1, 10 nM; CRF, 60 nM; LF, 60 nM; TNF, 140 nM. Running buffer was 100 mM CHES (pH 9) with 0.05% HPC; separation at 500 V/cm.
Several additional points arise from the electropherogram in Figure 5. First, P2 produced two peaks, which is attributed to an N-terminal asparagine (see Table S1) that degrades in water to aspartic acid. Although it is possible to synthetically block the N-terminus to prevent this degradation, we left it uncapped to more closely simulate a clinical sample. Moreover, the larger protein biomarkers had broader peaks than the smaller peptide biomarkers in the electropherogram. This is likely due to the greater number of fluorescent labeling sites available, resulting in a broader distribution of charges on these proteins. The LF peak in particular is broad both because of this charge distribution and its high pI value, which makes it more prone to microchip surface adsorption than the other biomarkers. Finally, peak overlap occurs in some regions of the separation, which could hinder quantitation especially for real samples. Importantly, upstream sample preparation steps prior to μCE can be integrated on-chip for analyzing real samples. Indeed, we showed that after on-chip immunoaffinity extraction of serum samples, μCE data were comparable to results obtained from the same biomarkers in buffer [30]. Moreover, upstream immunoaffinity extraction can be used to divide a biomarker panel to have any interfering biomarkers (i.e., CRF and LF) split into separate μCE runs for easier quantitation.
Of the nine PTB biomarkers in the panel [13], three were omitted from the final separation: P3, Def, and TAT. P3 was excluded because its amino acid sequence is nearly identical to that of P2; the only difference is where P2 contains a methionine, P3 contains an oxidized methionine (Table S1). As this oxidation contributes neither a significant charge nor mass difference to the peptide, we found P2 and P3 to have indistinguishable electrophoretic mobilities, and only one was included in the biomarker separation. Def was excluded because it represents several different peptides [8]; its electropherogram had multiple peaks which interfered with the signal from other PTB biomarkers. We are working to identify which specific Def peptide has the best diagnostic potential so it can be added to the biomarker separation. Finally, TAT was not included in this separation because it is not available commercially, and it is difficult to form the TAT complex under conditions where fluorescent labeling is also feasible. As we develop appropriate conditions, this biomarker could be added to the separation.
It is important to know how the LOD of each PTB biomarker compares with PTB risk levels. Peak height calibration curves were established for each biomarker on three different microchips (Figure 6). An LOD, the concentration at which the measured signal was three times the standard deviation of the baseline noise, was calculated for each of these calibration curves. As seen in Table 2, the LOD for each of the biomarkers is in the nanomolar range. Except for P1, the trend is for the larger mass biomarkers to have a lower molar LOD. Likely, this is because larger biomarkers such as Fer and LF have more primary amines for reaction with FITC, resulting in multiple labels being incorporated per protein. In contrast, smaller biomarkers such as P2 and CRF, which contain a single primary amine labeling site (the N-terminus), can only incorporate one label [29]. In addition, the LOD for P2 is significantly higher than that of the other PTB biomarkers because its tertiary structure creates steric hindrance around the N-terminus, which reduces the FITC-labeling efficiency [43]. Although the efficiency was improved by heating the biomarker solution during labeling, P2 still has a higher LOD than the other biomarkers.
Figure 6.

Calibration curves for LOD determination for six PTB biomarkers. Data from the devices that yielded the lowest LOD for each biomarker are shown.
Table 2.
Migration time, calibration curve linear regression (R2), and the mean LOD (all determined from 3 different devices) for six PTB biomarkers. PTB risk levels where known are also given for reference. Running buffer was 100 mM HEPES (pH 8) with 0.05% HPC.
| PTB Biomarker | Migration Time (s) | Calibration R2 | LOD (nM) | PTB Risk Level (nM) |
|---|---|---|---|---|
| P1 | 36.7 ± 2.0 | 0.97 ± 0.03 | 3 | * |
| P2 | 34.7 ± 1.6 | 0.99 ± 0.01 | 190 | * |
| CRF | 44.4 ± 4.3 | 0.92 ± 0.11 | 90 | 0.075 |
| TNF | 61.5 ± 3.6 | 0.99 ± 0.01 | 30 | 0.06 |
| LF | 47.8 ± 3.1 | 0.97 ± 0.05 | 6 | 3 |
| Fer | 31.4 ± 1.3 | 0.96 ± 0.01 | 1 | 0.040 |
Concentration indicating PTB risk is not known.
Table 2 also lists the biomarker concentrations in maternal blood serum [13] that are indicative of PTB risk. Our LODs are approaching PTB risk levels for some biomarkers, but they are not as low as will be necessary for PTB risk analysis. Importantly, by using on-chip sample preparation steps prior to separation of the biomarkers, we should be able to detect these PTB biomarkers below their risk levels. Using immunoaffinity extraction from blood serum [30] and SPE [27–29] as described previously, we should be able to achieve 6-fold and 50-fold preconcentrations, respectively, for a combined 300-fold enrichment of the biomarkers. These enrichment factors should lower the biomarker LODs to near or below the risk level concentrations. We also expect further improvement of preconcentration capabilities as these components are integrated into a single device.
4 Concluding Remarks
There is an urgent need for a fast and inexpensive PTB risk diagnostic. This need could be met by developing a microfluidic device that integrates sample preparation with separation and detection of PTB risk biomarkers. Here, we have focused on the separation and detection of a panel of PTB biomarkers. We studied the dependence of peak resolution on the running buffer concentration and electric field. The dependence required a balance of parameters to be considered to improve the poorest resolution between peaks without significantly deteriorating others. Furthermore, we demonstrated a μCE separation for six combined protein and peptide biomarkers: the first performed on this biomarker panel. Additional experiments should make it possible to add other biomarkers to this separation.
Some of our PTB biomarker LODs are approaching PTB risk levels, but lower detection limits are still needed. It may be possible to achieve this using CE-LIF or CE-MS, but these methods would require larger sample volumes and external sample preparation prior to analysis. Using the current approach, lower biomarker LODs could be achieved via integration of our μCE separation with upstream sample preparation steps that extract, purify, and enrich biomarkers [27–30] from maternal blood serum samples. Additionally, biomarker LODs could be lowered by implementing sample stacking prior to μCE [44–45], improving the labeling efficiency [43,46], or use of a brighter fluorescent label such as Alexa Fluor [47–48]. Once developed, such an integrated device has broad potential to be applied to many other clinical biomarker analyses.
Supplementary Material
Acknowledgments
We thank the National Institutes of Health (R01 EB006124), a Roland K. Robins graduate research fellowship through the Department of Chemistry and Biochemistry at Brigham Young University granted to Anna Nielsen, and an Undergraduate Research Assistantship from Brigham Young University granted to Jacob Nielsen for financial support of this work. We also thank the Integrated Microfabrication Lab at Brigham Young University for use of their facilities.
List of abbreviations
- BME
benzoin methyl ether
- BCB
bicarbonate buffer
- CRF
corticotropin releasing factor
- COC
cyclic olefin copolymer
- Def
defensins
- ADC
analog-to-digital converter
- Fer
ferritin
- HPC
hydroxypropyl cellulose
- LF
lactoferrin
- μCE
microchip electrophoresis
- PEGDA
polyethylene glycol diacrylate
- PTB
preterm birth
- P1
preterm birth peptide 1
- P2
preterm birth peptide 2
- P3
preterm birth peptide 3
- TAT
thrombin-antithrombin III
- TNF
tumor necrosis factor-α receptor type 1
References
- 1.World Health Organization. Born too soon: the global action report on preterm birth. WHO; Geneva: 2012. [Google Scholar]
- 2.Simon L, Nusinovici S, Flamant C, Cariou B, Rouger V, Gascoin G, Darmaun D, Rozé JL, Hanf M. PLoS ONE. 2017;12:e0174645. doi: 10.1371/journal.pone.0174645. [DOI] [PMC free article] [PubMed] [Google Scholar]
- 3.Institute of Medicine of the National Academies. Preterm birth: causes, consequences, and prevention. IOM; Washington, DC: 2006. [Google Scholar]
- 4.Roberts D, Brown J, Medley N, Dalziel SR. Cochrane Data Sys Rev. 2017:CD004454. doi: 10.1002/14651858.CD004454.pub3. [DOI] [PMC free article] [PubMed] [Google Scholar]
- 5.Wigle DT, Arbuckle TE, Turner MC, Bérubé A, Yang Q, Liu S, Krewski D. J Tox Envir Health B. 2008;11:373–517. doi: 10.1080/10937400801921320. [DOI] [PubMed] [Google Scholar]
- 6.Kramer MS, Lydon J, Séguin L, Goulet L, Kahn SR, NcNamara H, Genest J, Dassa C, Chen MF, Sharma S, Meaney MJ, Thomson S, Uum SV, Koren G, Dahhou M, Lamoureux J, Platt RW. Am J Epidemiol. 2009;169:1319–1326. doi: 10.1093/aje/kwp061. [DOI] [PubMed] [Google Scholar]
- 7.Goldenberg RL, Rouse DJ. N Engl J Med. 1998;339:313–320. doi: 10.1056/NEJM199807303390506. [DOI] [PubMed] [Google Scholar]
- 8.Goldenberg RL, Iams JD, Mercer BM, Meis PJ, Moawad A, Das A, Miodovnik M, VanDorsten PJ, Caritis SN, Thurnau G, Dombrowski MP. Am J Obstet Gynecol. 2001;185:643–651. doi: 10.1067/mob.2001.116752. [DOI] [PubMed] [Google Scholar]
- 9.Al-Gubory KH, Fowler PA, Garrel C. Int J Biochem Cell Biol. 2010;42:1634–1650. doi: 10.1016/j.biocel.2010.06.001. [DOI] [PubMed] [Google Scholar]
- 10.Buhimschi IA, Christner R, Buhimschi CS. BJOG. 2005;112:173–181. doi: 10.1111/j.1471-0528.2004.00340.x. [DOI] [PubMed] [Google Scholar]
- 11.Fortunato SJ, Menon R. Am J Obstet Gynecol. 2001;184:1399–1406. doi: 10.1067/mob.2001.115122. [DOI] [PubMed] [Google Scholar]
- 12.Petraglia F, Imperatore A, Challis JRG. Endocrine Reviews. 2010;31:783–816. doi: 10.1210/er.2009-0019. [DOI] [PubMed] [Google Scholar]
- 13.Esplin MS, Merrell K, Goldenberg R, Lai Y, Iams JD, Mercer B, Spong CY, Miodovnik M, Simhan HN, van Dorsten R, Dombrowski M. Am J Obstet Gynecol. 2011;204:391.e1–8. doi: 10.1016/j.ajog.2010.09.021. [DOI] [PMC free article] [PubMed] [Google Scholar]
- 14.Grebe SKG, Singh RJ. Clin Biochem Rev. 2011;32:5–31. [PMC free article] [PubMed] [Google Scholar]
- 15.Cross TG, Hornshaw MP. J Appl Bioanal. 2016;2:108–116. [Google Scholar]
- 16.Yager P, Edwards T, Fu E, Helton K, Nelson K, Tam MR, Weigl BH. Nature. 2006;442:412–418. doi: 10.1038/nature05064. [DOI] [PubMed] [Google Scholar]
- 17.Nge PN, Rogers CI, Woolley AT. Chem Rev. 2013;113:2550–2583. doi: 10.1021/cr300337x. [DOI] [PMC free article] [PubMed] [Google Scholar]
- 18.Mark D, Haeberle S, Roth G, von Stetten F, Zengerle R. Chem Soc Rev. 2010;39:1153–1182. doi: 10.1039/b820557b. [DOI] [PubMed] [Google Scholar]
- 19.Ohno K-i, Tachikawa K, Manz A. Electrophoresis. 2008;29:4443–4453. doi: 10.1002/elps.200800121. [DOI] [PubMed] [Google Scholar]
- 20.Pandey CM, Augustine S, Kumar S, Kumar S, Nara S, Srivastava S, Malhotra BD. Biotechnol J. 2018;13:1700047. doi: 10.1002/biot.201700047. [DOI] [PubMed] [Google Scholar]
- 21.Sonker M, Sahore V, Woolley AT. Anal Chim Acta. 2017;986:1–11. doi: 10.1016/j.aca.2017.07.043. [DOI] [PMC free article] [PubMed] [Google Scholar]
- 22.Garg N, Vallejo D, Boyle D, Nanayakkara I, Teng A, Pablo J, Liang X, Camerini D, Lee AP, Felgner P. Procedia Eng. 2016;159:53–57. [Google Scholar]
- 23.Tang CK, Vaze A, Shen M, Rusling JF. ACS Sens. 2016;1:1036–1043. doi: 10.1021/acssensors.6b00256. [DOI] [PMC free article] [PubMed] [Google Scholar]
- 24.Liu D, Li X, Zhou J, Liu S, Tian T, Song Y, Zhu Z, Zhou L, Ji T, Yang C. Biosens Bioelectron. 2017;96:332–338. doi: 10.1016/j.bios.2017.04.044. [DOI] [PubMed] [Google Scholar]
- 25.Ali MA, Mondal K, Jiao Y, Oren S, Xu Z, Sharma A, Dong L. ACS Appl Mater Interfaces. 2016;8:20570–20582. doi: 10.1021/acsami.6b05648. [DOI] [PubMed] [Google Scholar]
- 26.Uludag Y, Narter F, Sağlam E, Köktürk G, Gök MY, Akgün M, Barut S, Budak S. Anal Bioanal Chem. 2016;408:7775–7783. doi: 10.1007/s00216-016-9879-z. [DOI] [PubMed] [Google Scholar]
- 27.Kumar S, Sahore V, Rogers CI, Woolley AT. Analyst. 2016;141:1660–1668. doi: 10.1039/c5an02352a. [DOI] [PMC free article] [PubMed] [Google Scholar]
- 28.Sonker M, Knob R, Sahore V, Woolley AT. Electrophoresis. 2017;38:1743–1754. doi: 10.1002/elps.201700054. [DOI] [PMC free article] [PubMed] [Google Scholar]
- 29.Sahore V, Sonker M, Nielsen AV, Knob R, Kumar S, Woolley AT. Anal Bioanal Chem. 2018;410:933–941. doi: 10.1007/s00216-017-0548-7. [DOI] [PMC free article] [PubMed] [Google Scholar]
- 30.Sonker M, Parker EK, Nielsen AV, Sahore V, Woolley AT. Analyst. 2018;143:224–231. doi: 10.1039/c7an01357d. [DOI] [PMC free article] [PubMed] [Google Scholar]
- 31.Kelly RT, Woolley AT. Anal Chem. 2003;75:1941– 1945. doi: 10.1021/ac0262964. [DOI] [PubMed] [Google Scholar]
- 32.Nge PN, Pagaduan JV, Yu M, Woolley AT. J Chromatogr A. 2012;1261:129–135. doi: 10.1016/j.chroma.2012.08.095. [DOI] [PMC free article] [PubMed] [Google Scholar]
- 33.Jacobson SC, Hergenröder R, Koutny LB, Warmack RJ, Ramsey JM. Anal Chem. 1994;66:1107–1113. [Google Scholar]
- 34.Sonker M, Yang R, Sahore V, Kumar S, Woolley AT. Anal Meth. 2016;8:7739–7746. doi: 10.1039/C6AY01803C. [DOI] [PMC free article] [PubMed] [Google Scholar]
- 35.Guttman A, Kerekgyarto M, Jarvas G. Anal Chem. 2015;87:11630–11634. doi: 10.1021/acs.analchem.5b03727. [DOI] [PubMed] [Google Scholar]
- 36.Szigeti M, Guttman A. Anal Chem. 2017;89:2201–2204. doi: 10.1021/acs.analchem.7b00016. [DOI] [PubMed] [Google Scholar]
- 37.Beauchamp MJ, Nordin GP, Woolley AT. Anal Bioanal Chem. 2017;409:4311–4319. doi: 10.1007/s00216-017-0398-3. [DOI] [PMC free article] [PubMed] [Google Scholar]
- 38.Gong H, Bickham BP, Woolley AT, Nordin GP. Lab Chip. 2017;17:2899–2909. doi: 10.1039/c7lc00644f. [DOI] [PMC free article] [PubMed] [Google Scholar]
- 39.Gong H, Woolley AT, Nordin GP. Lab Chip. 2018;18:639–647. doi: 10.1039/c7lc01113j. [DOI] [PMC free article] [PubMed] [Google Scholar]
- 40.Jacobson SC, Hergenröder R, Koutny LB, Ramsey JM. Anal Chem. 1994;66:1114–1118. [Google Scholar]
- 41.Tang GY, Yang C, Chai JC, Gong HQ. Int J Heat Mass Transfer. 2004;47:215–227. [Google Scholar]
- 42.Dawod M, Arvin NE, Kennedy RT. Analyst. 2017;142:1847–1866. doi: 10.1039/c7an00198c. [DOI] [PMC free article] [PubMed] [Google Scholar]
- 43.Kumar S. PhD Dissertation. Brigham Young University; Utah: 2015. Design, Fabrication, and Optimization of Miniaturized Devices for Bioanalytical Applications; pp. 84–102. [Google Scholar]
- 44.Breadmore MC. Electrophoresis. 2007;28:254–281. doi: 10.1002/elps.200600463. [DOI] [PubMed] [Google Scholar]
- 45.Shihabi ZK. J Chromatogr A. 2000;902:107–117. doi: 10.1016/s0021-9673(00)00743-3. [DOI] [PubMed] [Google Scholar]
- 46.Goding JW. J Immunol Meth. 1976;13:215–226. doi: 10.1016/0022-1759(76)90068-5. [DOI] [PubMed] [Google Scholar]
- 47.Panchuk-Voloshina N, Haugland RP, Bishop-Stewart J, Bhalgat MK, Millard PJ, Mao F, Leung WY, Haugland RP. J Histochem Cytochem. 1999;47:1179–1188. doi: 10.1177/002215549904700910. [DOI] [PubMed] [Google Scholar]
- 48.Mahmoudian J, Hadavi R, Jeddi-Tehrani M, Mahmoudi AR, Bayat AA, Shaban E, Vafakhah M, Darzi M, Tarahomi M, Ghods R. Cell J. 2011;13:169–172. [PMC free article] [PubMed] [Google Scholar]
Associated Data
This section collects any data citations, data availability statements, or supplementary materials included in this article.