

Abstract
In human and murine studies, IFN-γ is a critical mediator immunity to influenza. IFN-γ production is critical for viral clearance and the development of adaptive immune responses, yet excessive production of IFN-γ and other cytokines as part of a cytokine storm is associated with poor outcomes of influenza infection in humans. As natural killer (NK) cells are the main population of lung innate immune capable of producing IFN-γ early in infection, we set out to identify the drivers of the human NK cell IFN-γ response to influenza A viruses. We found that influenza triggers NK cells to secrete IFN-γ in the absence of T cells and in a manner dependent upon signaling from both cytokines and receptor-ligand interactions. Further, we discovered that the pandemic A/California/07/2009 (pH1N1: Cal/09) strain elicits a 7-fold greater IFN-γ response than other strains tested including a seasonal A/Victoria/361/2011 (H3N2: Vic/11) strain. These differential responses were independent of memory NK cells. Instead, we discovered that the Vic/11 influenza strain suppresses the NK cell IFN-γ response by downregulating NK activating ligands CD112 and CD54 and by repressing the type I IFN response in a viral-replication dependent manner. In contrast, the Cal/09 strain fails to repress the type I IFN response or to downregulate CD54 and CD112 to the same extent, which leads to the enhanced NK cell IFN-γ response. Our results indicate that influenza implements a strain-specific mechanism governing NK cell production of IFN-γ and identify a previously unrecognized influenza innate immune evasion strategy.
Introduction
Influenza A virus is a major human pathogen, infecting 5–15% of the human population each year with upper respiratory tract infections and causing 3–5 million cases of severe illness and up to 650 000 deaths per year (1). In animal models, peripheral natural killer (NK) cells traffic to the lung following infection with influenza A virus and NK cell signature genes are readily detectable at the innate immune phase, peaking at five days post-infection (2–5). NK cells are innate lymphocytes that make up 10% of resident lymphocytes in the lung, defend from viral infection by limiting viral replication and provide an early source of cytokines to regulate the adaptive immune response (2, 5–7). Mice depleted of NK cells display increased morbidity, mortality, and fail to induce influenza A virus-specific cytotoxic T lymphocytes after sublethal influenza challenge, suggesting a protective role for NK cells (8, 9). On the other hand, separate studies reported NK cell-deficient IL-15−/− mice or NK cell-depleted mice had reduced pulmonary inflammation and mortality after lethal-dose influenza infection (10, 11), suggesting NK cells may exacerbate immunopathology. Human NK cells are also found in healthy lungs and are further recruited to the lung during influenza infection (12). In humans, NK cell deficiency strongly correlates with severe influenza infection. Previous studies found patients with severe influenza infection had a near complete lack of tissue-resident pulmonary NK cells (13, 14) and peripheral NK cells (15). A study conducted during the 2009 H1N1 pandemic found that 100% of subjects with severe infection developed NK cell lymphopenia, compared with 13% of subjects with mild infection (16). Together these murine and human studies suggest NK cell have a dual potential – to both enhance and hinder recovery from influenza infection – highlighting the need to understand the elements governing the quality and quantity of the NK cell response to influenza.
Among the cytokines secreted by NK cells, IFN-γ was found to be critical for inducing the anti-influenza adaptive immune responses and viral clearance (3) and treatment of mice early with IFN-γ early influenza infection leads to a lower likelihood of death in an NK cell-dependent manner (17). In humans, NK cells were reported to be a significant source of IFN-γ following influenza virus vaccination (18) and interferon-responsive genes are a major component of the “Influenza Metasignature”, a recently described transcriptional signature predictive of influenza infection in humans (19). Moreover, in human infection, particularly with pandemic strains, the magnitude of the cytokine response predicts disease severity (20–25). Indeed, infection with the swine-origin pandemic A/California/04/09 H1N1 isolate led to higher levels of IFN-γ in the lungs of mice compared with a seasonal H1N1 virus (A/Kawasaki/UTK-4/09) (21). These data highlight the importance of identifying the strain-specific drivers of NK cell activation as this is a critical mediator of the balance between a protection and immunopathology in vivo.
NK cell activation is tightly regulated by multiple germline-encoded inhibitory and activating receptors (26–28). Human NK cell inhibitory receptors recognize HLA class I and restrain NK cell activity upon interaction with healthy cells (29). When infected or malignant cells down-regulate HLA class I, these cells fail to deliver an inhibitory signal to NK cells, decreasing the threshold for NK cell activation (29–31). Inhibitory receptors specific for HLA class I “educate”, “license”, or “arm” NK cells, conferring an enhanced state of responsiveness (32–36). Earlier studies reported influenza A infection upregulates and re-organizes HLA class I molecules (37). NK cells also express activating receptors such as NKG2D, CD226, and NKp46, which recognize cellular ligands upregulated during infection or malignancy (31, 38). Certain viral ligands have been reported for NK cell receptors, including recognition of hemagglutinin by the NK cell cytotoxicity receptor NKp46 (39, 40). In addition to activation through cell surface receptor-ligand interactions, NK cells express numerous cytokine receptors and are thus highly sensitive to the cytokine milieu (41–43). Collectively, appropriate integration of receptor-ligand and cytokine-mediated signaling is critical for NK cells to spare normal cells while maintaining their capacity to rapidly and robustly respond to infected or malignant cells (27, 33). However, the role of cellular NK cell activating ligands and cytokines in recognition of influenza and whether these differ between influenza virus subtypes to influence NK cell activity remains unknown.
Here we investigate the receptor-ligand and cytokine-mediated signals governing human NK cell cytokine production in response to cells infected with influenza A strains. In this study, we selected an autologous NK cell-monocyte co-culture system human to overcome the challenge posed by the mouse model of influenza – murine NK cell receptors lack homology with certain human NK cell receptors and mouse-adapted influenza strains may not accurately reflect human influenza isolates (44–46). Using RNA-sequencing and single cell mass cytometry, we profiled modulation of host gene expression and NK cell ligand expression by the 2009 pandemic H1N1 strain compared with a seasonal 2011 H3N2 strain (hereafter Cal/09 and Vic/11). Together, these approaches demonstrated modulation of the type I interferon receptor (IFNAR) pathway and expression of NK cell activating ligands CD54 and CD112 govern the magnitude of NK cell IFN-γ response to influenza A viruses.
Materials and Methods
Virus Production and Titration
A/Victoria/361/2011(Vic/11; H3N2), A/California/07/2009 (Cal/09: H1N1), A/Bayern/7/1995 (Bay/95; H1N1) (Influenza Reagent Resource), A/Beijing/32/1992 (Beij/92; H3N2), A/Hong Kong/1/68 (HK/68; H3N2) and A/Melbourne/1/1946 (Mel/46; H1N1) were propagated in 10-day-old specific pathogen-free embryonated chicken eggs (Charles River Laboratories International, Inc.) at 35°C and 55–65% humidity. Allantoic fluid was harvested 48 hours post-infection. Each Vic/11 and Cal/09 batch was grown from a seed stock and multiple batches were tested. A/Puerto Rico/8/34 (H1N1) was grown in Madin-Darby canine kidney (MDCK) cells. Infectious influenza titer was determined by standard plaque assay on MDCK cells in the presence of 2 µg/mL L-1-tosylamido-2-phenylethyl chloromethyl ketone (TPCK)-treated trypsin. Influenza A virus inactivation was performed by delivering 1800 mJ of UV light (254 nm) using a Stratalinker 1800 (Stratagene, La Jolla, Calif.); inactivation was verified by MDCK plaque assay.
Cell purification, Stimulation, and Infection
Experiments were performed using peripheral blood mononuclear cells (PBMCs) or cord blood mononuclear cells (CBMCs) isolated using Ficoll-Paque (GE Healthcare) density gradient centrifugation from whole blood and cryopreserved in 90% (vol/vol) FBS (Thermo Fisher Scientific) plus 10% (vol/vol) dimethyl sulfoxide (Sigma-Aldrich). Cryopreserved PBMCs were thawed and washed with RPMI (Thermo Fisher Scientific) supplemented with 10% (vol/vol) FBS (Thermo Fisher Scientific) and 50 U/mL benzonase (EMD Millipore). NK cells and monocytes were purified by magnetic-activated cell sorting via negative selection (Miltenyi). PBMCs were cultured in RPMI 1640 (Invitrogen) supplemented with 10% fetal bovine serum (FBS) + 2 mM L-glutamine + antibiotics [penicillin (100 U/ml), streptomycin (100 mg/ml); Life Technologies] at 37°C with 5% CO2. For influenza infections, monocytes were washed and re-suspended in serum-free media at 0.75 × 10^6 per 100 µL and infected at a multiplicity of infection (MOI) of 3 for 1 h at 37°C with 5% CO2. At 1 HPI, viral inoculum was removed and cells were re-suspended in 200 µL of RPMI supplemented with 10% FBS + antibiotics [penicillin (100 U/ml), streptomycin (100 mg/ml)] with autologous NK cells. After a further 2 or 19 hour incubation, 2 µM monensin, 3 µg/mL brefeldin A (eBioscience), and anti-CD107a-allophycocyanin-H7 (BD Pharmingen) were added to the co-culture for 4 hours. PMA/ionomycin cell stimulation cocktail (eBioscience) was used as a positive control for CD107a and cytokine production. EDTA (Hoefer) was added at a final concentration of 1.66 mM for 10 min to arrest stimulation. In trans-well experiments, NK cells and monocytes were separated during culture by a semipermeable membrane of 0.4-µm pore size (Corning). Normal human primary Bronchial/Tracheal epithelial cells (NHBE) (ATCC® PCS-300–010) were maintained using airway epithelial cell basal medium (ATCC® PCS-300–030) supplemented with a bronchial epithelial cell growth kit (ATCC® PCS-300–040).
Flow Cytometry
Cells were stained with LIVE/DEAD fixable Aqua Stain (Life Technologies), followed by surface staining with anti-CD56-phycoerythrin-Cy7, and then fixed and permeabilized with FACS Lyse and FACS Perm II (BD Pharmingen) according to the manufacturer’s instructions. Cells were stained with anti-CD3-phycoerythrin (clone: OKT3; BioLegend), anti-CD16-PerCP-Cy5.5 (clone: 3G8; BioLegend), anti-IFN-γ-violet-450 (clone: B27; BD Biosciences), anti-nucleoprotein-fluorescein isothiocyanate (clone: AA5H; abcam) and anti-CD7-allophycocyanin (clone: 6B7; BioLegend) and fixed using 1% paraformaldehyde. Ligand staining was performed after blocking in Human TruStain FcX™ Fc receptor blocking solution (BioLegend) according to the manufacturer’s instructions followed by staining with CD54-PE (clone: HA58; BioLegend) or CD112-PE (clone: Tx31; BioLegend). Uncompensated data were collected using a three-laser MACSQuant® Analyser (Miltenyi Biotec). Analysis and compensation were performed using FlowJo™ flow-cytometric analysis software, version 9.9.4 (Tree Star). Fluorescently activated cell sorting to deplete T cells was performed using a BD FACS Aria instrument. Viral suppression was calculated as [% Flu-NP+ in pure monocytes - % Flu-NP+ in monocytes + NK cells) / (% Flu-NP+ in pure monocytes) x 100]. CD112/CD54High and CD112/CD54Low monocyte sorting was performed using CD54-FITC (clone: HA58; BioLegend) and CD112-PE (clone: Tx31; BioLegend) using a Sony SH800 instrument.
RNA isolation and RT-qPCR
RNA was isolated at the indicated time points from either co-culture (RT-qPCR) or re-isolated monocytes (RNA-seq) using RNA-Bee (Tel-Test) according to the manufacturer’s instructions. For RT-qPCR, total RNA was reverse transcribed using SuperScript® VILO™ cDNA synthesis kit (Thermo Scientific) followed by triplicate qPCR reactions using IFNG (IFNG Taqman Gene Expression Assay, Life Technologies 4331182) or Flu-Matrix transcript-specific primers to an identical region in the Cal/09 and Vic/11 strains with the TaqMan Universal Master Mix II on a StepOne™ Plus Real-Time PCR system (Applied Biosytems) (Matrix primers Forward: 5’ - CTT CTA ACC GAG GTC GAA ACG TA-3’, Reverse: 5’- TTG GTC TTG TCT TTA GCC ATT CCA - 3’). Averaged triplicate levels of RT-qPCR results were normalized to GAPDH average duplicate levels. Relative fold inductions were calculated using the ∆∆Ct formula.
RNA sequencing and Statistical Analysis
RNA was extracted from monocytes re-isolated from co-culture using negative magnetic selection. RNA was quality checked by Agilent 2101 Bioanalyzer followed by TruSeq cDNA library preparation and paired-end 75-bp mRNA-seq RNA-sequencing on the Illumina NextSeq platform. The raw influenza sequencing reads were aligned using STAR (47) to the influenza genome of each strain downloaded from the Influenza Research Database (A/California/07/09 (Cal/09), CY121687; A/Vic/361/2011 (Vic/11), KJ942683). The raw human sequencing reads were aligned to the Genome Reference Consortium Human Build 38 genome, downloaded from the Illumina web server. Alignment was performed using Bowtie2 (48) and TopHat (49) to produce a parsimonious transcriptome assembly. The differential transcriptome assembly was analyzed using the DEseq2 R package from Bioconductor (50, 51) and differentially expressed genes were mapped to known protein-protein networks derived from the STRING (Search Tool for the Retrieval of Interacting Genes/Proteins) database using the BioNet R package from Bioconductor (52–54). Data supporting this publication is downloadable from GEO (https://www.ncbi.nlm.nih.gov/geo/) under study accession GSE117828.
Quantification of Cytokine Production
The concentration of cytokines in supernatants following cell stimulation was assessed in triplicate using the cytokine multiplex technology by Luminex® according to manufacturer’s instructions using 100 µl of neat supernatant. Results are expressed as mean fluorescence intensities (MFI). IFN-α concentration was quantified by Luminex® (n = 3) and three donors by sandwich enzyme-linked immunosorbent assay (ELISA) using the VeriKine human IFN-α ELISA Kit (PBL Biomedical Laboratories) and calibrated from the international reference standard for Hu-IFN-α provided by the National Institutes of Health. IFN-γ concentration was quantified using the IFN-γ Human ELISA kit (Thermo Fisher Scientific).
Staining and Mass Cytometry Acquisition
Antibodies were conjugated using Maxpar X8 labeling kits (DVS Sciences) and titered to determine the optimum concentration. To ensure consistent staining across experiment, the antibodies were then mixed and lyophilized into single reaction pellets (Biolyph, LLC), with the exception of CD19-Qdot® 655 conjugate, which was added separately. Detailed staining protocols have been described (55–58). Briefly, cells were live-dead stained with 25 µM cisplatin (Enzo Life Sciences), followed by surface staining for 30 min at 4°C with rehydrated lyospheres containing the surface antibodies, fixed, permeabilized, and stained with rehydrated lyospheres containing the intracellular antibodies for 45 min at 4°C (59). The staining panel is listed in Table SIII. Cells were fixed overnight in iridium-191/193 intercalator (DVS Sciences) and washed 1× in PBS and 3× in Milli-Q® H2O before acquisition on a Helios mass cytometer (Fluidigm Corp., South San Francisco). The data was normalized using EQ™ Four Element Calibration Beads (Fluidigm Corp., South San Francisco) using the Normalizer v0.1 MCR (60). Gating was performed using FlowJo™ flow-cytometric analysis software, version 10.2 (Tree Star). Data supporting this publication is downloadable from ImmPort (immport.org) under study accession SDY1371.
Receptor Blocking Tests
NK cells were pre-incubated with mAbs antibodies specific to CD226/DNAM-1 (clone: 11A8, BioLegend), CD11a (clone: TS1/22, Thermo Fisher Scientific) at a final concentration of 10 μg/mL or with the matched isotype control (BioLegend, mouse IgG1, κ isotype clone: MOPC-21) for 1 h prior to co-culture. Mouse IgG1, κ anti-IFN-α antibody (clone: ST29, abcam) and anti-human IL-18 R α/IL-1 R5 Antibody (clone: 70625, R&D Systems) were used at a final concentration at 2.5 µg/ml. IL-12Rβ2 Ab (Cat #: AF1959-SP, R&D Systems) was used at a final concentration of 83.33 µg/mL. Goat polyclonal to human IL-15R (Cat #: PA5–46991, Thermo Fisher Scientific) and goat IgG isotype control antibody (Cat#: 31245, Thermo Fisher Scientific) were used at a final concentration of 4 µg/mL. Mouse IgG1, κ anti-human CD119 IFN-γ receptor chain (clone: GIR-208, BD Pharmingen) was used at a final concentration of 50 µg/mL. Human IFN-γ monoclonal antibody (clone: NIB42, eBioscience) was used at a final concentration of 4 µg/mL. Purified NA/LE Rat anti-human IL-2 (clone MQ1–17H12, BD Pharmingen) and purified NA/LE Rat isotype control (clone: R35–95, BD Pharmingen) were used at a final concentration of 4 µg/mL. Recombinant human IL-2 protein (Cat# 202-IL-010, R&D Systems) was added at a final concentration of 10 U/mL.
Statistical analysis of CyTOF data
We used a mixed effects logistic regression model to identify markers predictive of infection with influenza. Cell infection status (i.e. mock, Cal/09 or Vic/11) constituted the response variables, while antibodies were considered explanatory variables. Raw counts were transformed using an arcsinh transformation with a standard cofactor of 5. Estimated coefficients are in units of log-odds, which are logarithm of ratios of two probabilities: the probability that a cell is in condition B (for example, exposed to Cal/09) (encoded as 1) over the probability that a cell is in condition A (for example, exposed to Vic/11) (encoded as 0). The logistic regression model for the ith cell is a linear combination of weighted (denoted byβ) marker intensities (denoted byx);
To account for between donor variability, we added a random effects term to the logistic regression (denoted by z):
Markers with positive coefficients increase the log-odds, whereas markers with negative coefficients decrease the log-odds. In the case of zero-inflated marker expressions, the estimated marker coefficients are shrunk towards zero and provide more conservative estimates. Multimodal distributional markers do not violate the logit model assumptions. We estimated fixed and random effects using the R packages mbest (61).
Study Approval
Peripheral blood mononuclear cells were obtained from leukoreduction system chambers purchased from the Stanford Blood bank. CD34-depleted cord blood mononuclear cells (CBMCs) were obtained through the Binns Program for Cord Blood Research at Stanford University. As subjects were fully de-identified, the study protocol was deemed not to fall under human subjects research by the Institutional Review Board at Stanford University.
Results
Establishment of an autologous system to dissect NK cell responses to influenza A virus
We first established a fully autologous system to investigate the human NK cell response to pandemic H1N1 influenza A virus (Cal/09). This system is based on the ability of monocytes to support influenza A virus infection and stimulate NK cell responses – while precluding non-specific targeting of infected cells through HLA mismatch (44, 62–65). Monocytes and NK cells were purified from a single donor using negative selection, monocytes were infected with A/Cal/07/2009 (Cal/09) influenza A virus at an multiplicity of infection (MOI) of 3, and the cell populations were co-cultured to allow the NK cells to respond to the infected monocytes. A representative flow cytometry gating schematic of NK cells and uninfected or infected monocytes is shown in Figure 1A. We first investigated the capacity of human NK cells to express CD107a, a cell surface marker of cytolytic granule exocytosis (66, 67) in response to monocytes either mock-treated or infected with Cal/09. Cal/09-infected monocytes elicited significant NK cell CD107a expression by 24 HPI, and to a lesser extent at 7 HPI, compared to mock-treated monocytes (Figure 1B-C).
Figure 1. NK cells suppress viral infection and secrete IFN-γ in response to pandemic 2009 H1N1 influenza A virus.
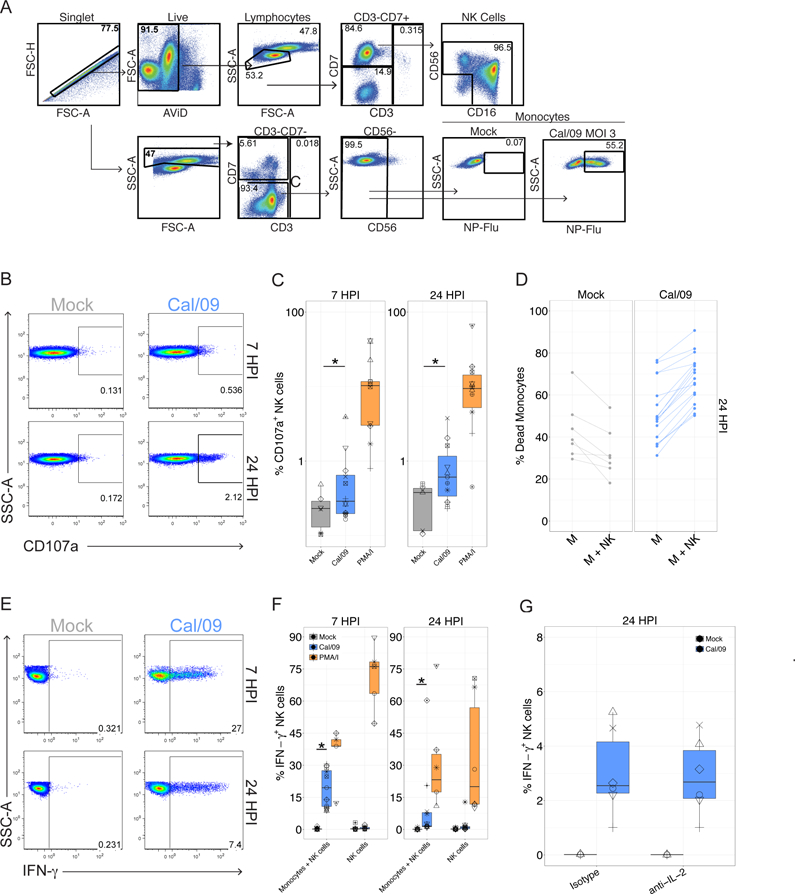
(A) Diagram of gating tree used to identify monocytes and NK cells by flow cytometry. FSC, forward scatter; AViD, Live/Dead fixable aqua dead cell stain; SSC-A, side scatter. Cal/09 infection at an MOI = 3 at 7 HPI is shown. (B) Representative flow plot of CD107a expression on NK cells after 6 or 23-hr co-culture with Cal/09-infected monocytes (MOI = 3). (C) Summary plot of NK cell CD107a+ frequency after 6 or 23-hr (n = 19) co-culture with Cal/09-infected monocytes. PMA/ionomycin treatment served as positive control. (D) The percent dead monocytes of mock (n = 7) or Cal/09 (n = 16) monocytes alone (M) or co-cultured with NK cells at an E:T of 1:1 (M+NK). (E) Representative flow plot of NK cell IFN-γ+ frequency after after 6 or 23-hr co-culture with Cal/09-infected monocytes. (F) Summary plot of NK cell IFN-γ+ frequency after 6 or 23-hr (n = 12) co-culture with Cal/09-infected monocytes or exposure to virions at 7 or 24 HPI assessed by intracellular cytokine staining. PMA/ionomycin treatment served as positive control. *P < 0.05, Wilcoxon signed-rank test. (G) Summary plot of NK cell IFN-γ+ frequency after 23-hr co-culture with Cal/09-infected monocytes incubated with anti-IL-2 or an isotype control antibody (4 µg/mL) and assessed by intracellular cytokine staining (n = 6).
Next, we investigated whether human NK cells suppress influenza A viral infection levels, which can occur through cytolysis or production of cytokines capable of limiting viral infection. Infection levels were tracked by staining for intracellular expression of the influenza nucleoprotein (Flu-NP). Addition of NK cells also significantly increased the frequency of dead monocytes at 24 hours, but only in monocytes infected with Cal/09 and not in mock-infected cultures (Figure 1D). These data suggest that NK cells reduce infection levels through direct killing of infected cells.
NK cells produce IFN-γ in response to Cal/09-infected monocytes in the absence of T cells
Given its linchpin role in the immune response to influenza, we next evaluated IFN-γ production. NK cells produced IFN-γ in response to Cal/09-infected autologous monocytes at 7 and 24 HPI (Figure 1E-F). NK cell IFN-γ production required exposure to infected cells, as influenza virions did not significantly elicit IFN-γ production directly (Figure 1F). Antibody-mediated neutralization of IFN-γ did not significantly reduce NK cell suppression of Cal/09 infection levels in this short term co-culture (Figure S1A), suggesting that cytokine production is distinct from direct killing, which is the primary mediator of viral suppression.
A prior study reported that the NK cell response to monocytes infected with the A/Panama/2007/99 H3N2 influenza strain was dependent on IL-2 produced by T cells in a 17 hour co-culture (62). Though we had purified monocytes and NK cells using magnetic beads, we evaluated whether IL-2 secretion from the residual T cells drove NK cell IFN-γ production to influenza by examining the effect of IL-2 neutralizing antibody on IFN-γ production by NK cells after exposure to Cal/09-infected monocytes. As expected, addition of exogenous IL-2 induced NK cell IFN-γ production by NK cells, which was diminished in the presence of the IL-2 neutralizing antibody (Figure S1B) (68–70). Importantly, the neutralizing IL-2 antibody failed to abrogate NK cell IFN-γ production in response to Cal/09-infected monocytes (Figure 1G). To further evaluate whether NK cell IFN-γ secretion was driven by the ~2% contaminating CD3+ T cells that remained following magnetic negative selection of NK cells, T cells were sequentially depleted through magnetic selection followed by fluorescence activated cell sorting to achieve <0.25% T cells. Under these conditions, robust NK cell IFN-γ production was still observed in response to infected monocytes (Figure S1C). Further, re-constitution of T cells failed to enhance NK cell responses (Figure S1C). These data are consistent with the ability of Cal/09 infection to directly elicit NK cell IFN-γ production without T cell help.
NK cell suppress infection levels of multiple influenza A virus strains
We next asked whether the NK cell capacity to suppress influenza infection levels extended to other influenza strains. To this end, monocytes were mock-treated or infected at an multiplicity of infection (MOI) of 3 with Cal/09, A/Vic/361/2011 (Vic/11), A/Bayern/7/1995 (Bay/95), A/Beijing/32/1992 (BJ/92), A/Hong Kong/1/1968 (HK/68) or A/Melbourne/1/1946 (Mel/46). Addition of NK cells significantly reduced the frequency of monocytes infected with each strain except A/Melbourne/1/1946 (Figure 2A). Individual variation was observed in the magnitude of initial infection levels and in the reduction of infection (Figure 2A). Addition of NK cells significantly reduced the frequency of monocytes infected with Cal/09 or Vic/11 in a dose- and time-dependent manner, as increasing the effector-to-target (E:T) cell ratio further reduced infection levels (Figure 2B). Addition of NK cells also significantly increased the frequency of dead monocytes at 24 hours in monocytes infected with Vic/11-infected cultures (Figure S2A). Further, NK cells potently suppressed the level of influenza matrix RNA (Figure 2C). Collectively, these data illustrate that NK cells are capable of suppressing infection by multiple strains, likely through direct killing of infected cells, establishing human NK cell ability to broadly suppress influenza A viruses.
Figure 2.
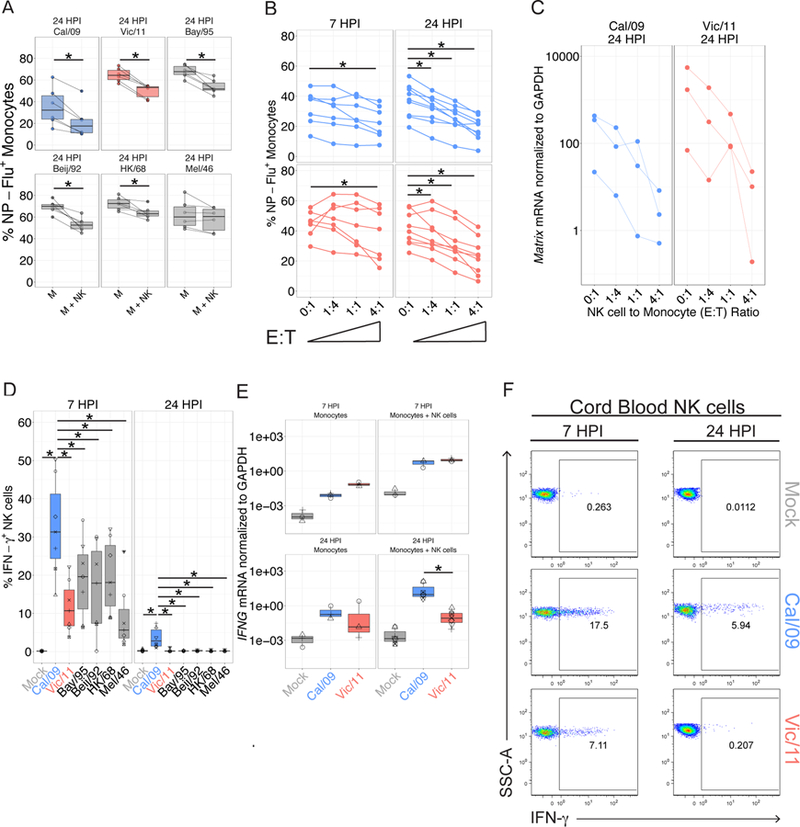
NK cells suppress viral infection and secrete IFN-γ in response to six influenza A strains. (A) The percent Flu-NP+ monocytes of indicated influenza strain 24 HPI (MOI = 3) and an E:T ratio of 0:1 without NK cells (M) or with NK cells at an E:T of 1:1 (M+NK) (n = 6). (B) The percent Flu-NP+ monocytes measured after Cal/09 or Vic/11 infection at an MOI of 3 and an E:T ratio of 0:1, 1:4, 1:1 or 4:1 for a total of 7 (n = 7) or 24 hr (n = 9). (C) RNA expression levels of an identical sequence in the influenza matrix gene segment of Cal/09 and Vic/11 normalized to the housekeeping gene GAPDH (n = 3). (D) NK cell IFN-γ+ frequency after culture with monocytes infected with the specified influenza A strains at 7 HPI (n = 7) or 24 HPI (n = 6). (E) IFNG transcript levels normalized to GAPDH in the monocyte alone or monocyte – NK cell co-culture (M+NK) after mock treatment, Cal/09 or Vic/11 exposure (MOI = 3). Values represent average of technical triplicates (n = 3). (F) Representative flow plot showing percent IFN-γ+ of cord blood NK cells post exposure to mock, Cal/09- or Vic/11-infected monocytes (n = 3). *P < 0.05, Wilcoxon signed-rank test.
The magnitude of the NK cell IFN-γ response differs between strains
We next asked whether each influenza strain elicited similar levels of NK cell IFN-γ production. Surprisingly, a significantly greater proportion of NK cells produced IFN-γ in response to the Cal/09 strain at 7 hours than to the other strains tested (Figure 2D). Further, the NK cell IFN-γ response to the Cal/09 strain was sustained at 24 hours, but returned to baseline levels in the remaining tested strains (Figure 2D). To elucidate the source of this uniquely enhanced IFN-γ response to the Cal/09 strain, we compared it to the seasonal Vic/11 that co-circulated with it. The Cal/09 strain elicits a higher frequency of IFN-γ+ NK cells than the Vic/11 strain at 7 hours post-infection (HPI) (Figure 2D). This difference held true at 24 HPI, although responses were lower for both strains. The greater frequency of IFN-γ+ NK cells translated into a higher IFN-γ concentration in the supernatant of Cal/09-infected co-cultures (Figure S2B) and occurred despite lower infection levels in Cal/09-infected monocytes at a matched MOI and with <1% infection of NK cells by both strains (Figure S2C). To test whether the enhanced IFN-γ response to Cal/09 is caused by lower infection levels compared with Vic/11, monocytes were infected Cal/09 (MOI = 5) and Vic/11 (MOI = 0.2) to achieve a similar frequency of Flu-NP+ cells. Under these conditions, the significantly higher IFN-γ response to Cal/09 compared with Vic/11 was preserved, indicating the NK cell strain-specific response occurred after exposure to monocytes infected at a matched MOI or at matched infection levels (Figure S2D). The higher NK cell IFN-γ response to Cal/09 was confirmed by transcriptional profiling, as IFNG was transcribed at higher levels in response to Cal/09- compared with Vic/11-infected monocytes at 24 HPI (Figure 2E).
To address the potential contributions of residual memory T cells and NK cell memory responses (62, 71–74), we examined cord blood mononuclear cells to obtain influenza-naïve lymphocytes. NK cells purified from cord blood also demonstrated enhanced IFN-γ responses to autologous monocytes infected with the Cal/09 strain (Figure 2F). This suggests the enhanced response to the Cal/09 strain is intrinsic to the interaction between NK cells and infected monocytes – independent of memory NK or T cell responses.
Cal/09 induces IFNAR-associated genes to a significantly greater degree than Vic/11
We performed transcriptional profiling (RNA-seq) to investigate the source of the enhanced NK cell IFN-γ response to Cal/09-infected monocytes. Monocytes were mock-treated, infected with Cal/09, or infected with Vic/11 at matched infection levels, exposed to NK cells, and re-isolated for RNA-seq (Figure 3A). Influenza RNA transcript levels were similar between strains, though levels of the nuclear export protein were lower in Vic/11 infection (Figure S3A). Visualization of the cellular transcripts using principal component analysis (PCA) and by heatmap revealed that the two viruses induce distinguishable transcriptional signatures, and infection and time point had a far greater effect than donor variability (Figure 3B-C and S3B). We next used the KEGG pathway database to identify molecular pathways differentially expressed due to Cal/09 and Vic/11infection (Figure 3D). Autoimmune thyroid disease, cytosolic DNA-sensing and RIG-I-like receptor signaling pathways had the highest degree of overlap between strains, while cytokine-cytokine receptor interactions had the lowest (5%) overlap, indicating that this pathway may be a key difference between the Cal/09 and Vic/11 strains.
Figure 3. Whole transcriptome profiling of mock-treated, Cal/09- or Vic/11-infected monocytes reveals strain-specific alterations in the magnitude of the IFNAR response.
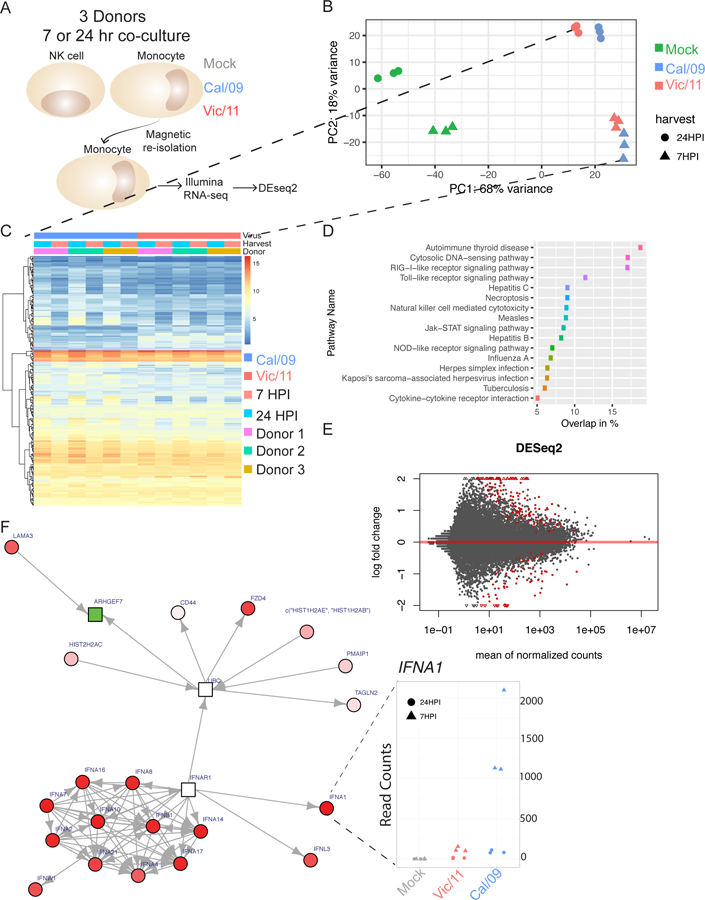
(A) Schematic of RNA-sequencing experimental design. Monocytes from three healthy blood bank donors were mock treated or infected with Cal/09 (MOI = 5) or Vic/11 (MOI = 0.2) followed by NK cell co-culture. At 7 or 24 HPI, monocytes were re-isolated by magnetic separation followed by RNA extraction, cDNA library preparation and paired-end illumina sequencing. (B) Principal component analysis (PCA) plot of the samples colored by treatment. (C) Heatmap showing genes differentially expressed by Cal/09 vs. Vic/11 infection. (D) KEGG pathways significantly enriched by each infection showing % overlap between strains. (E) Volcano plot of differentially expressed genes between Cal/09 and Vic/11 infected monocytes generated by DeSeq2, with the log2 fold change of each gene plotted against the total number of counts recorded for that gene. Differentially expressed genes with a p-value < 0.05 are highlighted in red. Triangles represent data points outside the graph area. (F) Differentially expressed genes were mapped to known protein-protein networks derived from the human STRING database. Individual gene are nodes in the network with scores assigned to them derived from a beta-uniform mixture model fitted to the unadjusted p-value distribution accounting for multiple testing. A subgraph (false discovery rate = 0.01) was generated with differential gene expression colored in red (upregulated; Cal/09 > Vic/11), green (downregulated; Cal/09 < Vic/11) or white (neutral). Shapes represent scores: rectangles are negative and circles are positive. Red cluster in bottom left: type 1 interferon-mediated signaling pathway elevated in Cal/09- vs. Vic/11-infected monocytes. Inset: IFNA1 mRNA counts within each condition.
Differential expression analysis of monocytes infected with Cal/09 vs. Vic/11 identified 241 genes (adjusted p-value <0.1) – 162 with a positive log fold change (0.72%) and 79 with a negative fold change (0.35%) (Figure 3E). To capture the biological significance of the differentially expressed genes, we used known and predicted protein-protein interactions obtained from the STRING program to construct an interaction network using the GXNA technique (52, 75). At a false discovery rate of 1% and using a minimum interaction score of 0.9, this approach generated a network containing a module of interactions connected by the interferon receptor (IFNAR1) gene (Figure 3F and Table SI). Such a network based analysis allows for the inclusion of genes not significant by themselves but provide an important linking structure connecting differentially expressed gene clusters. Numerous interferon-α receptor-associated genes were significantly upregulated in Cal/09-infected monocytes compared with Vic/11, including IFNA1 at 7 HPI, indicative of an early strain-specific transcriptional response (Figure 3F; IFNA1 inset). Thus, the algorithm identified IFNAR1-associated genes as a candidate key difference in the transcriptional program between Cal/09 infection compared with Vic/11.
Cal/09-infected monocytes secrete cytokines which elicit NK cell IFN-γ production
Identification of IFNAR1-associated transcriptional differences between monocytes infected with Cal/09 and Vic/11 led us to quantify cytokine production using Luminex®, allowing for the simultaneous measurement of 63 human cytokines. Cal/09-infected monocytes secreted greater levels of numerous cytokines and chemokines compared with Vic/11-infected monocytes (Figure 4A and Table SII). These cytokines include IFN-α, IL-12, IL-15, IL-18 and IFN-γ, which can trigger NK cell antiviral responses by signaling through cytokine receptors expressed by NK cells (33, 42, 43). To directly test the impact of IFN-α on NK cell IFN-γ production in response to Cal/09-infected monocytes, the activity of IFN-α on NK cells was blocked using a IFN-α neutralizing antibody. IFN-α neutralization significantly reduced IFN-γ secretion by NK cells, as did blockade of IL-15R, IFNGR1 and IL-18R, but not IL-12R (Figure 4B-F). Thus, signaling through IFN-α, IL-15, IFN-γ and IL-18 receptors is a component of the NK cell IFN-γ response to Cal/09 under these conditions.
Figure 4. Cytokine profiles of Vic/11- and Cal/09-infected monocytes contribute to strain-specific NK cell IFN-γ responses.
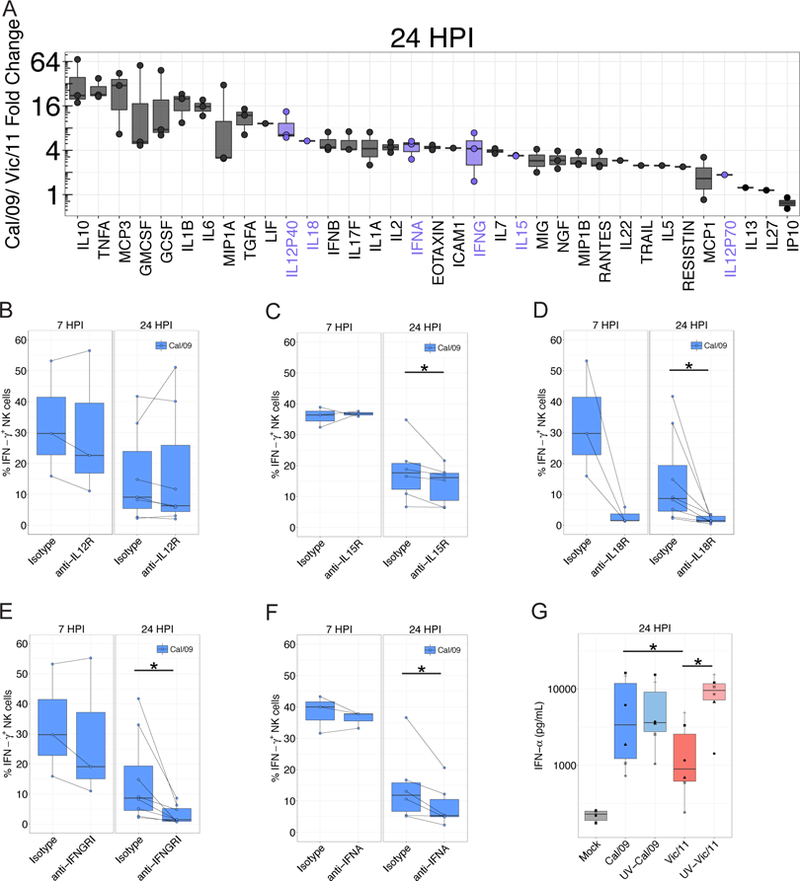
(A) Cytokine concentrations assessed by Luminex®. Values displayed represent the fold-change in the mean fluorescence intensity between Cal/09- and Vic/11-infected conditions (MOI = 3). Cytokines elevated by 2.5-fold in supernatants harvested from Cal/09 or Vic/11-infected monocytes over the level in supernatants from mock-infected monocytes are plotted (n = 3). (B)-(F) Impact of cytokine receptor blocking on the NK cell IFN-γ response evaluated by pre-incubating NK cells for 1 hr with blocking antibodies specific to IL-12R (B), IL-15R (C), IL-18R (D), IFNGR1 (F) or with neutralizing antibody to IFN-α (F) followed by co-culture with infected monocytes. NK cell IFN-γ+ frequency compared with treatment with an isotype control antibody at 7 HPI (n = 3) or 24 HPI (n = 7–8) is shown. (G) IFN-α concentration following infection of monocytes with live or UV-inactivated Cal/09 or Vic/11 virus at an MOI of 3 (n = 6). *P < 0.05, Wilcoxon signed-rank test.
We next assessed the role of viral replication in the magnitude of IFN-α induction in infected monocytes by inactivating the virus with ultraviolet light (UV). While induction of IFN-α from Cal/09-infected monocytes was comparable after UV-inactivation, induction of IFN-α was significantly elevated after infection of monocytes by UV-treated, replication-incompetent Vic/11 (Figure 4G). These data are consistent with replication of Vic/11 being required for robust suppression of cellular antiviral IFN-α induction, while Cal/09 relatively inefficiently suppresses the induction of IFN-α.
Cytokines are insufficient to drive the strain-specific NK cell response
We next sought to determine whether differential induction of cytokines are the integral source of strain-specific NK cell activation. To this end, we assessed whether the cytokines produced by Cal/09 infection are sufficient to drive the elevated NK cell IFN-γ production in the absence of Cal/09 infected cells. Transfer of supernatant from Cal/09-infected monocytes was insufficient to rescue NK cell IFN-γ production in NK cells cultured alone or cultured with Vic/11-infected monocytes (Figure 5A). UV-treated supernatants were also insufficient to rescue NK cell IFN-γ production in NK cells cultured alone or cultured with Vic/11-infected monocyte (Figure S4). Thus, the differences in cytokine production between the two strains are insufficient to explain the strain-specific enhancement in the NK cell response to Cal/09.
Figure 5. Cytokine stimulation is insufficient to drive strain-specific NK cell anti-influenza IFN-γ production.
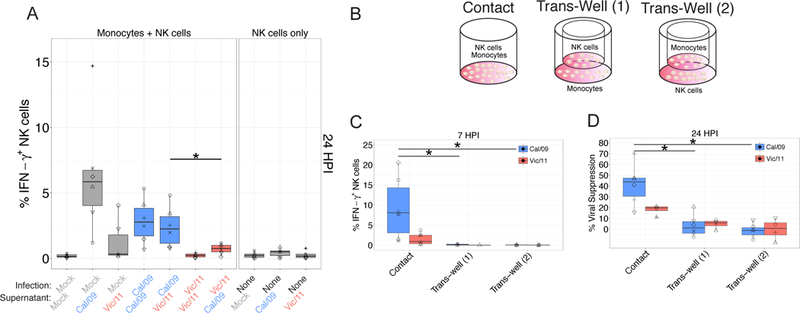
(A) Assessment of the impact of supernatants from infected cultures to the NK cell IFN-γ response to influenza strains. After infection (or mock-infection) for 24 hours, supernatants were then transferred to monocytes under each specified condition, followed by co-culture with autologous NK cells. Intracellular cytokine staining was used to assess the percentage IFN-γ+ NK cells by flow cytometry (n = 6). (B) Monocytes were cultured in direct contact with NK cells (contact), with monocytes seeded in dish and NK cells seeded in the trans-well (Trans-Well (1)), or monocytes seeded in the trans-well and NK cells seeded in the dish (Trans-Well (2)). (C) Percentage of IFN-γ+ NK cells after 6 hr co-culture with infected monocytes; Cal/09 (n = 6), Vic/11 (n = 5). (D) Cal/09- or Vic/11-infected monocytes were cultured alone or co-cultured with NK cells at a ratio of 1:1. Monocyte infection levels at 24 HPI assessed using an antibody specific to Flu-NP followed by intracellular flow cytometry, Cal/09 (n = 6), Vic/11 (n = 4). Mock-treated values were subtracted from infected measurements. *P < 0.05, Wilcoxon signed-rank test.
These data suggested receptor-ligand interactions are required to mediate strain-specific differences in the magnitude of the NK cell response to influenza. To prove a dependency of receptor-ligand interactions, we co-cultured NK cells and monocytes in a trans-well system (Figure 5B). Elimination of direct NK cell-monocyte contact completely abrogated the NK cell IFN-γ response to both Vic/11- and Cal/09-infected monocytes (Figure 5C). Further, elimination of direct NK cell-monocyte contact significantly reduced NK cell-mediated viral suppression of both Cal/09 and Vic/11-infected monocytes (Figure 5D). Collectively, these data suggest that the NK cell response to influenza-infected monocytes requires receptor-ligand interactions, and raise the question of how such receptor-ligand interactions contribute to the strain-specific NK cell response.
Mass cytometry reveals CD54 and CD112 NK cell activating ligands predict Cal/09 vs Vic/11 infection
To identify candidate receptor-ligand interactions involved in the differential NK cell response to influenza-infected monocytes, we used a 38-parameter mass cytometry panel to monitor changes in NK cell ligand expression on Vic/11- and Cal/09-infected monocytes from nine donors (five female and four male) (Table SIII and Figures S5–7). A generalized linear mixed model (GLMM) and PCA were used to identify and visualize the NK cell ligands modulated by influenza infection of monocytes while controlling for inter-individual variability (Figure S8A-D). We used the GLMM to evaluate which markers were predictive of Cal/09 vs. Vic/11 infection. Expression of CD112, PAN-HLA, CD54, HLA-C, and MICA predicted Cal/09 infection, while CD111 (Nectin-1), CD95, and IP-10 predicted Vic/11 infection (Figure 6A). PCA visualization indicated expression of CD112 and CD54 were the major contributors to variance between Cal/09 and Vic/11 infection (Figure 6B). We performed several quality checks of the data and our analyses. We found that the number of cells evaluated was not a significant contributor to variance and did not distinguish populations of mock vs. infected cells or Vic/11 vs. Cal/09 at 24 HPI (Figure 6C). Similarly, individual donors did not drive the variance observed in mock vs. infected cells or Vic/11 vs. Cal/09 infection (Figure 6D). Thus, these data indicate a pattern of influenza infection across multiple healthy donors leading to changes in inhibitory and activating ligand expression, with expression of activating ligands CD112 and CD54 distinguishing Cal/09 from Vic/11 infection.
Figure 6. Identification of influenza-mediated modulation of NK cell inhibitory and activating ligands by mass cytometry and GLMM analysis.
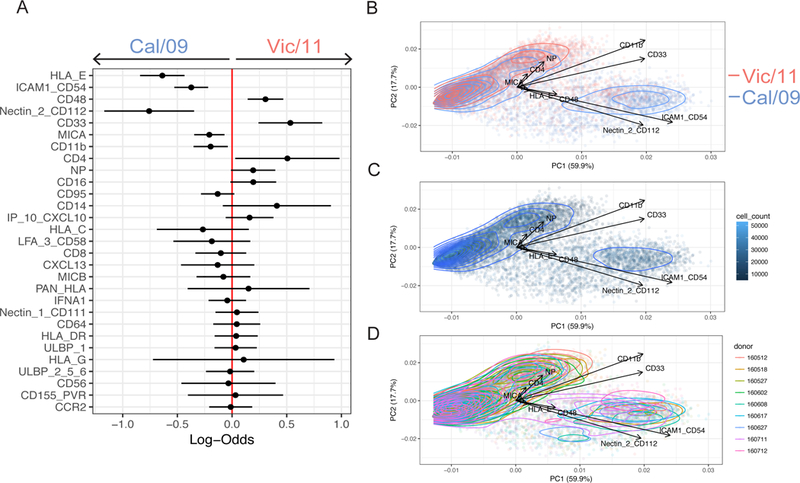
(A) Generalized linear mixed model (GLMM) to identify markers predictive of Cal/09 vs. Vic/11 infection from nine donors. Log-odds are logarithm of ratios of the probability that a cell is Vic/11-infected over the probability that a cell is Cal/09-infected at 24 HPI. An increase in the parameter coefficient corresponds to the strength of the classification power, with the 95% confidence interval from sampling error represented by line surrounding the point estimate. The confidence intervals are widened using Bonferroni’s method. The reported p-values are controlled using Benjamini-Hochberg’s false discovery rates. (B) PCA of individual cells colored by Cal/09 vs. Vic/11 infection at 24 HPI, with the vectors driving variance displayed. Quality check of variables that could potentially influence the ability to identify makers predictive of infection in monocyte – NK cell co-culture. (C) Cell count PCA of Cal/09 - vs. Vic/11-infected monocytes at 24 HPI. (D) PCA colored by donor of Cal/09 - vs. Vic/11-infected-infected monocytes at 24 HPI.
The Cal/09 and Vic/11 influenza strains differentially downregulate CD112 and CD54
We next evaluated how infection modulates these NK cell ligands in an additional set of healthy donors by conventional fluorescence flow cytometry. Cal/09-infected monocytes had a significantly higher frequency of CD112 and CD54-expressing cells than Vic/11-infected monocytes (Figure 7A). However, comparison with mock-treated monocytes indicates both influenza strains downregulate expression of these NK cell activating ligands, though more was retained on the surface of Cal/09-infected cells (Figure 7A). To corroborate that these observations were consistent in natural target cells of influenza infection, we measured the cell surface expression of CD54 and CD112 on human bronchial/tracheal epithelial cells (NHBE), a cell type validated as physiologically relevant for influenza infection in the distal trachea (76). Similar to the pattern observed in monocytes, infection of NHBE cells with Vic/11 and Cal/09 led to downregulation of CD54 and CD112 surface expression (Figure 7A) with levels of both ligands preserved at a higher frequency on Cal/09- compared with Vic/11-infected NHBE cells (Figure 7A). This pattern of ligand expression was independent of infection levels, as CD54 and CD112 expression gated only on infected (NP-Flu+) remained significantly higher on Cal/09 vs. Vic/11-infected monocytes (Figure 7B-C). Finally, we next assessed whether viral replication was required for downregulation of CD112 and CD54 ligand expression. Infection of cells with UV-inactivated virus failed to downregulate CD112 and CD54 cell surface expression to the same extent, indicating viral replication is partially required for downregulation of CD112 and CD54 (Figure 7D-G).
Figure 7. Strain-specific downregulation of CD112 and CD54 is dependent on viral replication.
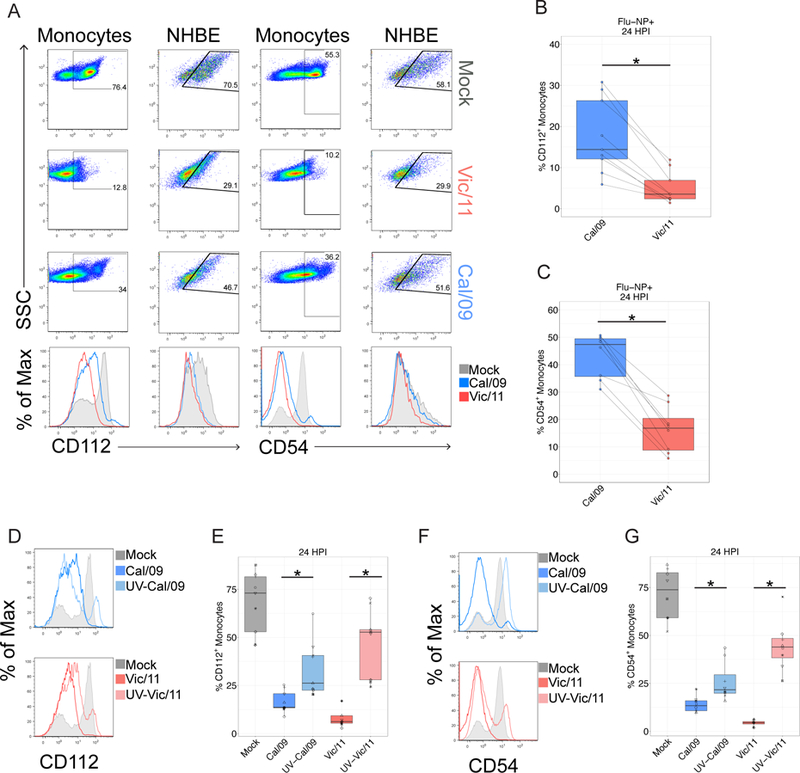
(A) Representative flow plots and histograms of CD112 expression on mock, Vic/11- or Cal/09-exposed monocytes and NHBE cells (MOI = 3). (B-C) The frequency of (B) CD112 (n = 9) or (C) CD54 (n = 8) expression on infected (Flu-NP+) monocytes assessed by fluorescence flow cytometry on Cal/09- or Vic/11-infected cells at an MOI of 3 at 24 HPI. (D-G) Representative histograms of CD112 (D) and CD54 (F) expression on mock-treated, live and UV-inactivated Cal/09- or Vic/11-infected monocytes. Summary plots of CD112+ (n = 9) (E) and CD54+ (n = 8) (G) expression after mock-treatment or infection with live or UV-inactivated Cal/09- or Vic/11-infected monocytes at MOI of 3. *P < 0.05, Wilcoxon signed-rank test.
Combined cytokine and receptor-ligand signaling drives the NK cell response to Cal/09 influenza
CD112 and CD54 activate NK cells by binding to CD226 (DNAM-1) and the αLβ2 integrin LFA-1 (CD11a/CD18), respectively (77–79). To assess whether differing expression of CD112 and CD54 contribute to enhanced IFN-γ production in response to the Cal/09 strain, we blocked these NK cell ligands from interacting with their cognate NK cell receptors. A blocking antibody to CD226 reduces the NK cell IFN-γ response to Cal/09 compared with isotype control treatment (p-value = 0.03) (Figure 8A). This suggests retention of CD112 on Cal/09-infected cells plays a role in the enhanced IFN-γ response to Cal/09. However, in light of the modest effect, this may primarily enhance the sensitivity of NK cells to IFN-α and other cytokines. Similarly, inhibiting the interaction between CD54 and its cognate receptor LFA-1 with a LFA-1 blocking antibody (80, 81) dampens the NK cell IFN-γ response to Cal/09 (Figure 8A).
Figure 8. Cytokine-mediated and receptor-ligand interactions are necessary for the NK cell response to influenza-infected cells.
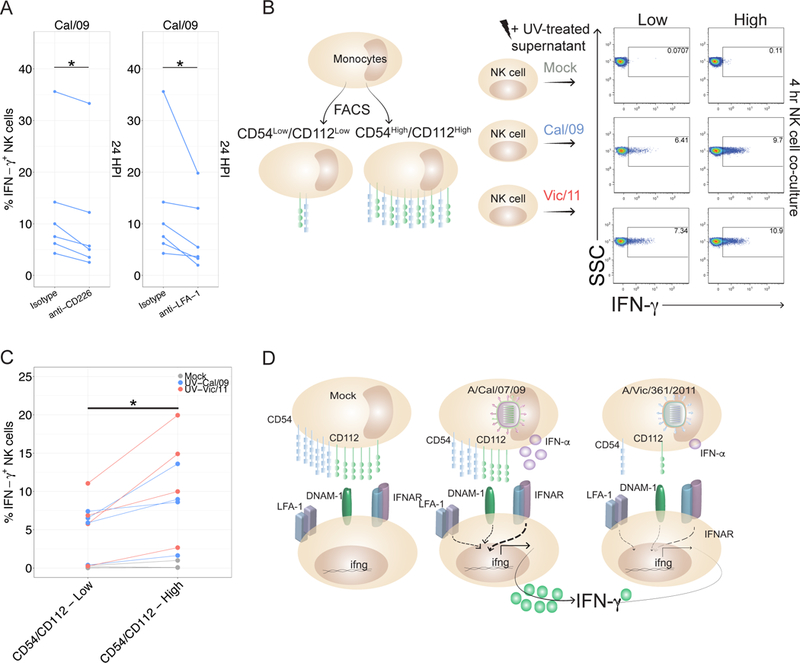
(A) NK cells were incubated for 1 hr with isotype control (Mouse IgG1, κ) or blocking antibodies specific to CD226 or LFA-1 followed by co-culture with autologous infected monocytes. At 24 HPI, intracellular cytokine staining was used to assess IFN-γ production compared to treatment with isotype control antibody (n = 6). (B) Schematic of fluorescently activated cell sorting to isolate uninfected monocytes expressing either low or high levels of CD54 and CD112. CD54Low/CD112Low and CD54High/CD112High monocytes were co-cultured with autologous NK cells for four hours in the presence of UV-treated supernatant harvested from mock, Cal/09- or Vic/11 monocytes (MOI = 3, 24 HPI) (n = 3 at 4 hr, n = 1 at 17 hr). (C) Compiled data from four donors from experiment described in (B). (D) Model of strain-specific NK cell recognition of influenza A infection. Cal/09 infection of monocytes elicits enhanced IFN-α secretion and neutralization of IFN-α dampens NK cell IFN-γ production. Cal/09-infection does not downregulate CD54 and CD112 to the same extent as Vic/11-infected monocytes or NHBE cells. *P < 0.05, Wilcoxon signed-rank test.
We next evaluated whether expression levels of CD112 and CD54 are sufficient to drive differential levels of NK cell IFN-γ production - independent of other factors modulated by infection. To this end, we measured the NK cell IFN-γ response to uninfected monocytes sorted into CD112/CD54Low and CD112/CD54High populations (Figure 8B). As expected, neither population elicited an NK cell response, however transfer of UV-treated supernatant from Cal/09- or Vic/11-infected monocytes led to NK cell IFN-γ production which was significantly higher in response to CD112/CD54High than to CD112/CD54Low monocytes (Figure 8B-C). These data indicate that variations in the level of CD112 and CD54 expression are sufficient to drive differential NK cell IFN-γ production in a cytokine-dependent manner.
Discussion
Here we compared NK cell recognition of the pandemic H1N1 Cal/09 influenza strain to a number of seasonal influenza strains including the H3N2 Vic/11 strain. We demonstrate that NK cells are capable of directly killing Cal/09-infected cells and of secreting IFN-γ in a T cell and IL-2-independent manner. Further, while NK cells similarly suppress infection of multiple influenza A strains, the Cal/09 strain elicits a uniquely robust IFN-γ response. This enhanced NK cell IFN-γ response to the Cal/09 strain is driven, in part, by enhanced production of IFN-α and other cytokines by cells infected with Cal/09 compared to the seasonal Vic/11 and other strains. Further, using mass cytometry, statistical approaches, validation through conventional fluorescent flow cytometry, and blocking antibodies, we reveal a mechanism underlying enhanced NK cell IFN-γ response in the failure of Cal/09 to downregulate CD54 and CD112 activating ligands to the same extent as Vic/11, rendering them more susceptible to NK cell recognition (Model: Figure 8D). By extension, these findings provide insight into the cellular mechanisms responsible for tuned innate NK cell responses to specific strains of influenza, while identifying a previously unrecognized influenza immune evasion pathway through downregulation of CD112 and CD54 expression.
In the cat and mouse game of recognition vs. escape between the virus and its host, viruses have developed an array of techniques to escape from host immunity. A major influenza A virus escape mechanism is encoded by the nonstructural protein 1 (NS1) – a type I IFN antagonist (82). The differential induction of type I IFN by the Cal/09 and Vic/11 strains highlights the question of whether the Cal/09 NS1 less efficiently suppresses IFN-α production compared with the NS1 encoded by Vic/11 (82–84). Precedent exists for strain-specific activity of NS1, as NS1 from the 1918 pandemic influenza strain more efficiently blocked transcription of IFN-regulated genes than did NS1 encoded by A/WSN/33 (H1N1) (85). NS1 encoded by Cal/09 and Vic/11 share 82% sequence identity, raising the possibility that variation in the NS1 sequence may enable Vic/11 to disarm the host type I IFN system with higher efficiency than Cal/09. We anticipate future studies to determine whether sequence divergence and/or protein copy number in NS1 or other genes between influenza A strains contributes to differential NK cell activation.
In addition to differences in type I IFN production, here we have significantly expanded our current understanding of how distinct influenza A strains escape or trigger human NK cell activation through modulation of surface ligands. Earlier studies reported influenza A infection upregulates and re-organizes HLA class I molecules (37). Consistent with this report, our data indicate HLA class I expression is retained on influenza-infected cells, highlighting how retention or even upregulation of HLA class I molecules on influenza-infected cells is insufficient to shield from NK cell recognition (Figure S8A and C). While several prior studies reported that changes in the viral hemagglutinin are associated with differential ability to lyse cells infected with different influenza strains (86–88), here we identify a novel pathway by which variation in the host cell expression of surface ligands in infected cells governs the magnitude of the NK cell IFN-γ response. Specifically, the differential ability of the H1N1 Cal/09 strain and the seasonal H3N2 Vic/11 strain to reduce expression of CD112 and CD54 leads to a different magnitude of NK cell response. Thus, these data highlight the ability of innate immune cells to mount ‘tuned’ responses that distinguish strains of the same virus with distinct functional outcomes.
Here we focused primarily on the drivers of the enhanced response to the Cal/09 vs. Vic/11 strains. However, additional receptor-ligand interactions are almost certainly involved in the recognition of influenza-infected cells. For instance, MICA significantly predicted Cal/09 infection (Figure S8C; underlined), suggesting its cognate receptor NKG2D may play a role in NK cell recognition of infected cells, in agreement with a previous study which found NKG2D was required for the response to A/Panama/2007/99-infected dendritic cells (65).
These data reveal a previously undescribed viral escape mechanism employed by influenza A virus to escape from NK cell recognition. Downregulation of both CD54 and CD112 in infected monocytes and lung epithelial cells to escape NK cell recognition requires viral replication and is more efficiently performed by the seasonal H3N2 Vic/11 strain than the pandemic H1N1 Cal/09 strain. While a role for the CD226-CD112 interaction in NK cell recognition of influenza-infected cells has not been reported previously, other viruses downregulate CD112 during infection as an immune escape mechanism. For instance, the gD glycoprotein of alpha-herpes simplex virus-2 (HSV-2) downregulates CD112, reducing CD226 binding and NK cell-mediated lysis of HSV-2-infected cells (89). Precedent also exists for viral regulation of CD54; for example, the K3 and K5 ubiquitin E3 ligases of KSHV downregulate CD54 expression (90, 91). This raises the question of which influenza gene product is responsible for CD112 and CD54 downregulation; efforts to characterize the pathway(s) driving ligand downregulation are underway.
In light of recent insights into adaptive features of NK cells, we considered whether the differential responses to influenza strains may relate to memory-like NK cell properties (71–74, 92). Such considerations may be important because of studies which found elevated NK cell IFN-γ responses to Cal/09 and innate cytokine stimulation persisting up to six months post-vaccination; albeit in a T cell and IL-2-dependent manner (93, 94). To test for a possible role of influenza-specific memory NK cells, NK cells were harvested from naive cord blood. Under these conditions, the strain-specific NK cell anti-influenza response persisted (Figure 2G) – supporting the notion that NK cells are capable of tuned antiviral responses, independent of the role of NK cell memory or influenza-specific memory T cells. Further, while T cells activate NK cells through IL-2 secretion, addition of an IL-2 neutralizing antibody failed to abrogate the NK cell response to Cal/09-infected monocytes (Figure 1G and S1A) (68–70). These data are consistent with an early, intrinsic ability of NK cells to secrete IFN-γ in response to influenza A viruses, without T cell help.
One potential limitation of this study is the use of human monocytes rather than lung epithelial cells in many experiments. This method was selected because KIR-HLA ligand interactions can play a critical role in the outcome of certain viral infections (95–97), including influenza (98). The monocyte-NK cell system allowed us to maintain a fully autologous system, avoiding NK cell activation because of KIR-HLA class I mismatch rather than influenza infection, and has been used in several prior studies (62, 64). Further, monocytes and macrophages may play an important role in influenza pathogenesis in vivo. In mice, alveolar macrophages are indispensable for controlling influenza infection and preventing secondary bacterial infections in animal models (99). Importantly, infection of normal human bronchial epithelial cells also led to downregulation of CD112 and CD54 expression. A second limitation of this study was we did not directly address the role of enhanced IFN-γ production in influenza clinical outcomes. However, prior studies have demonstrated that enhanced cytokine responses are associated with poor outcomes (100–104). This is particularly evident with pandemic strains such as Cal/09 (100, 101). In fact, Cal/09 leads to higher induction of pro-inflammatory cytokines in the lungs of ferrets and macaques compared with infection with seasonal A/Kawasaki/UTK-4/09 (H1N1) at three days post-infection (21). Furthermore, studies have linked induction of proinflammatory cytokines, including IFN-α, by influenza A and the severity of human disease (20, 22, 23, 102). Thus, our human, ex vivo data identify possible mechanisms behind these important in vivo findings.
Finally, understanding the immune pathways that control NK cell responses may have future therapeutic implications. These data raise the possibility of purposely manipulate NK cell responses through vaccines, adjuvants, or small molecule inhibitors. Along these lines, the FDA-approved proteasome inhibitor bortezomib enhances NK cell killing of multiple myeloma cells by upregulating NKG2D and CD226 ligands on tumor cells in vitro (105). Whether such approaches could be leveraged to manipulate NK cells to stimulate protective immunity or limit immunopathology during infection are key future endeavors.
Supplementary Material
ACKNOWLEDGEMENTS
Thank you to Drs. Peter Sarnow, Leslie Goo, Taia Wang, Cristina Tato and members of the Blish Lab, particularly Julia McKechnie and Aaron Wilk, for critical reading of the manuscript. We wish to thank Dr. Sara Prescott for her assistance with the RNA-seq alignment to the human transcriptome and Drs. Taia Wang and Rachel Hagey for influenza strains. We acknowledge the Stanford Human Immune Monitoring Center, in particular Dr. Yael Rosenberg-Hasson for the Luminex assay and Dr. Michael Leipold for assistance with the Helios mass cytometer. RNA sequencing was performed at the Stanford Functional Genomics Facility. Cell sorting was conducted on instruments in the Stanford Shared FACS Facility.
Footnotes
Funding was provided by to C.A.B by a Beckman Young Investigator Award, NIH Director’s New Innovator Award DP2AI11219301, and NIH U01AI131302, R56AI124788, R21AI130523, and U19AI057229 to Mark M. Davis. C.A.B. is a Chan Zuckerberg Investigator. Funding was provided to L.M.K by a NIH training grant 5T32AI007290–29 and A.P. Giannini fellowship. R.V., C.S. and S.P.H. were supported by NIH grants U01AI131302, R56AI124788, and R21AI130523. HIMC CyTOF NIH shared instrument grant: S10RR027582.
The authors have declared that no conflict of interest exists.
References
- 1.Thompson WW, Weintraub E, Dhankhar P, Cheng P-Y, Brammer L, Meltzer MI, Bresee JS, and Shay DK. 2009. Estimates of US influenza-associated deaths made using four different methods. Influenza Other Respi. Viruses 3: 37–49. [DOI] [PMC free article] [PubMed] [Google Scholar]
- 2.Grégoire C, Chasson L, Luci C, Tomasello E, Geissmann F, Vivier E, and Walzer T. 2007. The trafficking of natural killer cells. Immunol. Rev 220: 169–182. [DOI] [PMC free article] [PubMed] [Google Scholar]
- 3.Ge MQ, Ho AWS, Tang Y, Wong KHS, Chua BYL, Gasser S, and Kemeny DM. 2012. NK cells regulate CD8+ T cell priming and dendritic cell migration during influenza A infection by IFN-γ and perforin-dependent mechanisms. J. Immunol 189: 2099–2109. [DOI] [PubMed] [Google Scholar]
- 4.Pommerenke C, Wilk E, Srivastava B, Schulze A, Novoselova N, Geffers R, and Schughart K. 2012. Global transcriptome analysis in influenza-infected mouse lungs reveals the kinetics of innate and adaptive host immune responses. PLoS One 7: e41169. [DOI] [PMC free article] [PubMed] [Google Scholar]
- 5.Stein-Streilein J, Bennett M, Mann D, and Kumar V. 1983. Natural killer cells in mouse lung: surface phenotype, target preference, and response to local influenza virus infection. J. Immunol 131: 2699–2704. [PubMed] [Google Scholar]
- 6.Lodoen MB, and Lanier LL. 2006. Natural killer cells as an initial defense against pathogens. Curr. Opin. Immunol 18: 391–398. [DOI] [PMC free article] [PubMed] [Google Scholar]
- 7.Andoniou CE, Coudert JD, and Degli-Esposti MA. 2008. Killers and beyond: NK-cell-mediated control of immune responses. Eur. J. Immunol 38: 2938–2942. [DOI] [PubMed] [Google Scholar]
- 8.Stein-Streilein J, and Guffee J. 1986. In vivo treatment of mice and hamsters with antibodies to asialo GM1 increases morbidity and mortality to pulmonary influenza infection. J. Immunol 136: 1435–1441. [PubMed] [Google Scholar]
- 9.Kos FJ, and Engleman EG. 1996. Role of natural killer cells in the generation of influenza virus-specific cytotoxic T cells. Cell. Immunol 173: 1–6. [DOI] [PubMed] [Google Scholar]
- 10.Abdul-Careem MF, Mian MF, Yue G, Gillgrass A, Chenoweth MJ, Barra NG, Chew MV, Chan T, Al-Garawi AA, Jordana M, and Ashkar AA. 2012. Critical role of natural killer cells in lung immunopathology during influenza infection in mice. J. Infect. Dis 206: 167–177. [DOI] [PubMed] [Google Scholar]
- 11.Zhou G, Juang SWW, and Kane KP. 2013. NK cells exacerbate the pathology of influenza virus infection in mice. Eur. J. Immunol 43: 929–938. [DOI] [PubMed] [Google Scholar]
- 12.Ennis FA, Meager A, Beare AS, Qi YH, Riley D, Schwarz G, Schild GC, and Rook AH. 1981. Interferon induction and increased natural killer-cell activity in influenza infections in man. Lancet 2: 891–893. [DOI] [PubMed] [Google Scholar]
- 13.Welliver TP, Garofalo RP, Hosakote Y, Hintz KH, Avendano L, Sanchez K, Velozo L, Jafri H, Chavez-Bueno S, Ogra PL, McKinney L, Reed JL, and Welliver RC. 2007. Severe human lower respiratory tract illness caused by respiratory syncytial virus and influenza virus is characterized by the absence of pulmonary cytotoxic lymphocyte responses. J. Infect. Dis 195: 1126–1136. [DOI] [PMC free article] [PubMed] [Google Scholar]
- 14.Heltzer ML, Coffin SE, Maurer K, Bagashev A, Zhang Z, Orange JS, and Sullivan KE. 2009. Immune dysregulation in severe influenza. J. Leukoc. Biol 85: 1036–1043. [DOI] [PMC free article] [PubMed] [Google Scholar]
- 15.Denney L, Aitken C, Li CK-F, Wilson-Davies E, Kok WL, Clelland C, Rooney K, Young D, Dong T, McMichael AJ, Carman WF, and Ho L-P. 2010. Reduction of natural killer but not effector CD8 T lymphocytes in three consecutive cases of severe/lethal H1N1/09 influenza A virus infection. PLoS One 5: e10675. [DOI] [PMC free article] [PubMed] [Google Scholar]
- 16.Fox A, Le NMH, Horby P, van Doorn HR, Nguyen VT, Nguyen HH, Nguyen TC, Vu DP, Nguyen MH, Diep NTN, Bich VTN, Huong HTTK, Taylor WR, Farrar J, Wertheim H, and Nguyen VK. 2012. Severe pandemic H1N1 2009 infection is associated with transient NK and T deficiency and aberrant CD8 responses. PLoS One 7: e31535. [DOI] [PMC free article] [PubMed] [Google Scholar]
- 17.Weiss ID, Wald O, Wald H, Beider K, Abraham M, Galun E, Nagler A, and Peled A. 2010. IFN-γ Treatment at Early Stages of Influenza Virus Infection Protects Mice from Death in a NK Cell-Dependent Manner. J. Interferon Cytokine Res 30: 439–449. [DOI] [PubMed] [Google Scholar]
- 18.Long BR, Michaelsson J, Loo CP, Ballan WM, Vu B-AN, Hecht FM, Lanier LL, Chapman JM, and Nixon DF. 2008. Elevated frequency of gamma interferon-producing NK cells in healthy adults vaccinated against influenza virus. Clin. Vaccine Immunol 15: 120–130. [DOI] [PMC free article] [PubMed] [Google Scholar]
- 19.Andres-Terre M, McGuire HM, Pouliot Y, Bongen E, Sweeney TE, Tato CM, and Khatri P. 2015. Integrated, Multi-cohort Analysis Identifies Conserved Transcriptional Signatures across Multiple Respiratory Viruses. Immunity 43: 1199–1211. [DOI] [PMC free article] [PubMed] [Google Scholar]
- 20.Cheung CY, Poon LLM, Lau AS, Luk W, Lau YL, Shortridge KF, Gordon S, Guan Y, and Peiris JSM. 2002. Induction of proinflammatory cytokines in human macrophages by influenza A (H5N1) viruses: a mechanism for the unusual severity of human disease? Lancet 360: 1831–1837. [DOI] [PubMed] [Google Scholar]
- 21.Itoh Y, Shinya K, Kiso M, Watanabe T, Sakoda Y, Hatta M, Muramoto Y, Tamura D, Sakai-Tagawa Y, Noda T, Sakabe S, Imai M, Hatta Y, Watanabe S, Li C, Yamada S, Fujii K, Murakami S, Imai H, Kakugawa S, Ito M, Takano R, Iwatsuki-Horimoto K, Shimojima M, Horimoto T, Goto H, Takahashi K, Makino A, Ishigaki H, Nakayama M, Okamatsu M, Takahashi K, Warshauer D, Shult PA, Saito R, Suzuki H, Furuta Y, Yamashita M, Mitamura K, Nakano K, Nakamura M, Brockman-Schneider R, Mitamura H, Yamazaki M, Sugaya N, Suresh M, Ozawa M, Neumann G, Gern J, Kida H, Ogasawara K, and Kawaoka Y. 2009. In vitro and in vivo characterization of new swine-origin H1N1 influenza viruses. Nature 460: 1021–1025. [DOI] [PMC free article] [PubMed] [Google Scholar]
- 22.de Jong MD, Simmons CP, Thanh TT, Hien VM, Smith GJD, Chau TNB, Hoang DM, Chau NVV, Khanh TH, Dong VC, Qui PT, Cam BV, Ha DQ, Guan Y, Peiris JSM, Chinh NT, Hien TT, and Farrar J. 2006. Fatal outcome of human influenza A (H5N1) is associated with high viral load and hypercytokinemia. Nat. Med 12: 1203–1207. [DOI] [PMC free article] [PubMed] [Google Scholar]
- 23.Kobasa D, Jones SM, Shinya K, Kash JC, Copps J, Ebihara H, Hatta Y, Kim JH, Halfmann P, Hatta M, Feldmann F, Alimonti JB, Fernando L, Li Y, Katze MG, Feldmann H, and Kawaoka Y. 2007. Aberrant innate immune response in lethal infection of macaques with the 1918 influenza virus. Nature 445: 319–323. [DOI] [PubMed] [Google Scholar]
- 24.Hampton T 2007. Virulence of 1918 influenza virus linked to inflammatory innate immune response. JAMA 297: 580. [DOI] [PubMed] [Google Scholar]
- 25.Wareing MD, Lyon AB, Lu B, Gerard C, and Sarawar SR. 2004. Chemokine expression during the development and resolution of a pulmonary leukocyte response to influenza A virus infection in mice. J. Leukoc. Biol 76: 886–895. [DOI] [PubMed] [Google Scholar]
- 26.Lanier LL 2004. NK CELL RECOGNITION. dx.doi.org 23: 225–274. [DOI] [PubMed] [Google Scholar]
- 27.Vivier E, Tomasello E, Baratin M, Walzer T, and Ugolini S. 2008. Functions of natural killer cells. Nat. Immunol 9: 503–510. [DOI] [PubMed] [Google Scholar]
- 28.Cerwenka A, and Lanier LL. 2001. Natural killer cells, viruses and cancer. Nat. Rev. Immunol 1: 41–49. [DOI] [PubMed] [Google Scholar]
- 29.Kärre K, Ljunggren HG, Piontek G, and Kiessling R. 2005. Selective rejection of H-2-deficient lymphoma variants suggests alternative immune defence strategy 1986,. [PubMed]
- 30.Kärre K 1997. How to recognize a foreign submarine. Immunol. Rev 155: 5–9. [DOI] [PubMed] [Google Scholar]
- 31.Moretta A, Bottino C, Vitale M, Pende D, Cantoni C, Mingari MC, Biassoni R, and Moretta L. 2001. Activating receptors and coreceptors involved in human natural killer cell-mediated cytolysis. Annu. Rev. Immunol 19: 197–223. [DOI] [PubMed] [Google Scholar]
- 32.Elliott JM, Wahle JA, and Yokoyama WM. 2010. MHC class I–deficient natural killer cells acquire a licensed phenotype after transfer into an MHC class I–sufficient environment. J. Exp. Med jem.20100986. [DOI] [PMC free article] [PubMed]
- 33.Long EO, Kim HS, Liu D, Peterson ME, and Rajagopalan S. 2013. Controlling natural killer cell responses: integration of signals for activation and inhibition. Annu. Rev. Immunol 31: 227–258. [DOI] [PMC free article] [PubMed] [Google Scholar]
- 34.Yokoyama WM, and Kim S. 2006. How do natural killer cells find self to achieve tolerance? Immunity 24: 249–257. [DOI] [PubMed] [Google Scholar]
- 35.Höglund P, and Brodin P. 2010. Current perspectives of natural killer cell education by MHC class I molecules. Nat. Rev. Immunol 10: 724–734. [DOI] [PubMed] [Google Scholar]
- 36.Joncker NT, and Raulet DH. 2008. Regulation of NK cell responsiveness to achieve self-tolerance and maximal responses to diseased target cells. Immunol. Rev 224: 85–97. [DOI] [PMC free article] [PubMed] [Google Scholar]
- 37.Achdout H, Manaster I, and Mandelboim O. 2008. Influenza virus infection augments NK cell inhibition through reorganization of major histocompatibility complex class I proteins. J. Virol 82: 8030–8037. [DOI] [PMC free article] [PubMed] [Google Scholar]
- 38.Cerwenka A, and Lanier LL. 2001. Ligands for natural killer cell receptors: redundancy or specificity. Immunol. Rev 181: 158–169. [DOI] [PubMed] [Google Scholar]
- 39.Mandelboim O, Lieberman N, Lev M, Paul L, Arnon TI, Bushkin Y, Davis DM, Strominger JL, Yewdell JW, and Porgador A. 2001. Recognition of haemagglutinins on virus-infected cells by NKp46 activates lysis by human NK cells. Nature 409: 1055–1060. [DOI] [PubMed] [Google Scholar]
- 40.Mendelson M, Tekoah Y, Zilka A, Gershoni-Yahalom O, Gazit R, Achdout H, Bovin NV, Meningher T, Mandelboim M, Mandelboim O, David A, and Porgador A. 2010. NKp46 O-glycan sequences that are involved in the interaction with hemagglutinin type 1 of influenza virus. J. Virol 84: 3789–3797. [DOI] [PMC free article] [PubMed] [Google Scholar]
- 41.Biron CA, Nguyen KB, Pien GC, Cousens LP, and Salazar-Mather TP. 1999. Natural killer cells in antiviral defense: function and regulation by innate cytokines. Annu. Rev. Immunol 17: 189–220. [DOI] [PubMed] [Google Scholar]
- 42.Vendrame E, Fukuyama J, Strauss-Albee DM, Holmes S, and Blish CA. 2017. Mass Cytometry Analytical Approaches Reveal Cytokine-Induced Changes in Natural Killer Cells. Cytometry B Clin. Cytom 92: 57–67. [DOI] [PMC free article] [PubMed] [Google Scholar]
- 43.Ni J, Miller M, Stojanovic A, Garbi N, and Cerwenka A. 2012. Sustained effector function of IL-12/15/18–preactivated NK cells against established tumors. J. Exp. Med jem.20120944. [DOI] [PMC free article] [PubMed]
- 44.Valiante NM, Lienert K, Shilling HG, Smits BJ, and Parham P. 1997. Killer cell receptors: keeping pace with MHC class I evolution. Immunol. Rev 155: 155–164. [DOI] [PubMed] [Google Scholar]
- 45.Mestas J, and Hughes CCW. 2004. Of mice and not men: differences between mouse and human immunology. J. Immunol 172: 2731–2738. [DOI] [PubMed] [Google Scholar]
- 46.Hirst GK 1947. STUDIES ON THE MECHANISM OF ADAPTATION OF INFLUENZA VIRUS TO MICE. J. Exp. Med 86: 357–366. [DOI] [PMC free article] [PubMed] [Google Scholar]
- 47.Dobin A, Davis CA, Schlesinger F, Drenkow J, Zaleski C, Jha S, Batut P, Chaisson M, and Gingeras TR. 2013. STAR: ultrafast universal RNA-seq aligner. Bioinformatics 29: 15–21. [DOI] [PMC free article] [PubMed] [Google Scholar]
- 48.Langmead B, Trapnell C, Pop M, and Salzberg SL. 2009. Ultrafast and memory-efficient alignment of short DNA sequences to the human genome. Genome Biol 10: R25. [DOI] [PMC free article] [PubMed] [Google Scholar]
- 49.Trapnell C, Roberts A, Goff L, Pertea G, Kim D, Kelley DR, Pimentel H, Salzberg SL, Rinn JL, and Pachter L. 2012. Differential gene and transcript expression analysis of RNA-seq experiments with TopHat and Cufflinks. Nat. Protoc 7: 562–578. [DOI] [PMC free article] [PubMed] [Google Scholar]
- 50.Love MI, Huber W, and Anders S. 2014. Moderated estimation of fold change and dispersion for RNA-seq data with DESeq2. Genome Biol 15: 550. [DOI] [PMC free article] [PubMed] [Google Scholar]
- 51.Team RC 2016. A language and environment for statistical computing R Foundation for statistical computing, 2015; Vienna, Austria. . [Google Scholar]
- 52.Nacu S, Critchley-Thorne R, Lee P, and Holmes S. 2007. Gene expression network analysis and applications to immunology. Bioinformatics 23: 850–858. [DOI] [PubMed] [Google Scholar]
- 53.Beisser D, Klau GW, Dandekar T, Müller T, and Dittrich MT. 2010. BioNet: an R-Package for the functional analysis of biological networks. Bioinformatics 26: 1129–1130. [DOI] [PubMed] [Google Scholar]
- 54.Gentleman RC, Carey VJ, Bates DM, Bolstad B, Dettling M, Dudoit S, Ellis B, Gautier L, Ge Y, Gentry J, Hornik K, Hothorn T, Huber W, Iacus S, Irizarry R, Leisch F, Li C, Maechler M, Rossini AJ, Sawitzki G, Smith C, Smyth G, Tierney L, Yang JYH, and Zhang J. 2004. Bioconductor: open software development for computational biology and bioinformatics. Genome Biol 5: R80. [DOI] [PMC free article] [PubMed] [Google Scholar]
- 55.Strauss-Albee DM, Fukuyama J, Liang EC, Yao Y, Jarrell JA, Drake AL, Kinuthia J, Montgomery RR, John-Stewart G, Holmes S, and Blish CA. 2015. Human NK cell repertoire diversity reflects immune experience and correlates with viral susceptibility. Sci. Transl. Med 7: 297ra115–297ra115. [DOI] [PMC free article] [PubMed] [Google Scholar]
- 56.Bendall SC, Simonds EF, Qiu P, Amir E-AD, Krutzik PO, Finck R, Bruggner RV, Melamed R, Trejo A, Ornatsky OI, Balderas RS, Plevritis SK, Sachs K, Pe’er D, Tanner SD, and Nolan GP. 2011. Single-cell mass cytometry of differential immune and drug responses across a human hematopoietic continuum. Science 332: 687–696. [DOI] [PMC free article] [PubMed] [Google Scholar]
- 57.Newell EW, Sigal N, Bendall SC, Nolan GP, and Davis MM. 2012. Cytometry by time-of-flight shows combinatorial cytokine expression and virus-specific cell niches within a continuum of CD8+ T cell phenotypes. Immunity 36: 142–152. [DOI] [PMC free article] [PubMed] [Google Scholar]
- 58.Kay AW, Strauss-Albee DM, and Blish CA. 2016. Application of Mass Cytometry (CyTOF) for Functional and Phenotypic Analysis of Natural Killer Cells. Methods Mol. Biol 1441: 13–26. [DOI] [PMC free article] [PubMed] [Google Scholar]
- 59.Horowitz A, Strauss-Albee DM, Leipold M, Kubo J, Nemat-Gorgani N, Dogan OC, Dekker CL, Mackey S, Maecker H, Swan GE, Davis MM, Norman PJ, Guethlein LA, Desai M, Parham P, and Blish CA. 2013. Genetic and environmental determinants of human NK cell diversity revealed by mass cytometry. Sci. Transl. Med 5: 208ra145–208ra145. [DOI] [PMC free article] [PubMed] [Google Scholar]
- 60.Finck R, Simonds EF, Jager A, Krishnaswamy S, Sachs K, Fantl W, Pe’er D, Nolan GP, and Bendall SC. 2013. Normalization of mass cytometry data with bead standards. Cytometry A 83: 483–494. [DOI] [PMC free article] [PubMed] [Google Scholar]
- 61.Perry PO 2017. Fast moment-based estimation for hierarchical models. J. R. Stat. Soc. Series B Stat. Methodol 79: 267–291. [Google Scholar]
- 62.He X-S, Draghi M, Mahmood K, Holmes TH, Kemble GW, Dekker CL, Arvin AM, Parham P, and Greenberg HB. 2004. T cell-dependent production of IFN-gamma by NK cells in response to influenza A virus. J. Clin. Invest 114: 1812–1819. [DOI] [PMC free article] [PubMed] [Google Scholar]
- 63.Hoeve MA, Nash AA, Jackson D, Randall RE, and Dransfield I. 2012. Influenza virus A infection of human monocyte and macrophage subpopulations reveals increased susceptibility associated with cell differentiation. PLoS One 7: e29443. [DOI] [PMC free article] [PubMed] [Google Scholar]
- 64.Siren J, Sareneva T, Pirhonen J, Strengell M, Veckman V, Julkunen I, and Matikainen S. 2004. Cytokine and contact-dependent activation of natural killer cells by influenza A or Sendai virus-infected macrophages. J. Gen. Virol 85: 2357–2364. [DOI] [PubMed] [Google Scholar]
- 65.Draghi M, Pashine A, Sanjanwala B, Gendzekhadze K, Cantoni C, Cosman D, Moretta A, Valiante NM, and Parham P. 2007. NKp46 and NKG2D recognition of infected dendritic cells is necessary for NK cell activation in the human response to influenza infection. J. Immunol 178: 2688–2698. [DOI] [PubMed] [Google Scholar]
- 66.Alter G, Malenfant JM, and Altfeld M. 2004. CD107a as a functional marker for the identification of natural killer cell activity. J. Immunol. Methods 294: 15–22. [DOI] [PubMed] [Google Scholar]
- 67.Bryceson YT, March ME, Barber DF, Ljunggren H-G, and Long EO. 2005. Cytolytic granule polarization and degranulation controlled by different receptors in resting NK cells. J. Exp. Med 202: 1001–1012. [DOI] [PMC free article] [PubMed] [Google Scholar]
- 68.Henney CS, Kuribayashi K, Kern DE, and Gillis S. 1981. Interleukin-2 augments natural killer cell activity. Nature 291: 335–338. [DOI] [PubMed] [Google Scholar]
- 69.Trinchieri G, Matsumoto-Kobayashi M, Clark SC, Seehra J, London L, and Perussia B. 1984. Response of resting human peripheral blood natural killer cells to interleukin J. Exp. Med 160: 1147–1169. [DOI] [PMC free article] [PubMed] [Google Scholar]
- 70.Caligiuri MA, Murray C, Robertson MJ, Wang E, Cochran K, Cameron C, Schow P, Ross ME, Klumpp TR, and Soiffer RJ. 1993. Selective modulation of human natural killer cells in vivo after prolonged infusion of low dose recombinant interleukin J. Clin. Invest 91: 123–132. [DOI] [PMC free article] [PubMed] [Google Scholar]
- 71.Sun JC, Beilke JN, and Lanier LL. 2009. Adaptive immune features of natural killer cells. Nature 457: 557–561. [DOI] [PMC free article] [PubMed] [Google Scholar]
- 72.Vivier E, Raulet DH, Moretta A, Caligiuri MA, Zitvogel L, Lanier LL, Yokoyama WM, and Ugolini S. 2011. Innate or adaptive immunity? The example of natural killer cells. Science 331: 44–49. [DOI] [PMC free article] [PubMed] [Google Scholar]
- 73.Paust S, and von Andrian UH. 2011. Natural killer cell memory. Nat. Immunol 12: 500–508. [DOI] [PubMed] [Google Scholar]
- 74.Paust S, Gill HS, Wang B-Z, Flynn MP, Moseman EA, Senman B, Szczepanik M, Telenti A, Askenase PW, Compans RW, and von Andrian UH. 2010. Critical role for the chemokine receptor CXCR6 in NK cell-mediated antigen-specific memory of haptens and viruses. Nat. Immunol 11: 1127–1135. [DOI] [PMC free article] [PubMed] [Google Scholar]
- 75.Szklarczyk D, Franceschini A, Wyder S, Forslund K, Heller D, Huerta-Cepas J, Simonovic M, Roth A, Santos A, Tsafou KP, Kuhn M, Bork P, Jensen LJ, and von Mering C. 2015. STRING v10: protein-protein interaction networks, integrated over the tree of life. Nucleic Acids Res 43: D447–52. [DOI] [PMC free article] [PubMed] [Google Scholar]
- 76.Davis AS, Chertow DS, Moyer JE, Suzich J, Sandouk A, Dorward DW, Logun C, Shelhamer JH, and Taubenberger JK. 2015. Validation of normal human bronchial epithelial cells as a model for influenza A infections in human distal trachea. J. Histochem. Cytochem 63: 312–328. [DOI] [PMC free article] [PubMed] [Google Scholar]
- 77.Bryceson YT, March ME, Ljunggren HG, and Long EO. 2006. Synergy among receptors on resting NK cells for the activation of natural cytotoxicity and cytokine secretion. Blood 107: 159–166. [DOI] [PMC free article] [PubMed] [Google Scholar]
- 78.Fauriat C, Long EO, Ljunggren H-G, and Bryceson YT. 2010. Regulation of human NK-cell cytokine and chemokine production by target cell recognition. Blood 115: 2167–2176. [DOI] [PMC free article] [PubMed] [Google Scholar]
- 79.Bottino C, Castriconi R, Pende D, Rivera P, Nanni M, Carnemolla B, Cantoni C, Grassi J, Marcenaro S, Reymond N, Vitale M, Moretta L, Lopez M, and Moretta A. 2003. Identification of PVR (CD155) and Nectin-2 (CD112) as cell surface ligands for the human DNAM-1 (CD226) activating molecule. J. Exp. Med 198: 557–567. [DOI] [PMC free article] [PubMed] [Google Scholar]
- 80.Orange JS 2008. Formation and function of the lytic NK-cell immunological synapse. Nat. Rev. Immunol 8: 713–725. [DOI] [PMC free article] [PubMed] [Google Scholar]
- 81.Barber DF, Faure M, and Long EO. 2004. LFA-1 contributes an early signal for NK cell cytotoxicity. J. Immunol 173: 3653–3659. [DOI] [PubMed] [Google Scholar]
- 82.García-Sastre A, Egorov A, Matassov D, Brandt S, Levy DE, Durbin JE, Palese P, and Muster T. 1998. Influenza A virus lacking the NS1 gene replicates in interferon-deficient systems. Virology 252: 324–330. [DOI] [PubMed] [Google Scholar]
- 83.Wang X, Li M, Zheng H, Muster T, Palese P, Beg AA, and García-Sastre A. 2000. Influenza A virus NS1 protein prevents activation of NF-kappaB and induction of alpha/beta interferon. J. Virol 74: 11566–11573. [DOI] [PMC free article] [PubMed] [Google Scholar]
- 84.Gack MU, Albrecht RA, Urano T, Inn K-S, Huang I-C, Carnero E, Farzan M, Inoue S, Jung JU, and García-Sastre A. 2009. Influenza A virus NS1 targets the ubiquitin ligase TRIM25 to evade recognition by the host viral RNA sensor RIG-I. Cell Host Microbe 5: 439–449. [DOI] [PMC free article] [PubMed] [Google Scholar]
- 85.Geiss GK, Salvatore M, Tumpey TM, Carter VS, Wang X, Basler CF, Taubenberger JK, Bumgarner RE, Palese P, Katze MG, and García-Sastre A. 2002. Cellular transcriptional profiling in influenza A virus-infected lung epithelial cells: the role of the nonstructural NS1 protein in the evasion of the host innate defense and its potential contribution to pandemic influenza. Proc. Natl. Acad. Sci. U. S. A 99: 10736–10741. [DOI] [PMC free article] [PubMed] [Google Scholar]
- 86.Owen RE, Yamada E, Thompson CI, Phillipson LJ, Thompson C, Taylor E, Zambon M, Osborn HMI, Barclay WS, and Borrow P. 2007. Alterations in receptor binding properties of recent human influenza H3N2 viruses are associated with reduced natural killer cell lysis of infected cells. J. Virol 81: 11170–11178. [DOI] [PMC free article] [PubMed] [Google Scholar]
- 87.Du N, Zhou J, Lin X, Zhang Y, Yang X, Wang Y, and Shu Y. 2010. Differential activation of NK cells by influenza A pseudotype H5N1 and 1918 and 2009 pandemic H1N1 viruses. J. Virol 84: 7822–7831. [DOI] [PMC free article] [PubMed] [Google Scholar]
- 88.Achdout H, Meningher T, Hirsh S, Glasner A, Bar-On Y, Gur C, Porgador A, Mendelson M, Mandelboim M, and Mandelboim O. 2010. Killing of avian and Swine influenza virus by natural killer cells. J. Virol 84: 3993–4001. [DOI] [PMC free article] [PubMed] [Google Scholar]
- 89.Grauwet K, Cantoni C, Parodi M, De Maria A, Devriendt B, Pende D, Moretta L, Vitale M, and Favoreel HW. 2014. Modulation of CD112 by the alphaherpesvirus gD protein suppresses DNAM-1-dependent NK cell-mediated lysis of infected cells. Proc. Natl. Acad. Sci. U. S. A 111: 16118–16123. [DOI] [PMC free article] [PubMed] [Google Scholar]
- 90.Coscoy L, and Ganem D. 2001. A viral protein that selectively downregulates ICAM-1 and B7–2 and modulates T cell costimulation. J. Clin. Invest 107: 1599–1606. [DOI] [PMC free article] [PubMed] [Google Scholar]
- 91.Manes TD, Hoer S, Muller WA, Lehner PJ, and Pober JS. 2010. Kaposi’s sarcoma-associated herpesvirus K3 and K5 proteins block distinct steps in transendothelial migration of effector memory CD4+ T cells by targeting different endothelial proteins. J. Immunol 184: 5186–5192. [DOI] [PMC free article] [PubMed] [Google Scholar]
- 92.Reeves RK, Li H, Jost S, Blass E, Li H, Schafer JL, Varner V, Manickam C, Eslamizar L, Altfeld M, von Andrian UH, and Barouch DH. 2015. Antigen-specific NK cell memory in rhesus macaques. Nat. Immunol 16: 927–932. [DOI] [PMC free article] [PubMed] [Google Scholar]
- 93.Goodier MR, Rodriguez-Galan A, Lusa C, Nielsen CM, Darboe A, Moldoveanu AL, White MJ, Behrens R, and Riley EM. 2016. Influenza Vaccination Generates Cytokine-Induced Memory-like NK Cells: Impact of Human Cytomegalovirus Infection. J. Immunol 197: 313–325. [DOI] [PMC free article] [PubMed] [Google Scholar]
- 94.Darboe A, Danso E, Clarke E, Umesi A, Touray E, Wegmuller R, Moore SE, Riley EM, and Goodier MR. 2017. Enhancement of cytokine-driven NK cell IFN-γ production after vaccination of HCMV infected Africans. Eur. J. Immunol 47: 1040–1050. [DOI] [PMC free article] [PubMed] [Google Scholar]
- 95.Bashirova AA, Thomas R, and Carrington M. 2011. HLA/KIR restraint of HIV: surviving the fittest. Annu. Rev. Immunol 29: 295–317. [DOI] [PMC free article] [PubMed] [Google Scholar]
- 96.Hölzemer A, Thobakgale CF, Jimenez Cruz CA, Garcia-Beltran WF, Carlson JM, van Teijlingen NH, Mann JK, Jaggernath M, Kang S-G, Körner C, Chung AW, Schafer JL, Evans DT, Alter G, Walker BD, Goulder PJ, Carrington M, Hartmann P, Pertel T, Zhou R, Ndung’u T, and Altfeld M. 2015. Selection of an HLA-C*03:04-Restricted HIV-1 p24 Gag Sequence Variant Is Associated with Viral Escape from KIR2DL3+ Natural Killer Cells: Data from an Observational Cohort in South Africa. PLoS Med 12: e1001900–discussion e1001900. [DOI] [PMC free article] [PubMed] [Google Scholar]
- 97.Davis ZB, Cogswell A, Scott H, Mertsching A, Boucau J, Wambua D, Le Gall S, Planelles V, Campbell KS, and Barker E. 2016. A Conserved HIV-1-Derived Peptide Presented by HLA-E Renders Infected T-cells Highly Susceptible to Attack by NKG2A/CD94-Bearing Natural Killer Cells. PLoS Pathog 12: e1005421. [DOI] [PMC free article] [PubMed] [Google Scholar]
- 98.Ahlenstiel G, Martin MP, Gao X, Carrington M, and Rehermann B. 2008. Distinct KIR/HLA compound genotypes affect the kinetics of human antiviral natural killer cell responses. J. Clin. Invest 118: 1017–1026. [DOI] [PMC free article] [PubMed] [Google Scholar]
- 99.Cardani A, Boulton A, Kim TS, and Braciale TJ. 2017. Alveolar Macrophages Prevent Lethal Influenza Pneumonia By Inhibiting Infection Of Type-1 Alveolar Epithelial Cells. PLoS Pathog 13: e1006140. [DOI] [PMC free article] [PubMed] [Google Scholar]
- 100.Liu Q, Zhou Y-H, and Yang Z-Q. 2016. The cytokine storm of severe influenza and development of immunomodulatory therapy. Cell. Mol. Immunol 13: 3–10. [DOI] [PMC free article] [PubMed] [Google Scholar]
- 101.Gao R, Bhatnagar J, Blau DM, Greer P, Rollin DC, Denison AM, Deleon-Carnes M, Shieh W-J, Sambhara S, Tumpey TM, Patel M, Liu L, Paddock C, Drew C, Shu Y, Katz JM, and Zaki SR. 2013. Cytokine and chemokine profiles in lung tissues from fatal cases of 2009 pandemic influenza A (H1N1): role of the host immune response in pathogenesis. Am. J. Pathol 183: 1258–1268. [DOI] [PMC free article] [PubMed] [Google Scholar]
- 102.Hayden FG, Fritz R, Lobo MC, Alvord W, Strober W, and Straus SE. 1998. Local and systemic cytokine responses during experimental human influenza A virus infection. Relation to symptom formation and host defense. J. Clin. Invest 101: 643–649. [DOI] [PMC free article] [PubMed] [Google Scholar]
- 103.Bermejo-Martin JF, Ortiz de Lejarazu R, Pumarola T, Rello J, Almansa R, Ramírez P, Martin-Loeches I, Varillas D, Gallegos MC, Serón C, Micheloud D, Gomez JM, Tenorio-Abreu A, Ramos MJ, Molina ML, Huidobro S, Sanchez E, Gordón M, Fernández V, Del Castillo A, Marcos MA, Villanueva B, López CJ, Rodríguez-Domínguez M, Galan J-C, Cantón R, Lietor A, Rojo S, Eiros JM, Hinojosa C, Gonzalez I, Torner N, Banner D, Leon A, Cuesta P, Rowe T, and Kelvin DJ. 2009. Th1 and Th17 hypercytokinemia as early host response signature in severe pandemic influenza. Crit. Care 13: R201. [DOI] [PMC free article] [PubMed] [Google Scholar]
- 104.Cillóniz C, Shinya K, Peng X, Korth MJ, Proll SC, Aicher LD, Carter VS, Chang JH, Kobasa D, Feldmann F, Strong JE, Feldmann H, Kawaoka Y, and Katze MG. 2009. Lethal influenza virus infection in macaques is associated with early dysregulation of inflammatory related genes. PLoS Pathog 5: e1000604. [DOI] [PMC free article] [PubMed] [Google Scholar]
- 105.Niu C, Jin H, Li M, Zhu S, Zhou L, Jin F, Zhou Y, Xu D, Xu J, Zhao L, Hao S, Li W, and Cui J. 2017. Low-dose bortezomib increases the expression of NKG2D and DNAM-1 ligands and enhances induced NK and γδ T cell-mediated lysis in multiple myeloma. Oncotarget 8: 5954–5964. [DOI] [PMC free article] [PubMed] [Google Scholar]
Associated Data
This section collects any data citations, data availability statements, or supplementary materials included in this article.