Abstract
Objective: Currently, when cytopathology images are archived, they are typically stored with a limited text-based description of their content. Such a description inherently fails to quantify the properties of an image and refers to an extremely small fraction of its information content. This paper describes a method for automatically indexing images of individual cells and their associated diagnoses by computationally derived cell descriptors. This methodology may serve to better index data contained in digital image databases, thereby enabling cytologists and pathologists to cross-reference cells of unknown etiology or nature.
Design: The indexing method, implemented in a program called PathMaster, uses a series of computer-based feature extraction routines. Descriptors of individual cell characteristics generated by these routines are employed as indexes of cell morphology, texture, color, and spatial orientation.
Measurements: The indexing fidelity of the program was tested after populating its database with images of 152 lymphocytes/lymphoma cells captured from lymph node touch preparations stained with hematoxylin and eosin. Images of “unknown” lymphoid cells, previously unprocessed, were then submitted for feature extraction and diagnostic cross-referencing analysis.
Results: PathMaster listed the correct diagnosis as its first differential in 94 percent of recognition trials. In the remaining 6 percent of trials, PathMaster listed the correct diagnosis within the first three “differentials.”
Conclusion: PathMaster is a pilot cell image indexing program/search engine that creates an indexed reference of images. Use of such a reference may provide assistance in the diagnostic/prognostic process by furnishing a prioritized list of possible identifications for a cell of uncertain etiology.
As digital image cytometry becomes more widely accepted by pathologists, image databases are growing at an impressive rate.1 In the pathology domain, the majority of acquired images are currently stored with a limited text-based description of their content. As image databases expand, it is becoming increasingly apparent that these simple text-based descriptions are inadequate for the proper cataloging of images. As a consequence, valuable diagnostic and prognostic information contained in such databases remains unusable.
Attempts to derive more practical descriptors for each image by simply applying existing domain-independent image processing and analytical software have met with little success, most likely because only a limited number of non-domain-specific descriptors were computed. Furthermore, in these domain-independent approaches, no attempt was made to subclassify (segment) image regions into components such as background, cytoplasm, nucleus, and nucleolus.2,3 Rather, the entire image was processed without regard to its individual constituents. This approach lacks the required sophistication that a domain specific algorithm can provide to properly subclassify object descriptors and ignore irrelevant or incidental image data. By creating and employing such a program, cytometrists should be able not only to derive relevant object descriptors for image cataloging and report retrieval but also to cross-reference images of unknown cell types to assist in identification.
PathMaster is a program, currently undergoing development and refinement, that computes discriminants that can reject many potential false positive matches by encoding image data with the fidelity required to retain the majority of a cell's features. The ability to search for instances of the same (or similar) image events depends on metrics for comparing image objects and properties (e.g., shape, texture, color, and object relationships) that can match human judgments of similarity. Without this provision, the images that a program retrieves will generally not be those desired by the human user. This does not necessitate, however, that computations emulate human vision and reasoning, but rather that factors of similarity must generally be correlated.4 Indeed, there is sufficient evidence to substantiate the existence of “subvisual information,” that is, information in an image that either the human observer disregards or is incapable of adequately assessing. Although these features are not visually apparent, they may function as the basis for image classification methods, providing that the results are equivalent to those assigned by pathologists.4 If these categories are clinically useful, differences in detection methods between computer and human vision can be complementary. Such differences in method may generate additional classifications that can not be easily evaluated by human vision and can therefore supplement the existing pathology grading systems.4
As a consequence, we propose that one solution to the image database searching problem is the use of what some have called “semantics-preserving image compression,” that is, compact numeric representations that contain data sufficiently accurate and complete for image comparison.5
This paper describes a “semantics-preserving” feature extracting and comparing program. PathMaster was designed to analyze images of individual cells for image database cross-referencing. The design criteria require a user to capture a high-power (60 × objective) digital image of a “suspicious” cell or cell of unknown lineage and subsequently submit that image for a similarity match. The similarity match includes a search of the entire PathMaster image database. In each image-to-image comparison, features of the two cells are compared and differences are calculated. The “weights” of these differences are user-programmable and allow irrelevant or less important disparities in features to be ignored. Likewise, weights may be adjusted to amplify disparities of features that are (or that the user considers to be) more useful for discriminating between various cell populations. Once the comparisons have been completed, the difference scores are tabulated and ranked. A list of prioritized diagnoses and their associated images are then returned to the user.
Background
A range of projects have applied digital image cytometry in different clinical domains. For example, digital image cytometry is used to screen Pap smears.6,7 In this method, cells on a slide preparation are scanned with a microscope equipped with a digital camera and are subsequently analyzed. The results of the analysis are used to classify cells as normal or abnormal and, in the latter case, prompt the pathologist for further evaluation. Image analysis has also been employed to extract prognostic determinates for breast cancers,8 prostate cancers,9 ocular melanomas,10 and idiopathic cardiomyopathies.11 Multiparametric image cytometry has been used to measure lymphocyte nuclear size, shape, texture, and DNA content. With these measurements alone, investigators are able to distinguish between the early stages of mycosis fungoides and eczematous dermatitis with an accuracy of 94 percent.12
Quantitative nuclear texture analysis has been used to detect recurrences in transitional cell carcinoma with a 97 percent sensitivity. This compares with the 50 to 75 percent sensitivity of standard urine cytology. There is little doubt that extraction of quantitative features from cell images will alter the method by which neoplasms are graded and subclassified.14
As efforts continue to limit the rising national cost of health care, pathologists are being asked to make accurate diagnoses from more limited procedures, such as fine-needle aspirates, that produce samples consisting predominantly of desegregated cells. Since these samples lack the architectural information of standard histologic sections, pathologists need to develop new methods designed to extract diagnostic information from these smaller specimens. Examination of subvisual structural data obtainable from computational analysis of digitized high-resolution images of cells is one such approach. As a result, it is important that the science of digital cytometric analysis be adapted, extended, and refined to exploit fully the current state of the art in digital image analysis.
Materials and Methods
PathMaster's Design
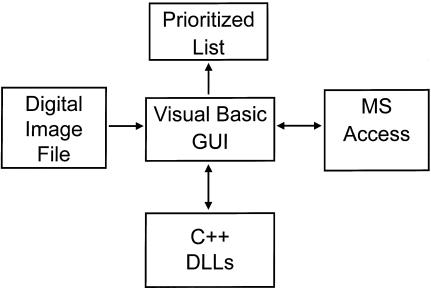
PathMaster contains a cytology-specific feature extraction program written as an aggregate of independent but orchestrated algorithms, which includes a Visual Basic graphical user interface, a Microsoft Access object linking and embedding server, and a group of C++ dynamically linked libraries (▶). For this study, PathMaster was executed on a Pentium 200 MMX machine.
Figure 1.
PathMaster is composed of an aggregate of independent algorithms that are orchestrated by a Visual Basic graphical user interface (GUI). Note: MS indicates Microsoft; DLLs, dynamically linked libraries.
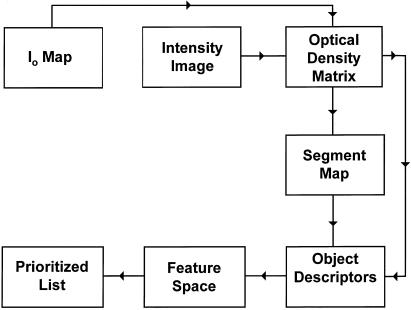
In operation, a user currently submits a digital image of a single cell to be cross-referenced or identified (▶). Once submitted, features of the cell image, including those of color, morphology, texture, and spatial relationships, are extracted. These features are then compared with and scored against those of cells stored in the PathMaster database. A list of cell images and their associated reports is then generated in an order indicating best to worst match.
Figure 2.
The extraction and comparison of cell features are accomplished by several conversion and analytic routines. Since intensity values of these matrixes vary with both the incident light intensity (Io) and the optical density of the specimen, each intensity matrix is converted to an optical density matrix. Cell descriptors that are extracted include colorimetric, multi-resolution textural, and domain-specific morphologic parameters. Descriptors are then used as coordinates to map the characteristics of each cell to a position in feature space. When an unknown cell is submitted for evaluation, the distance between its position and the positions that characterize other cells in feature space are calculated. These distances are used to generate an ordered list of matches.
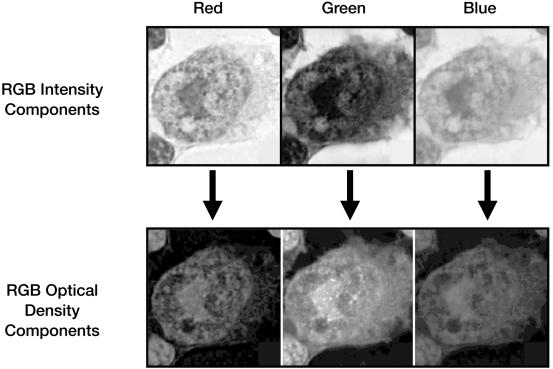
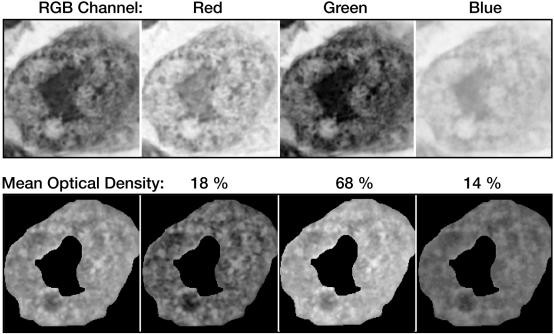
The extraction and comparison of features occurs by the use of several conversion and analytic routines, the first of which processes the submitted intensity image. The user must acquire the image in a manner compatible with data already contained in the image database. To that end, an acquisition protocol was adopted. This protocol, designed to control for a variety of user-dependent variables, requires that all images be captured at a fixed optical resolution (60 × objective) with a digital resolution of 3,072 × 2,320 pixels × 24-bit color. This combination of optical and digital resolutions increases texture resolution while providing an adequate depth of field. Once captured and submitted, the intensity image is resolved into its red, green, and blue components (▶). These components are thereafter processed as individual gray-level matrixes.
Figure 3.
Intensity images are resolved into their red, green, and blue (RGB) components for analysis. During analysis, each RGB component is addressed as a gray-level matrix.
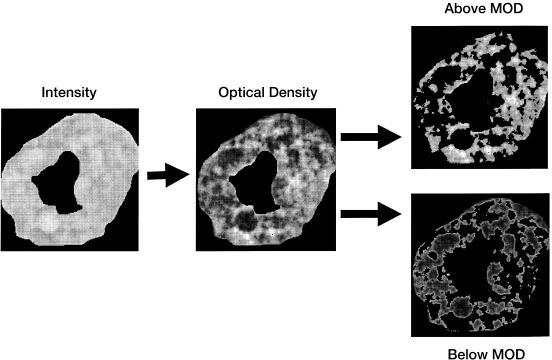
Intensity images (matrixes) are not in the best form to process mathematically. Among other complications, intensity images vary not only as a function of specimen optical density but also as a function of incident intensity. To control for variations in illumination, intensity images are converted to individual red, green, and blue optical density maps (▶). To complete this conversion, the user must submit an incident intensity map or “background” image of the field of interest.
Figure 4.
Intensity values of an image vary with both the incident light intensity and the optical density of the specimen. To control for variations in incident intensity, the RGB component matrixes of an image are converted to optical density matrixes. These matrixes are used for all subsequent cytometric calculations.
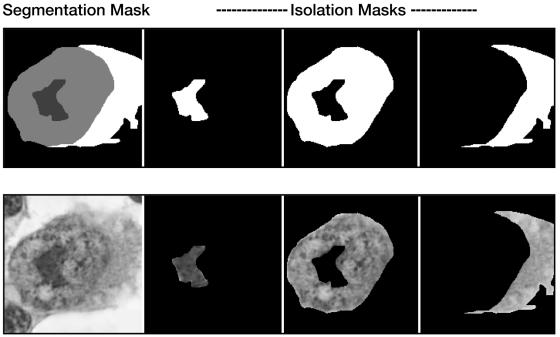
To properly process a cell image, it is first necessary to designate and effectively separate (segment) regions of background, cytoplasm, nucleus, and nucleolus (▶). Image segmentation is achieved by creating a 2-bit mask overlay of the image. The resulting four levels of gray designate individual regions of interest.
Figure 5.
Image segmentation. Binary isolation masks are generated for each region, including cytoplasm, nucleus, and nucleolus. Isolation masks are used by processing routines to identify individual segments to be analyzed.
Of the various segmentation methods available, manual segmentation using the advanced selection tools of Adobe PhotoShop is perhaps the most reliable. The average time required by the experienced user to segment an image is less than one minute. Using the segmentation mask, the computer generates up to three binary isolation masks (one each for the cytoplasm, nucleus, and nucleolus). These binary masks provide the means by which the computer can isolate each region for analysis.
The efficiency of several recently published automated cell segmentation methods15 are currently being investigated. One such method has been successfully employed to generate computer-determined cell boundaries of prostate cells. This segmentation algorithm, once adapted for use with PathMaster, may reliably and efficiently eliminate the need for manually traced cell boundaries and the associated interobserver variation.
Analysis of a cell includes the extraction of region-specific features, also referred to as object descriptors. PathMaster extracts four types of descriptors, including those of morphology, optical density, texture, and object-relative spatial relationships. Descriptors are calculated separately for each segment. For example, the mean optical density to red, green, and blue light is calculated separately for the cytoplasm, nucleus, and nucleolus (▶). The current descriptor types used by PathMaster are listed in ▶.
Figure 6.
Mean optical density of nucleus. Optical density descriptors are computed for all three (RGB) color channels. The mean optical density is calculated across all three channels and is expressed as a percentage of the total density. The nucleus of this specimen is densest to green light.
Table 1.
Examples of Descriptors Extracted from Each Segment and Subsegment of an Image
| Segment | Descriptors |
|---|---|
| Cytoplasm | Mean optical density, RGB |
| Area | |
| Perimeter | |
| Contour | |
| Fourier decomposition | |
| Geometric primitive best fit | |
| Markov texture, r ε [1, 5], RGB | |
| Statistical moments, RGB | |
| Nucleus | Mean optical density, RGB |
| Area | |
| Perimeter | |
| Ratio of nuclear area to cytoplasm area | |
| Eccentricity | |
| Contour | |
| Fourier decomposition | |
| Geometric primitive best fit | |
| Markov texture, r ε [1, 5], RGB | |
| Statistical moments, RGB | |
| Nuclear subsegments | Markov texture, r = 1, RGB |
| Statistical moments, RGB | |
| Nucleolus | Mean optical density, RGB |
| Area | |
| Perimeter | |
| Nucleolus/nucleus area ratio | |
| Eccentricity | |
| Contour | |
| Fourier decomposition | |
| Geometric primitive best fit | |
| Markov texture, r = 1, RGB | |
|
Statistical moments, RGB
|
|
| Note: r values indicate the window size of the gray-level co-occurrence matrix expressed in horizontal pixels. | |
Descriptors of texture include statistical, Markov, and Fourier descriptors.14 Statistical features include mean optical density, normalized variance (which approaches 0 with uniform optical density histograms), normalized skewness (which approaches zero for symmetric histograms), and kurtosis (which approaches 3 when histograms are gaussian).14
Regional Markov descriptors of cytoplasm, nucleus, and nucleolus are assessed at multiple resolutions by varying the window size, r, with which the gray-level co-occurrence matrix (GLCM) is compiled. The value of an element in the GLCM located in the xth column of the yth row is an estimate of the probability that the gray-level x will co-occur with a gray-level y at a fixed distance r. Each GLCM is compiled using a method that provides for rotational invariance.16 PathMaster analyzes nuclear texture to a greater extent than it does the texture of other segments. In addition to extracting features from the entire nucleus, the program also subsegments the nucleus into regions of high and low optical densities. Ranges of high and low optical density are defined using the mean optical density of the nuclear region as a threshold for division (▶). Assessed Markov principles include energy, entropy, inertia, correlation, local homogeneity, prominence, and shade.14
Figure 7.
Subsegmentation (blue channel). PathMaster subdivides the nucleus into regions of both high and low optical density. Ranges of high and low optical density are defined using the mean optical density (MOD) as a referent.
Two-dimensional power spectra of texture are generated with a fast Fourier transform. These spectra are condensed into four frequency bands to simplify comparisons. Only those harmonics that are identified as useful by the Nyquist sampling theorem are included in the comparison.
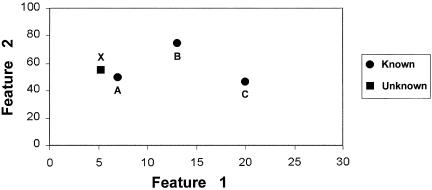
Once all descriptors are obtained, they are used as coordinates to map the characteristics of each cell to a position in feature space. ▶ depicts an example of two-dimensional space. Each point in space may uniquely characterize a cell. For example, when plotted against features 1 and 2, cells A and B map to the positions in space marked A and B. When an unknown cell is submitted for evaluation, the distance between its position and the position of other cells in feature space is computed. A series of cell images and their associated reports are then generated in an order indicating their distance from the unknown cell.
Figure 8.
A simplified example of two-dimensional feature space. Descriptors are used as coordinates to map the characteristics of each cell catalogued in a database to a position in two-dimensional feature space (“known” cell types). The position in feature space that characterizes the cell to be cross-referenced is also plotted (“unknown” cell type). “Distances” between the unknown and known cell types are computed. A list of similar cell types and their associated reports are then generated in an order indicating their distance from the unknown cell type.
Problem Domain Selection
Once PathMaster was completed, a problem domain was required for testing. Our test domain selection criteria were based on several factors, including the domain's level of diagnostic difficulty, the time required to render definitive diagnoses, and specimen availability. Diagnosis and classification of lymphoma can be a challenging task for pathologists, especially when they have only touch preparations immediately available for inspection. These considerations, in conjunction with the abundance and variety of touch preparations available in our department, led us to select lymphoma touch preparations as a test domain.
Digital Image Library
As an initial test of PathMaster's approach, a digital image library consisting of 152 images of individual lymphoma cells (84 percent of the total images), reactive lymphocytes, and “normal” lymphocytes were compiled from lymph node touch preparations stained with hematoxylin and eosin (H&E). Material used in touch preparations was sampled from a variety of different patient cases and lymph node resections. On average, six cell images were acquired from each case. Diagnoses obtained by light-microscopic examination of H&E-stained material were substantiated using immunologic based stains, flow cytometry, or molecular gene rearrangement studies, or a combination of these. Cell images acquired from three patient cases with equivocal diagnoses were excluded from compilation.
Samples of lymphomas composed of more than one cell type (e.g., mixed lymphoma) included representative cells from each cellular component. Cells intrinsic to the lesion in question, however, need not be the only source of diagnostic information. “Incidental” reactive cells may, in fact, provide more diagnostic cytologic information than those that make up the lesion.12 Thus, it was not always essential that the nature of the individual cell that was imaged be identified with absolute certainty.
Satisfactory touch preparations are a challenge to prepare. Their quality can be compromised by multiple flaws, including excessive preparation thickness, hemorrhage, crushed nuclei, naked nuclei, staining artifacts, and cell overlap. The majority of these flaws can be addressed by altering the weight profile used to score a search. For example, naked or fragmented nuclei may be used in a search providing that weights assigned to both cytoplasmic parameters and nuclear morphologies are zeroed. Staining artifacts may be addressed in a similar fashion by zeroing weights assigned to optical density features.
Although feature vectors derived from each cellular component were stored in the database individually, each cell pattern vector was tagged to indicate that they originated from the same case. This provision will allow for the comparison of cell clusters from each case in the future.
Cell image compilation included the extraction and database storage of more than 300 cell features obtained from region-specific morphologic and optical density measurements as well as a region-specific multi-resolution texture analysis.
Image acquisition was accomplished using a digital imaging workstation equipped with a Kontron ProgRes 3012 camera, which was used in conjunction with an Olympus Vanox AHBS3 photomicroscope specifically designed for higher-quality imaging and photomicrographic work. The microscope was equipped with 4×, 10×, 20×, and 40×, plan-apochromatic objectives and one 60× DPlan objective.
Feature Weights
Only a subset of the total features extracted were compared. We collectively refer to features employed in a search and their assigned weights as a “weight profile.” Although the weight profile used for each query is fully user-programmable, PathMaster has been equipped with several default and user-selectable preprogrammed profiles.
Default and user-selectable profiles were constructed only after an extensive analysis of their discriminating power. This assessment included an eigenvalue analysis. Only those features that were deemed to be of adequate discriminating power (P < 0.1) were assigned non-zero weights. The number of features assigned non-zero weights is dependent on the specific search criteria favored by the user. In the majority of weight profiles used, this number varied between 15 and 20.
Preliminary Testing of PathMaster's Performance
PathMaster's performance was assessed on the basis of its ability to select cells from the database that were similar to those submitted for analysis. The concept of “similarity,” however, can be an ambiguous one. The mathematical definition of similarity employed by PathMaster specifies a range of values for the Euclidean norm of weighted feature vector differences. Once such scores are obtained, a list of similar cell types and associated data are generated in an order indicating their “distance” from the unknown cell type.
Results
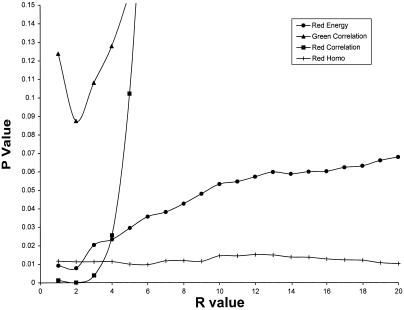
Although more than 300 features were extracted from each lymphoma cell, only a subset of these were of sufficient discriminating power to be used in image cross-referencing. In the preliminary testing described in this paper, features with the greatest utility included those of chromatin texture. Markov descriptors of texture were assessed at multiple resolutions by varying the window size, r, with which the GLCM was compiled.16 The importance of each descriptor as an index was dependent on the resolution at which it was assessed (▶). How to use these descriptors optimally is a subject of ongoing research. As described later, we have already expanded the number of computed features to more than 2,000 and are continually refining our mathematical approach for comparison.
Figure 9.
The statistical significance of differences between Markov descriptors of mantle cell nuclear texture and small cell lymphoma nuclear texture varies as a function of r, the radius with which the gray-level co-occurrence matrix was compiled. The P values of a Student t test are displayed. The r values are expressed as horizontal pixel distances. In the key, “Homo” indicates homogeneity.
In initial test trials, PathMaster consistently provided differential lists of lymphoma diagnoses that were compatible with the submitted query image (the unknown cell). Two formal tests were performed, using a total of 50 images (not included in the image library) of both mantle cell and small cell lymphomas. When tasked to analyze these cells, PathMaster listed the correct diagnosis as its first differential in 94 percent of trials. In the remaining 6 percent of trials, PathMaster listed the correct diagnosis within the top three differentials. The results of these tests are shown in Tables ▶ and ▶.
Table 2.
Mantle Cell Lymphoma Index (N = 20)
|
Differential (%)
|
|||
|---|---|---|---|
| Lymphoma Type | First | Second | Third |
| Small lymphocytic | 05.0 | 80.0 | 15.0 |
| Follicular | 00.0 | 10.0 | 50.0 |
| Mantle cell | 95.0 | 00.0 | 05.0 |
| Diffuse large cell | 00.0 | 00.0 | 00.0 |
| Lymphoblastic | 00.0 | 10.0 | 00.0 |
| Small noncleaved | 00.0 | 00.0 | 30.0 |
|
Normal/reactive
|
00.0
|
00.0
|
00.0
|
| Note: Twenty mantle cell lymphoma images were submitted for analysis and cross-referenced against features contained in the PathMaster image library. Each of the 29 distinct diagnostic categories recorded in the image library were redesignated as one of the six lymphoma types listed in the table. Using these six categories, 19 of the 20 cell images were matched best to mantle cell lymphoma. The remaining image was best matched to small cleaved cell lymphoma. | |||
Table 3.
Small Lymphocytic Lymphoma Index (N = 30)
|
Differential (%)
|
|||
|---|---|---|---|
| Lymphoma Type | First | Second | Third |
| Small lymphocytic | 93.3 | 06.6 | 00.0 |
| Follicular | 03.3 | 10.0 | 30.0 |
| Mantle cell | 03.3 | 83.3 | 13.4 |
| Diffuse large cell | 00.0 | 00.0 | 00.0 |
| Lymphoblastic | 00.0 | 00.0 | 00.0 |
| Small noncleaved | 00.0 | 00.0 | 56.6 |
|
Normal/reactive
|
00.0
|
00.0
|
00.0
|
| Note: Thirty small lymphocytic lymphoma cell images were submitted for analysis and cross-referenced against features contained in the PathMaster image library. Twenty-eight of the 30 cell images were matched best to small lymphocytic lymphoma. The remaining images were best matched to follicular small cleaved cell lymphoma and mantle cell lymphoma. | |||
Discussion
PathMaster was created as a cytology-specific utility to index and search databases containing images of individual cells. Although this paper discusses the program's performance in the context of lymphoma touch preparations, PathMaster has been specifically designed to index and cross-reference images of various cell types, including lymphoma cells, thyroid cells from FNAs, and other cell types encountered in cytology.
Selecting Appropriate Descriptors
The selection of a fixed weight profile that optimally discriminates between various lymphomas can ultimately compromise the fidelity of a specific image match. In some instances a feature that adequately discriminates between two cell populations, designated A and B, will be of no value in resolving two different populations, designated C and D. One solution which circumvents this problem uses “cell cluster-dependent” weight profiles. Such weight profiles are not constant but rather are functions of a specific subpopulation of cells that are being compared with an unknown cell. These weight profiles reflect the importance of each individual feature in a specific population of cells. However, in our initial assessment of the PathMaster program, a fixed lymphoma-specific weight profile was used.
Markov descriptors were computed from a GLCM. The discriminating value of each Markov descriptor varied as a function of r, the radius with which the GLCM was compiled (▶). The importance of each descriptor as an index was dependent on the resolution at which it was assessed.
Figure 10.
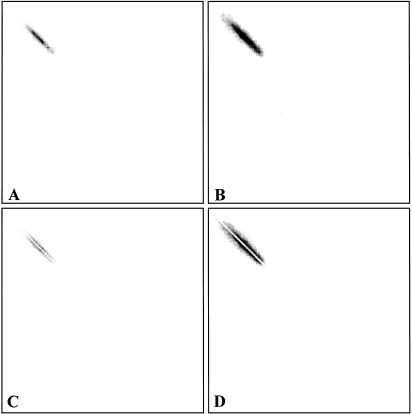
A, The gray-level co-occurrence matrix (GLCM) calculated from the red channel intensity matrix, using an r value of 1. B, The same GLCM with its probability values plotted on a logarithmic scale. C and D, A filter is applied to zero values of GLCM elements whose coordinates satisfy the equation y = x, y = x - 1, and y = x + 1.
In general, the differences between Markov textural features becomes less significant as r increases. However, each texture feature can present as an exception to this trend. As a consequence, textures are analyzed at multiple resolutions (multiple r values). Each Markov feature assessed at any given r is assigned an independent weight for scoring. In this way, only features that are known to be significant may influence a search.
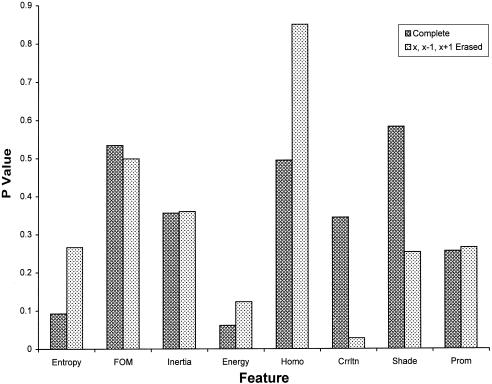
When compiling with r values less than or equal to 2, more than 35 percent of the GLCM volume lies in diagonal matrix elements A(i, i), A(i, i + 1), and A(i, i - 1), where A is the GLCM matrix. We sought to improve the discriminating power of a subset of the Markov descriptors by eliminating a significant portion of the GLCM data that were common to both textures. To achieve this objective, the elements of the GLCM having coordinates that satisfy the equations y = x, y = x + 1, and y = x - 1 were “zeroed.” The “modified” Markov descriptors were then recalculated (▶). The discriminating powers of both the “standard” and modified Markov descriptors are shown in the figure. Using this GLCM zeroing filter, significant improvements in discriminating power are obtained for both correlation and shade. Although these modified descriptors were not included in the weight profiles of this study, we intend to incorporate them in the next version of PathMaster. We are developing a series of GLCM filters and examining existing filters that may afford a significant improvement in the discriminating power of several textural descriptors.
Figure 11.
The P values of a subset of “modified” Markov descriptors differ from those of “standard” Markov descriptors. The statistical significance of several textural descriptors are improved by employing a GLCM filter. FOM indicates first order moment; Homo, homogeneity; Crrltn, correlation; Prom, prominence.
PathMaster is envisioned as a utility with multi-functionality that can assist the pathologist in difficult cases by generating a prioritized list of differentials. This list may include differentials already considered by the pathologist as well as those which he or she may not have considered originally but, in retrospect, may be willing to entertain. PathMaster accomplishes its assessment by comparing features that are both visually apparent and visually inapparent to the pathologist. This ability to analyze features outside the pathologist's visual perception may be useful. Such features may function as the basis for classification methods that can augment those assigned by pathologists.4
Future Plans
This section discusses several areas in which we plan to explore the further development of PathMaster.
Extending PathMaster to Other Domains
Although initially restricted to lymphomas, PathMaster and its image library will be upgraded to assist in the analysis and diagnosis of cytopathologies in other domains. These are likely to include thyroid aspirates, urine samples (bladder cancer), bronchoalveolar lavage fluid or sputum (bronchogenic carcinomas), and peripheral blood smears (leukemias).
Analysis of Case Clusters
Although currently designed to evaluate and search for individual cells, PathMaster can be modified to assess and analyze cell clusters. In this mode of operation, PathMaster is given a sample of cells from a single patient case, which are referred to collectively as a cell cluster. This cluster may be scored against other cell clusters that have already been catalogued in the cell pattern matrix. Cluster analysis may provide insightful information regarding diagnosis or patient outcome. This method, including information on how to measure cluster distances as well as several of its associated protocols, is currently being defined.
Extending the Number of Useful Descriptors
The most recent version of PathMaster now extracts more than 2,000 descriptors from each cell image. The majority of these are derived from an extensive multi-resolution analysis of chromatin texture. This plethora of descriptors is generated by progressively increasing the value of r, the radius with which the GLCM is compiled, and subsequently calculating the corresponding Markov textural features.
The discriminating power of several “modified” Markov descriptors is being explored. Some of these modified descriptors demonstrate significant improvements in discriminating power over their standard counterparts. A complication encountered with the use of such a large number of descriptors is that weight profiles that yield significant results in one search may yield unacceptable results in others. One solution to this problem utilizes “cell cluster-dependent” weight profiles (described earlier). These modifications are being implemented and explored in the newest version of PathMaster.
Histology Quality Control
Several alternative applications for PathMaster are also being considered. One such alternative application addresses a problem encountered in histology laboratories, that of quality control. Specific errors in processing histologic preparations may result in changes in the cellular features of a specimen, including those of texture, color, and morphology. As a result, changes in the cellular features of a quality control specimen, such as a block of hepatic tissue, could, if properly quantified, be a potential indicator of processing error. Such changes may occur suddenly and become immediately apparent, or they may occur over time and be more subtle. Trends in feature change may be used to predict the impending failure of a step in tissue processing before it becomes significant.
PathMaster may be employed to monitor the staining features of control cells, and thereby act as a quality control system providing quantitative measurements of change. Daily quantitative measurements would permit histology laboratories to establish acceptable limits of tolerance. Measurements beyond these limits could be used to prompt further investigation by the histology technologist. A similar method has already been used to identify hardware failures that result in a degradation of digital image quality.4
It should be noted that our methodologies are based on the extraction of a “large” number (300) of cell features. Although this practice provides greater opportunities for exploratory data analysis, it also increases the probability of obtaining significant results by chance alone. It is essential to understand that only a limited number of descriptors can be included in the formula of a classifier (i.e., a discriminator between populations). For assessment of discriminator effectiveness, it has been suggested that at least five independent samples are required for each feature included in the formula classifier.13 In multiple published studies that discuss cell image analysis, the ratio of the number of samples to the number of features is less than five. Although the majority of such studies reported optimistic discriminatory ability between two populations of cell types, the possibility of misleading results remains significant.17 Thus, the results presented in this paper must be considered preliminary only.
This work was supported in part by NIH grants T15-LM07756 and G08-LM05583 from the National Library of Medicine.
References
- 1.O'Brien MJ. Sotnikov AV. Digital imaging in anatomic pathology [review]. Am J Clin Pathol. 1996;106(4 suppl 1): S25-32. [PubMed] [Google Scholar]
- 2.Tagare HD, Jaffe CC, Duncan J. Medical image databases: a content-based retrieval approach. J Am Med Inform Assoc. 1997;4: 184-98. [DOI] [PMC free article] [PubMed] [Google Scholar]
- 3.Niblack W. Query by image and video content: the QBIC system. IEEE Comput. 1995;28(9): 23-32. [Google Scholar]
- 4.Wetzel AW, Andrews PL, Becich MJ, Gilbertson J. Computational aspects of pathology image classification and retrieval. J Supercomput. 1997;11: 279-93. [Google Scholar]
- 5.Pentland A, Picard RW, Sclaroff S. Photobook: content-based manipulation of image databases. Int J Comput Vision. 1996;18(3): 233-54. [Google Scholar]
- 6.Mango LJ. Clinical validation of interactive cytologic screening: automating the search, not the interpretation. Acta Cytol. 1997;41(1): 93-7. [DOI] [PubMed] [Google Scholar]
- 7.Schneider A, Zahm DM. New adjunctive methods for cervical cancer screening. Obstet Gynecol Clin North Am. 1996; 23(3): 657-73. [PubMed] [Google Scholar]
- 8.Haroske G, Dimmer V, Friedrich K, et al. Nuclear image analysis of immunohistochemically stained cells in breat carcinomas. Histochem Cell Biol. 1996;105(6): 479-85. [DOI] [PubMed] [Google Scholar]
- 9.Jorgensen T, Yogesan K, Tveter KJ, Skjorten F, Danielsen HE. Nuclear texture analysis: a new prognostic tool in metastatic prostate cancer. Cytometry. 1996;24(3): 277-83. [DOI] [PubMed] [Google Scholar]
- 10.Gamel JW, McCurdy JB, McLean IW. A comparison of prognostic covariates for uveal melanoma. Invest Ophthalmol Vis Sci. 1992;33(6): 1919-22. [PubMed] [Google Scholar]
- 11.Huhn KM, Palcic B, Wilson JE, McManus BM. Cytometric analysis of ventricular myocyte nuclei in idiopathic dilated cardiomyopathy: a tool for evaluation of disease progression? Eur Heart J. 1995;16(suppl 0): 97-9. [DOI] [PubMed] [Google Scholar]
- 12.Fleming MG, Rauber TW. Multiparametric image cytometry in mycosis fungoides. J Invest Dermatol. 1996;106(1): 129-34. [DOI] [PubMed] [Google Scholar]
- 13.Gschwendtner A, Hoffmann-Weltin Y, Mikuz G, Mairinger T. Quantitative assessment of bladder cancer by nuclear texture analysis using automated high resolution image cytometry. Mod Pathol. 1999;12(8): 806-13. [PubMed] [Google Scholar]
- 14.Doudkine A, Macaulay C, Poulin N, Palcic B. Nuclear texture measurements in image cytometry. Pathologica. 1995;87(3): 286-99. [PubMed] [Google Scholar]
- 15.Simon I, Pound CR, Partin AW, Clemens JQ, Christens-Barry WA. Automated image analysis system for detecting boundaries of live prostate cancer cells. Cytometry. 1998;31(4): 287-94. [DOI] [PubMed] [Google Scholar]
- 16.Parker JR. Algorithms for Image Processing and Computer Vision. New York: John Wiley, 1997. ISBN 0-471-14056-2.
- 17.James NT. Common statistical errors in morphometry. Pathol Res Pract. 1989;185(5): 764-8. [DOI] [PubMed] [Google Scholar]


