

Abstract
Objective
Preceding oxygen glucose deprivation (OGD) and ongoing seizures have both been reported to increase neuronal chloride concentration ([Cl−]i), which may contribute to anticonvulsant failure by reversing the direction of chloride currents at inhibitory GABAA synapses.
Methods
The effects of OGD on [Cl−]i, seizure activity, and anticonvulsant efficacy were studied in a chronically epileptic in vitro preparation.
Results
Seizures initially increased during OGD, followed by suppression. On reperfusion, seizure frequency and [Cl−]i progressively increased, and phenobarbital efficacy was reduced. Bumetanide (10 μmol/L) and furosemide (1 mmol/L) prevented or reduced the OGD induced [Cl−]i increase. Phenobarbital efficacy was enhanced by bumetanide (10 μmol/L). Furosemide (1 mmol/L) suppressed recurrent seizures.
Interpretation
[Cl−]i increases after OGD and is associated with worsened seizure activity, reduced efficacy of GABAergic anticonvulsants, and amelioration by antagonists of secondary chloride transport.
Introduction
Electrographic seizure activity is a prominent element of the neuronal dysfunction caused by hypoxic ischemic brain injury.1, 2 Seizures in the setting of global hypoxic ischemic brain injury are associated with a poorer prognosis for recovery, raising the possibility that the seizures contribute to brain injury.3, 4
Status epilepticus (SE) is considered to be a medical emergency because of the possibility of ictal brain injury.5 Seizures increase the cerebral metabolic rate, that is, the demand for oxygen and glucose.6 Ictal brain injury occurs much more rapidly in the setting of systemic hypotension, hypoxia, and hypoglycemia.7 Following SE, neuropathological changes that are characteristic of hypoxic ischemic injury are observed in the hippocampus and cortex.8, 9 These findings suggest that insufficient oxygen and glucose delivery contribute to ictal brain injury.10 However, the mechanisms by which oxygen glucose deprivation (OGD) and seizure activity interact to produce brain injury remain poorly understood.11
Seizures following hypoxic ischemic brain injury respond poorly to anticonvulsants.12, 13 Similarly, at SE durations associated with brain injury,8 seizure response to anticonvulsants is also reduced.14 One mechanism for reduced anticonvulsant efficacy is endocytosis of inhibitory GABAA receptors.15 We recently proposed a second mechanism.16 Both SE and HIE are characterized by cytotoxic edema manifest on MRI by reduced diffusion.17 Cytotoxic edema results from the entry of salt and water into the cytoplasm.18, 19 The chloride moiety of the cytoplasmic salt will increase the neuronal chloride concentration,20 creating a positive shift in the reversal potential for GABAAreceptor chloride currents. This positive shift in reversal potential will create more depolarizing responses to GABA, which may result in excitation rather than inhibition of the neuron. Because most anticonvulsants used in the setting of SE and HIE increase the open time of the GABAA receptor,21, 22, 23 chloride accumulation in neurons could substantially degrade the response to anticonvulsants. Restricting salt entry into neurons using diuretics improves the response to anticonvulsants in some experimental conditions. This has been explored in the setting of chemo‐convulsant‐induced seizures24 or hypoxia‐induced seizures,25 but not in the setting of status epilepticus and HIE.
Here we test the effects of OGD on recurrent seizure activity and neuronal chloride concentration in a spontaneously epileptic in vitro preparation, the organotypic hippocampal slice culture preparation.26, 27 This in vitro preparation permits the study of OGD that is more severe than can be survived by in vivo experimental preparations subject to global hypoxia and ischemia.28 Reperfusion is also more feasible in vitro than in vivo.29 We report the effects of 30 min of OGD on seizure activity and [Cl−]i during OGD and after reperfusion and the response to anticonvulsants and diuretics.
Methods
All animal‐use protocols were in accordance with the guidelines of the National Institute of Health and the Massachusetts General Hospital Center for Comparative Medicine on the use of laboratory animals, and approved by the Subcommittee on Research and Animal Care (SRAC).
Culture of organotypic hippocampal slices and experimental conditions
Transverse 350 μm hippocampal slices were prepared from C57BL/6 and CLM1 (Duke University Medical Center, Durham, NC, USA) mice at postnatal (P) day 6–7 as previously described.26, 27 Acute slices were mounted on poly‐l‐Lysine coated glass coverslips (Electron Microscopy Sciences, Hatfield, PA). Slices were incubated in 1000 μL of NeuroBasal/B27(1X) medium (Gibco by Life Technologies, Grant Island, NY) supplemented with 0.5 mmol/L GlutaMAX and 30 μg/mL gentamicin (all from Invitrogen) in 6‐well plates with low evaporation lid (Becton Dickinson Labware, Franklin Lakes, NJ), in a humidified 37°C atmosphere that contained 5% CO2, placed on a rocking platform (<1 cycle/min). Culture medium was changed biweekly. For acute recordings and imaging, slices were transferred to a submerged chamber and continuously superfused in oxygenated (95% O2 and 5% CO2) artificial cerebrospinal fluid (ACSF) containing (in mmol/L): 126 NaCl, 3.5 KCl, 2 CaCl2, 1.3 MgCl2, 25 NaHCO3, 1.2 NaHPO4, and 11 Glucose (pH 7.4) at 32 ± 0.5°C and a flow rate of 2 mL/min. Oxygen‐glucose deprivation (OGD) was induced by perfusion with anoxic ACSF saturated with 95% N2 and 5% CO2, and glucose was substituted with equimolar concentration of mannitol. All organotypic hippocampal slices were used at Day in Vitro (DIV) 10–15.
Pharmacological studies included NKCC1 specific blocker Bumetanide (10 μmol/L), a less selective cation‐chloride co‐transport inhibitor Furosemide (1 mmol/L), sodium voltage‐gated channel antagonist Tetrodotoxine (1 μmol/L), and Phenobarbital (100 μmol/L).
Electrophysiological recordings and data analysis
Extracellular field potentials were recorded in the CA3 and CA1 pyramidal cell layer of organotypic hippocampal slices using custom‐made tungsten‐coated 50 μm wire microelectrodes. The electrical signals were digitized using an analog‐to‐digital converter DigiData 1322A (Axon Instruments). pClamp and Clampfit 10.3 (Axon Instruments), Origin 7.5 (Microcal Software), and SigmaPlot 11.0 (Systat Software) programs were used for data acquisition and analysis. Recordings were sampled at 10 kHz. Interictal epileptiform discharges (IEDs) were defined as synchronous network‐driven bursts characterized by short (0.1–3 sec) duration and large amplitude population spikes. The frequency, duration, and amplitude of IEDs substantially varied between recurrent ictal‐like discharges. Ictal‐like discharges (ILDs) were defined as hyper‐synchronous, large amplitude, and high‐frequency population spikes followed by sustained ictal‐tonic and/or intermittent ictal‐clonic after discharges, with the duration of the population spikes and after‐discharge complex lasting more than 5 sec. Power spectrum analysis was performed on the electrical recordings after filtering with a Bessel high‐pass filter of 1 Hz and applying a Hamming window function. The power of the electrical activity was calculated by integrating the root mean square value of the signal amplitude in corresponding time windows and frequency range from 1 to 1000 Hz. For comparison between slices, power was normalized for each slice with the highest value in control conditions.
Two‐photon imaging of Clomeleon, quantitative and morphological analysis
Neuronal chloride concentration was determined in CA1 pyramidal neurons expressing the ratio‐metric chloride indicator Clomeleon.30 High‐resolution two‐photon excitation confocal scanning imaging of the Cl−‐sensitive yellow fluorescent protein (YFP) and the Cl−‐insensitive cyan fluorescent protein (CFP) was performed on an Olympus Fluoview 1000 MPE microscope. A mode‐locked titanium‐sapphire laser (MaiTai, Spectra Physics) with 860 nm two‐photon excitation was used to generate fluorescence. Emitted light passed through a dichroic mirror and was band‐pass filtered through 480 ± 15 nm (D480/30) for CFP and 535 ± 20 nm filter (D535/40) for YFP (FV10‐MRCYR/XR). Time series acquisition of 720 frames (256 × 256 pixels for 254.46 × 254.46 μm) with 10 sec intervals was performed to measure chloride concentration as a function of time in control conditions, during a 30 min oxygen‐glucose deprivation, and over a 70 min period of reperfusion with oxygenated control ACSF (Figs. 2 and 5) to normalize a 20–40 min reduction in the intracellular pH after OGD,20, 31, 32 that may lead to an overestimate of [Cl−]i calculated from the emission ratios of Clomeleon.30
For morphological analysis, organotypic slices were imaged through the CA1 pyramidal cell layer (Z‐axis dimension 0–100 μm, 1–2 μm step size). ImageJ 1.51 software (National Institutes of Health) was used for quantitative analysis. Region of interests (ROIs) were selected using the chloride insensitive CFP fluorescence. The ratio of the YFP/CFP fluorescence intensity was used for [Cl−]i calculation.30, 33, 34 The CFP emission of Clomeleon was used for the high‐resolution morphological analysis.33, 35
Statistical analysis
Group measures are expressed as mean ± standard deviation (SD) or median ± SD as indicated. The statistical significance of differences was assessed with the Student's t test. One‐way repeated measures analysis of variance (One‐Way RM ANOVA) was used to evaluate the differences in the mean values among the control and treatment groups. The Tukey Test was used for all pairwise comparisons of the mean responses to the different treatment groups. Friedman repeated measures analysis of variance on ranks (Friedman RM ANOVA on Ranks) was used to compare the differences in the median values among the treatment groups. Wilcoxon Signed Rank Test was used for nonparametric paired data analysis. The level of significance was set at P < 0.05.
Results
Transient OGD facilitated severity of recurrent seizures
The effects of transient 30 min oxygen‐glucose deprivation (OGD) on spontaneous epileptiform activity were studied in mouse organotypic hippocampal slice cultures in vitro at DIV10 to DIV14. Electrical activity was monitored by simultaneous extracellular field potential recordings in the pyramidal cell layer of CA1 regions.
In control conditions, spontaneous neuronal network activity in the organotypic hippocampal slice cultures (N = 6) was characterized by short interictal epileptiform discharges (IEDs) and prolonged recurrent ictal‐like epileptiform discharges (ILDs) resembling seizure activity (Fig. 1A).27, 36 Oxygen‐glucose deprivation induced an initial increase in the mean duration of ILDs from 0.62 ± 0.2 to 1.52 ± 0.41 min (mean ± SD; N = 6; P = 0.004, One‐Way RM ANOVA, Tukey Test), followed by suppression of epileptiform discharges (Fig. 1A and D). The mean frequency of ILDs in consecutive 10 min windows decreased by 65% from 3.4 ± 1.2 ILD/10 min in control to 1.2 ± 1.1 ILD/10 min during exposure to OGD (P = 0.002; N = 6; Fig. 1E). The mean power of extracellular field potential activity progressively decreased by 92% from 983.6 ± 135.1 μV2 in control to 79.2 ± 63.9 μV2 during 20–30 min of exposure to OGD (P < 0.001; Fig. 1F). During reperfusion, ictal‐like epileptiform discharges rapidly recovered in all slices (N = 6). Decreased duration was offset by increased frequency so that net power was increased (Fig. 1D–F). The mean duration of ILDs decreased by 30% from control to 0.44 ± 0.6 min (P = 0.66; Fig. 1D), and the mean frequency of ILDs significantly increased by 61% from control to 5.6 ± 2.8 ILD/10 min (P = 0.004; Fig. 1E). The mean power of corresponding extracellular field potential activity increased by 27% from control to 1193.6 ± 443.6 μV2 (P = 0.235; Fig. 1F).
Figure 1.

Transient oxygen‐glucose deprivation facilitated severity of spontaneous recurrent seizures. (A) Extracellular field potential recording in the CA1 pyramidal cell layer (proximal to CA2/CA3) in the organotypic hippocampal slice in vitro. Ictal‐like epileptiform discharges (ILDs) are marked by asterisks. Examples of the ictal‐like discharges in control, during an initial phase of OGD and after reoxygenation are shown on an expanded time scale. Transient OGD (30 min) initially increased the duration of ILDs followed by suppression of epileptiform discharges. ILDs rapidly recovered during reoxygenation and progressively increased in frequency. (B) Power spectra showing depression of electrical field potential activity induced by OGD and potentiation during reoxygenation. (C) Changes in the power of electrical activity are shown in 10 min windows in control, during OGD and after reoxygenation. (D–F) OGD‐induced changes in ILD duration (D), ILD frequency (E), and power of electrical activity (F) in 10 min windows. On recovery after OGD, ictal‐like discharges resumed with decreased duration offset by increased frequency so the net power was modestly increased (N = 6; solid circles represent mean ± SD).
Thus, transient 30 min OGD followed by reperfusion was accompanied by facilitation of spontaneous ictal‐like discharges, significantly increasing the mean ILD frequency. We determined next whether the changes in recurrent ictal‐like discharges observed after OGD correlate with changes in EGABA measured as a change in [Cl−]i.
Transient OGD facilitated neuronal chloride accumulation
Significant alterations in neuronal ionic transport in recurrent seizures,37 chronically epileptic tissue,38 and after ischemia/OGD20 raise the possibility that altered chloride homeostasis and GABA signaling significantly aggravate the both seizure activity and ischemic brain injury. We determined the effect of transient 30 min OGD on neuronal chloride concentration and morphological properties of neurons. Two‐photon imaging of genetically encoded intracellular chloride indicator Clomeleon was performed in the organotypic hippocampal slice cultures (DIV11 to DIV15) that spontaneously develop ictal‐like epileptiform discharges.
The ratio of YFP to CFP fluorescence was used to measure [Cl−]i in CA1 pyramidal cells (see Methods). YFP and CFP emission was measured every 10 sec during 120 min experiments, including 20 min control, 30 min OGD, and the subsequent 70 min of reperfusion (Fig. 2A and B). We compared the rate of [Cl−]i changes during OGD and on recovery after OGD (Fig. 2B and 5G and H). YFP emission and regions of interest (cell bodies) in the CA1 pyramidal cells, pseudo‐colored according to [Cl−]i, are shown in Figure 2A. Under control conditions, the baseline [Cl−]i was 8.8 ± 5.1 mmol/L (median ± SD; n = 37 cells in N = 6 slices). [Cl−]i transiently increased during spontaneous ILDs and then recovered to base‐line value in all cells (Fig. 2B).39 OGD progressively reduced the baseline [Cl−]i value to 8 ± 4.8 mmol/L (P > 0.05; Friedman RM ANOVA on Ranks, Tukey Test) and suppressed spontaneous ILDs and corresponding [Cl−]i transients (Fig. 2C, 5G). During reperfusion, the baseline [Cl−]i progressively increased, spontaneous ILDs and corresponding chloride transients rapidly recovered and the baseline [Cl−]i remained elevated. One hour after reoxygenation the median baseline [Cl−]i significantly increased by 27% from control to 11.2 ± 8.5 mmol/L (P < 0.05; Friedman RM ANOVA on Ranks, Tukey Test). OGD‐induced baseline [Cl−]i accumulation was not significantly different between the superficial (0–50 μm) and deep (50–100 μm) layers (Fig. 2D and E; N = 3 slices, 283 cell; P = 0.277, Kruskal–Wallis One‐Way ANOVA on Ranks). Cell comparison in control and 1 h on recovery after transient OGD did not reveal abnormalities in the morphology of cells (Fig. 2F) and differences in cell count (Fig. 2G).
Figure 2.

Transient OGD facilitated neuronal chloride accumulation. (A) Two‐photon microscopy image of YFP (left) of CA1 pyramidal cells in the organotypic hippocampal slice culture in vitro (DIV12). Pseudo‐colored regions of interest (ROIs) from 10 neurons according to baseline [Cl−]i (bin 2 mmol/L) are shown in control, 20 min after OGD onset, and 1 h on recovery after OGD. (B) Corresponding changes in [Cl−]i are plotted as a function of time. Solid line corresponds to the mean [Cl−]i. OGD abolished seizures and seizure‐induced chloride transients (marked by asterisks) followed by progressive increase in a baseline [Cl−]i. On recovery after OGD, the mean baseline [Cl−]i remained elevated. (C) Histogram of the mean [Cl−]i changes 15 min after onset of OGD versus control (36 cells in 6 slices; bin size ‐ 2 mmol/L) and 1 h after recovery from OGD versus control. Data were fitted with a multi‐peaks Gaussian function. (D, E) Overlays of 0–100 μm planes of two‐photon fluorescence images of Clomeleon between seizures in control (left) and 1 h on recovery after OGD (right). Neurons pseudo‐colored according to resting [Cl−]i. Intracellular chloride distribution as a function of depth (N = 3 slices, 283 cell). Solid lines represent a linear function fit to control (black line) and 1 h on recovery after OGD (red line). (F, G) Two‐photon microscopy Z‐stack (Z = 0–100 μm) images of Clomeleon cyan fluorescent protein (CFP) in control and 1 h after recovery from OGD. Red circles correspond to counted cells. Cell morphology and cell count in control and 1 h on recovery after transient OGD. Exposure to 30 min of OGD followed by 1 h reoxygenation did not produce abnormalities in the morphology of cells (F) and did not cause cell loss (G).
Thus, reperfusion after transient OGD is associated with a persistent [Cl−]i elevation, which leads to a corresponding depolarizing shift of chloride‐permeable GABAA receptor‐mediated postsynaptic responses (EGABA). Depolarizing GABA responses in large populations of neurons facilitate neuronal network activity, increase the probability (frequency) of recurrent ictal‐like discharges and limit anticonvulsant efficacy of GABAergic anticonvulsant.40, 41
Transient OGD reduced anticonvulsant efficacy of phenobarbital
We compared the effect of phenobarbital on spontaneous ictal‐like discharges in control conditions and 1 h on recovery after OGD (Fig. 3). Extracellular field potential recordings were performed in the CA1 pyramidal cell layer in DIV11 to DIV15 organotypic hippocampal slice cultures.
Figure 3.

OGD reduced the anticonvulsant efficacy of phenobarbital. (A, B) Extracellular field potential recordings in the CA1 pyramidal cell layer in the organotypic hippocampal slices in vitro. Examples of the ictal‐like epileptiform discharges are shown on an expanded time scale. (A) In control, phenobarbital (100 μmol/L) was applied for 60 min after 2 h of control recordings. Power spectra in 1 h windows showing a modest depression of electrical activity during phenobarbital application. (B) Phenobarbital (100 μmol/L) was applied for 1 h after recovery from OGD. Power spectra of electrical activity in 1 h windows before, during, and after Phenobarbital application showing reduced anticonvulsant efficacy of Phenobarbital. (C, D) Summary data of the frequency of ILDs (C) and power of electrical activity (D) before, during, and after phenobarbital application in control and 1–1.5 h on recovery after OGD. In control, phenobarbital significantly reduced seizure frequency and power of electrical activity. On recovery from OGD, the effect of phenobarbital on ILD frequency was not significant. (C, D) N = 6 slices for each group; box range corresponds to 25–75 percentiles, whisker range – SD, median line and solid square – mean; *represents P < 0.05; **P < 0.01; ***P < 0.001; One‐Way RM ANOVA, Tukey Test).
In the first group of experiments, we determined the effect of phenobarbital on spontaneous ILDs in control conditions (Fig. 3A, C, and D). Extracellular field potential recordings revealed spontaneous interictal and ictal‐like epileptiform discharges (N = 6 of 6 slices). Bath application of phenobarbital (100 μmol/L) for 1 h significantly reduced the mean frequency of ILDs by 51% from 13.7 ± 5.8 to 7.2 ± 5 ILD/h (P < 0.001; N = 6; One‐Way RM ANOVA, Tukey Test) and the mean power of extracellular field potential activity by 53% from 965 ± 337.5 μV2 in control to 435 ± 146.7 μV2 (P < 0.001). The mean frequency of spontaneous ILDs partially recovered during washing out of phenobarbital to 11.3 ± 3.6 ILD/h (P = 0.169; Fig. 3C). The mean power of electrical activity remained depressed 1 h after washing out of phenobarbital (603.5 ± 243 μV2; P = 0.007; Fig. 3D). These effects reveal a significant anticonvulsant effect of phenobarbital in chronic ictal‐like discharges.42
In a second group of experiments, we determined the effect of transient 30 min OGD on anticonvulsive efficacy of phenobarbital (Fig. 3B–D). One hour after recovery from OGD, bath application of phenobarbital (100 μmol/L) for 1 h reduced the mean frequency of ILDs by 26% from 18 ± 11.4 to 13.3 ± 9.4 ILD/h (N = 7; P = 0.054) and the mean power of corresponding electrical activity in the CA1 pyramidal cell layer by 32% from 1162.2 ± 482.3 μV2 to 785.4 ± 227.5 μV2 (P = 0.01). The mean frequency of ILDs recovered during washing out of phenobarbital to 17.1 ± 7.8 ILD/h (P > 0.05; Fig. 3C). The mean power of electrical activity recovered to 1062.7 ± 413.3 μV2 (P = 0.67; Fig. 3D) after washing out of phenobarbital. Thus, transient OGD induced neuronal chloride elevation and depolarizing shift in EGABA (Fig. 2), associated with a reduction in the anticonvulsant efficacy of a GABAergic anticonvulsant phenobarbital.
Cation‐chloride cotransporters contribute to OGD induced facilitation of recurrent seizures
We next determined the contribution of cation‐chloride co‐transporters to OGD‐induced neuronal chloride elevation and facilitation of recurrent ictal‐like discharges. First, we determined the efficacy of the Na+–K+–2 Cl− (NKCC1) blocker bumetanide to prevent transient OGD induced facilitation of spontaneous ictal‐like discharges in the organotypic hippocampal slice cultures in vitro (Figs. 1 and 4). Bumetanide (10 μmol/L) was bath applied for 30 min during OGD and then for one more hour during reperfusion. Similar to control conditions (Fig. 4C and D), OGD during bumetanide application resulted in progressively decreased mean frequency of ILDs and power of extracellular field potential activity (Fig. 4A, C, and D). The mean frequency of ILDs during exposure to OGD in the presence of bumetanide decreased by 54% from 14.5 ± 2.3 ILD/30 min to 6.8 ± 3.5 ILD/30 min (P < 0.001; N = 6; One‐Way RM ANOVA, Tukey Test; Fig. 4E) and the mean power of extracellular field potential activity decreased by 46% from 961.8 ± 280.3 μV2 to 527.3 ± 219.8 μV2 (P = 0.001; Fig. 4F). In contrast to control conditions, reperfusion in the presence of bumetanide prevented facilitation of recurrent seizures (Fig. 4C and D). On 30–60 min recovery from OGD, the mean frequency of recurrent ILDs significantly decreased by 62% from control to 5.5 ± 2.8 ILD/30 min (P < 0.001; Fig. 4E), and the mean power of the corresponding electrical activity remained significantly decreased by 36% from control to 618 ± 493.8 μV2 (P = 0.01; Fig. 4F).
Figure 4.
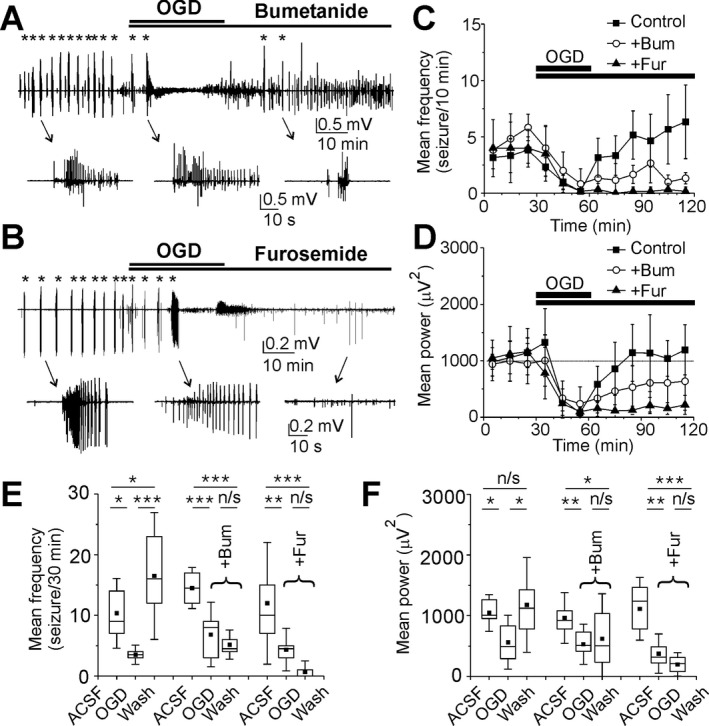
Effects of bumetanide and furosemide on recurrent ILDs during recovery from OGD. (A, B) Extracellular field potential recordings in the CA1 pyramidal cell layer before OGD, during OGD, and on recovery from OGD in the presence of Bumetanide (10 μmol/L) and Furosemide (1 mmol/L) in the organotypic hippocampal slices in vitro. Examples of the ictal‐like discharges (marked by asterisks) are shown on an expanded time scale. (C, D) The mean frequency of ILDs and power of electrical activity in 10 min windows in control, during OGD and on recovery from OGD in the presence of bumetanide (red bars and circles) and furosemide (blue bars and circles). Bumetanide reduced the frequency of ILDs and power of electrical activity during recovery from OGD. Furosemide suppressed ILDs and strongly reduced the power of electrical activity. (E, F) Statistical histograms showing effects of transient OGD on the frequency of ILDs (E) and power of electrical activity (F) in control, in the presence of bumetanide and furosemide. Bumetanide reduced the severity of seizures on recovery from OGD and furosemide abolished seizures. (E, F) N = 6 slices for each group; box range corresponds to 25–75 percentiles and whisker range – SD; *represents P < 0.05; **P < 0.01; ***P < 0.001; One‐Way RM ANOVA, Tukey Test).
In a second group of experiments, we determined the efficacy of furosemide to prevent OGD induced facilitation of recurrent ictal‐like discharges in the organotypic hippocampal slice cultures in vitro (Fig. 4B and D). Furosemide was applied at a concentration 1 mmol/L that blocks both NKCC1 and KCC2. Furosemide applied during OGD had no effect on extracellular field potential activity compared to control OGD (Fig. 4B–D). The mean frequency of ILDs during exposure to OGD in the presence of furosemide decreased by 64% from 12 ± 6.7 ILD/30 min to 4.3 ± 2.3 ILD/30 min (P = 0.009; N = 6; One‐Way RM ANOVA, Tukey Test; Fig. 4E) and the mean power of extracellular field potential activity decreased by 66% from 1110.9 ± 343.7 μV2 to 373.9 ± 216.17 μV2 (P < 0.001; Fig. 4F). On recovery after OGD, furosemide significantly reduced the mean frequency of ILDs by 94% from control to 0.67 ± 1.2 ILD/30 min (P < 0.001) and suppressed ILDs in 4 of 6 slices. The mean power of the corresponding electrical activity in a 30–60 min windows during reoxygenation decreased by 83% from control to 194.4 ± 128.2 μV2 (P < 0.001).
Thus, inhibition of secondary cation‐chloride cotransporters, including both NKCC1 and KCC2, has little effect during OGD. However, cotransporters contribute to facilitation of recurrent seizure activity during reperfusion following OGD.
Cation‐chloride cotransporters contribute to OGD induced neuronal chloride accumulation
Both bumetanide and furosemide prevented the facilitation of recurrent ictal‐like discharges that followed OGD. We next determined whether the anticonvulsant effects of bumetanide and furosemide correlated with the rate of changes in [Cl−]i (Fig. 5). We compared the rate of [Cl−]i changes during OGD and on recovery after OGD in the presence of bumetanide (10 μmol/L) and furosemide (1 mmol/L).
Figure 5.

Bumetanide and furosemide prevented OGD induced neuronal chloride accumulation. (A, C, E) Two‐photon fluorescent images represent merged YFP (green) and CFP (red) emission of the CA1 pyramidal cells in the organotypic hippocampal slices in vitro. Corresponding [Cl−]i changes in individual cells (N = 6 cells in each slice) plotted as a function of time before, during, and 1 h on recovery after OGD in the presence of bumetanide (10 μmol/L), furosemide (1 mmol/L), and TTX (1 μmol/L). (B, D, F) Corresponding histograms showing the difference between baseline [Cl−]i 1 h after recovery from OGD and control in three groups of experiments (each group – 36 cells in 6 slices). Data were fitted with a multi‐peaks Gaussian function. (G) Statistical histograms showing effects of OGD on [Cl−]i in control and in the presence of bumetanide (10 μmol/L), furosemide (1 mmol/L) and TTX (1 μmol/L). *represents P < 0.05; **P < 0.01; ***P < 0.001; One‐Way RM ANOVA, Tukey Test. (H) Statistical histograms showing [Cl−]i changes 15 min after OGD onset (left) and 1 h on recovery after OGD (right) in control and in the presence of bumetanide, furosemide, and TTX. (I) Corresponding changes in the power of electrical activity recorded during electrophysiological experiments. (H, I) N/S corresponds to not a statistically significant difference in the median values among the treatment groups (P > 0.05); *represents P < 0.05 (Kruskal–Wallis One‐Way ANOVA on Ranks; Dunn's method).
In control conditions, initial [Cl−]i varied between individual cells from 2.6 to 21 mmol/L (9.9 ± 4.5 mmol/L; median ± SD; n = 144 cells in N = 24 slices), and [Cl−]i in all groups of experiment (N = 6 slices in each group) was not significantly different (Fig. 5G; P > 0.05; Kruskal–Wallis One‐Way ANOVA on Ranks, Dunn's Method). In the presence of bumetanide (10 μmol/L), OGD had no significant effect on neuronal baseline chloride, and 15 min after OGD onset the median [Cl−]i changed from 8 ± 3.7 mmol/L in control to 8.1 ± 4.1 mmol/L (median ± SD; n = 36 cells in N = 6 slices; P > 0.05, Friedman RM ANOVA on Ranks, Tukey Test; Fig. 5A, G, and H). On 1 h recovery from OGD, in the presence of bumetanide, the baseline [Cl−]i significantly decreased by 25% to 6 ± 3.2 mmol/L from control value (P < 0.05) and the difference was 2.1 ± 2.8 mmol/L (median ± SD; Fig. 5A, B, G, and H).
In the presence of furosemide (1 mmol/L), OGD decreased the baseline [Cl−]i from 12.6 ± 4.2 mmol/L in control to 12.2 ± 4.7 mmol/L (n = 36 cells in N = 6 slices; P > 0.05; Friedman RM ANOVA on Ranks, Tukey Test; Fig. 5C, G, and H). On 1 h recovery from OGD, in the presence of furosemide, the median baseline [Cl−]i significantly decreased by 36% to 8.1 ± 3.1 mmol/L from control value (P < 0.05), and the difference was 4.4 ± 3.6 mmol/L (Fig. 5C, D, G, and H). The rate of bumetanide and furosemide induced [Cl−]i reduction on recovery after OGD correlates with the rate of reduction in seizure frequency and suppression of electrical activity (Fig. 5G–I).
We also determined the role of recurrent ictal‐like discharges in neuronal chloride accumulation during OGD and 60 min after recovery from OGD (Fig. 5E–H). Recurrent ictal‐like discharges during and after recovery from OGD were suppressed by bath application of the Na+ channel blocker TTX (1 μmol/L). The median baseline [Cl−]i in the presence of TTX initially decreased from 10.2 ± 4.9 mmol/L in control to 8.1 ± 5.2 mmol/L during OGD (n = 36 cells in N = 6 slices; P < 0.05, Friedman RM ANOVA on Ranks, Tukey Test), suggesting that activity‐dependent depolarizations during recurrent seizures significantly contribute to steady‐state chloride accumulation. Baseline [Cl−]i subsequently increased (21 of 36 neurons) or decreased (15 of 36 neurons) in subpopulations of neurons during reperfusion. On 1 h recovery from OGD, in the presence of TTX, the median baseline [Cl−]i increased from control to 11.8 ± 5.3 mmol/L (P > 0.05). The effect of TTX on neuronal chloride changes 60 min after recovery from OGD was not significant (Fig. 5G and H), suggesting that neuronal chloride transporters strongly contribute to OGD induced neuronal chloride accumulation and facilitation of recurrent ictal‐like discharges.
Bumetanide enhanced anticonvulsive efficacy of Phenobarbital after OGD
Transient OGD induced neuronal chloride elevation associated with facilitation of recurrent seizures and reduction in the anticonvulsant efficacy of phenobarbital (Figs. 1, 2, 3). Bumetanide significantly reduced the rate of OGD‐induced [Cl−]i elevation (Fig. 5G and H). We determined the effect of NKCC1 blocker bumetanide in combination with phenobarbital on anticonvulsant resistant seizures after OGD (Fig. 6).
Figure 6.

Bumetanide improves efficacy of phenobarbital after OGD. (A) Extracellular field potential recording in the CA1 pyramidal cell layer in the organotypic hippocampal slices in vitro. Phenobarbital (100 μmol/L) in combination with bumetanide was applied for 1 h after recovery from OGD. Examples of the ictal‐like discharges are shown on an expanded time scale. Power spectra correspond to 1 h windows after recovery from OGD, before, during, and after Phenobarbital and bumetanide application. (B) Summary data of the frequency of ILDs and power of electrical activity before, during, and after phenobarbital in combination with bumetanide application 1–1.5 h on recovery after OGD. Phenobarbital in combination with bumetanide significantly reduced the frequency of ILDs and power of electrical activity (N = 6; *represents P < 0.05; **P < 0.01; ***P < 0.001; One‐Way RM ANOVA, Tukey Test). (C) Summary data of the phenobarbital effects on ILD frequency and power of electrical activity in control, 1 h after recovery from OGD alone and in combination with bumetanide. Bumetanide improves anticonvulsant effect of phenobarbital during recovery from OGD. *represents P < 0.05 (Kruskal–Wallis One‐Way ANOVA on Ranks; Dunn's method).
One hour after recovery from OGD, bath application of phenobarbital (100 μmol/L) in combination with bumetanide (10 μmol/L) for 1 h significantly reduced the mean frequency of ILDs by 80% from 14.2 ± 6.1 to 3 ± 2.3 ILD/h (N = 6; P = 0.006; One‐Way RM ANOVA, Tukey Test; Fig. 6A–C) and the mean power of extracellular field potential activity by 54% from 1023.2 ± 267.1 μV2 in control to 472 ± 213.4 μV2 (P = 0.002). The mean frequency of ILD and power of corresponding electrical activity recovered after washing out of drugs (Fig. 6A and B). The mean anticonvulsant effect of phenobarbital in combination with bumetanide during recovery from OGD was significantly higher than corresponding effect of phenobarbital alone (N = 6; P < 0.05; Kruskal–Wallis One‐Way ANOVA, Holm–Sidak all pairwise multiple comparison; Fig. 6C). Thus, bumetanide improved anticonvulsive efficacy of phenobarbital during recovery from OGD.
Discussion
This study measured the effects of 30 min OGD and subsequent reperfusion on neuronal [Cl−]i and recurrent ictal‐like discharges in organotypic hippocampal slice cultures (DIV10–14), an in vitro model of posttraumatic seizures. We demonstrated that during reperfusion after OGD, worsening of seizure activity was associated with increased [Cl−]i (Fig. 1 and 2). These effects could be inhibited during reperfusion, but not during OGD, by antagonists of neuronal cation chloride cotransporters.
Effects of transient OGD on neuronal network activity and intracellular chloride
Increased [Cl−]i during reperfusion after OGD has been demonstrated in quiescent brain tissue in vitro.20 In this study, the preparation was chronically epileptic and seizure activity was evident prior to OGD. In the presence of spontaneous seizure activity, increases in [Cl−]i began during OGD and continued during reperfusion. However, seizure activity was not necessary for increases in [Cl−]i, either during OGD (when activity became suppressed), or during reperfusion, when suppression of ictal activity with TTX did not affect the increase in baseline [Cl−]i (Fig. 2 and 5). These effects suggest that seizure activity and OGD additively increase neuronal [Cl−]i during reperfusion.
Relationship between CCCs activity, GABAergic inhibition, and neuronal excitability
Seizure activity was enhanced during reperfusion after OGD. This effect was coincident with increases in baseline [Cl−]i and the frequency of ictal [Cl−]i transients. [Cl−]i is affected by seizure activity37, 39, 43 and seizure activity is affected by [Cl−]i. 41, 43, 44 Blockade of seizures with TTX prevented the increase in [Cl−]i during reperfusion, whereas diuretics that antagonize neuronal cation‐chloride cotransporters reduced both [Cl−]i and ictal activity during reperfusion (Fig. 5A–G). Both KCC2, which may run in reverse to import Cl−,16 and NKCC1, whose canonical transport direction is inward, can serve to increase [Cl−]i postictally.16 Thus furosemide, which blocks both KCC2 and NKCC1 cotransporters at 1 mmol/L, was more effective than bumetanide, which at 10 μmol/L primarily blocks NKCC1.45, 46 These results support a mechanism whereby post‐OGD and ictal increases in [Cl−]i are mediated by Cl− influx via cation‐chloride transporters. [Cl−]i varies substantially between neurons.34, 39, 47 In a subset of neurons with high baseline [Cl−]i, the measured increases in [Cl−]i are sufficient to shift EGABA to the point that GABAA receptor activation is depolarizing and excitatory. This will compromise the efficacy of GABAergic anticonvulsants that increase the mean open time of the GABAA receptor regulated chloride channels, such as benzodiazepines and barbiturates.22
Clinical relevance
Although seizures occur in animals subject to ongoing hypoxia and/or ischemia,28, 48 it is difficult to relate these phenomena to clinical practice. Seizures do not occur during resuscitation or acute endovascular treatment of stroke.49, 50 Clinically, the first therapeutic goal in hypoxia and/or ischemia is immediate re‐establishment of normoxia and adequate perfusion, rather than EEG monitoring or administration of anticonvulsants. In the face of hypoxia and/or ischemia, primary ion transport will be compromised: Na+–K+‐ ATPase will not generate sodium and potassium gradients in the absence of ATP. ATP is generated by oxidative phosphorylation, which requires oxygen and an oxidizable substrate such as glucose. Thus in the absence of oxygen and glucose, neither primary nor secondary transport will be effective, and neither will blockade of secondary transporters.48 During reperfusion after hypoxia and ischemia, or after prolonged episodes of status epilepticus, seizures often do not respond to GABAergic anticonvulsants.51, 52, 53, 54 One possible etiology is the increase in neuronal chloride observed in this study, and the consequent positive shift in GABA reversal potential. Blocking cation‐chloride cotransporters with diuretic antagonists should enhance the efficacy of these anticonvulsants (Fig. 6). An initial uncontrolled trial of the NKCC1 antagonist bumetanide was not successful,55, 56 but a controlled trial has recently completed enrollment (clinicaltrials.gov # NCT00830531).
Future directions
This study identifies pathways for Cl− entry into neurons after OGD, but not the pathophysiology that drives this entry. Damage to the brain's extracellular matrix has recently been proposed to shift the Donnan equilibria that determine the chloride steady‐state concentrations on either side of neuronal membranes.16 In this scheme, cotransporters facilitate the re‐establishment of equilibrium by increasing cytoplasmic chloride after damage to the extracellular matrix. Diuretics interfere with this equilibrative increase in cytoplasmic chloride. It may be more effective to inhibit the activity of matrix metalloproteinases57 to reduce the amount of damage to the extracellular matrix, reduce the driving force for neuronal chloride entry, and so preserve the efficacy of GABAergic anticonvulsants.
Author Contributions
TB and VD involved in acquisition and analysis of data; conception and design of the study. KS involved in conception and design of the study; drafting a significant portion of the manuscript.
Conflict of Interest
There is no conflict of interests.
Acknowledgments
We thank Michelle Mail for the technical assistance. This work was supported by the United States of America National Institutes of Health and National Institute of Neurological Disorders and Stroke grant RO1NS40109 to K.S., by William Randolph Hearst grant to V.D., and by Assistance Publique Hôpitaux de Paris and Société Française de Neurochirurgie to T.B.
Funding Information
This work was supported by the United States of America National Institutes of Health and National Institute of Neurological Disorders and Stroke grant RO1NS40109 to K.S., by William Randolph Hearst grant to V.D., and by Assistance Publique Hôpitaux de Paris and Société Française de Neurochirurgie to T.B.
Funding Statement
This work was funded by United States of America National Institutes of Health grant ; National Institute of Neurological Disorders and Stroke grant RO1NS40109; William Randolph Hearst grant ; Assistance Publique Hôpitaux de Paris grant ; Société Française de Neurochirurgie grant .
References
- 1. Wusthoff CJ, Dlugos DJ, Gutierrez‐Colina A, et al. Electrographic seizures during therapeutic hypothermia for neonatal hypoxic‐ischemic encephalopathy. J Child Neurol 2011;26:724–728. [DOI] [PMC free article] [PubMed] [Google Scholar]
- 2. Dragancea I, Backman S, Westhall E, et al. Outcome following postanoxic status epilepticus in patients with targeted temperature management after cardiac arrest. Epilepsy Behav 2015;49:173–177. [DOI] [PubMed] [Google Scholar]
- 3. Srinivasakumar P, Zempel J, Trivedi S, et al. Treating EEG seizures in hypoxic ischemic encephalopathy: a randomized controlled trial. Pediatrics 2015;136:e1302–e1309. [DOI] [PubMed] [Google Scholar]
- 4. Kharoshankaya L, Stevenson NJ, Livingstone V, et al. Seizure burden and neurodevelopmental outcome in neonates with hypoxic‐ischemic encephalopathy. Dev Med Child Neurol 2016;58:1242–1248. [DOI] [PMC free article] [PubMed] [Google Scholar]
- 5. DeLorenzo RJ, Hauser WA, Towne AR, et al. A prospective, population‐based epidemiologic study of status epilepticus in Richmond, Virginia. Neurology 1996;46:1029–1035. [DOI] [PubMed] [Google Scholar]
- 6. Suh M, Ma H, Zhao M, et al. Neurovascular coupling and oximetry during epileptic events. Mol Neurobiol 2006;33:181–197. [DOI] [PubMed] [Google Scholar]
- 7. Meldrum BS, Vigouroux RA, Brierley JB. Systemic factors and epileptic brain damage. Prolonged seizures in paralyzed, artificially ventilated baboons. Arch Neurol 1973;29:82–87. [DOI] [PubMed] [Google Scholar]
- 8. Meldrum BS, Brierley JB. Prolonged epileptic seizures in primates. Ischemic cell change and its relation to ictal physiological events. Arch Neurol 1973;28:10–17. [DOI] [PubMed] [Google Scholar]
- 9. Corsellis JA, Bruton CJ. Neuropathology of status epilepticus in humans. Adv Neurol 1983;34:129–139. [PubMed] [Google Scholar]
- 10. Auer RN, Siesjo BK. Biological differences between ischemia, hypoglycemia, and epilepsy. Ann Neurol 1988;24:699–707. [DOI] [PubMed] [Google Scholar]
- 11. Scott RC. What are the effects of prolonged seizures in the brain? Epileptic Disord 2014;16(s1):S6–S11. [DOI] [PMC free article] [PubMed] [Google Scholar]
- 12. Wijdicks EF, Parisi JE, Sharbrough FW. Prognostic value of myoclonus status in comatose survivors of cardiac arrest. Ann Neurol 1994;35:239–243. [DOI] [PubMed] [Google Scholar]
- 13. Painter MJ, Scher MS, Stein AD, et al. Phenobarbital compared with phenytoin for the treatment of neonatal seizures. N Engl J Med 1999;341:485–489. [DOI] [PubMed] [Google Scholar]
- 14. Goodkin HP, Kapur J. Responsiveness of status epilepticus to treatment with diazepan decreases rapidly as seizure duration increases. Epilepsy Curr 2003;3:11–12. [DOI] [PMC free article] [PubMed] [Google Scholar]
- 15. Niquet J, Baldwin R, Suchomelova L, et al. Benzodiazepine‐refractory status epilepticus: pathophysiology and principles of treatment. Ann N Y Acad Sci 2016;1378:166–173. [DOI] [PMC free article] [PubMed] [Google Scholar]
- 16. Glykys J, Dzhala V, Egawa K, et al. Chloride dysregulation, seizures, and cerebral edema: a relationship with therapeutic potential. Trends Neurosci 2017;40:276–294. [DOI] [PMC free article] [PubMed] [Google Scholar]
- 17. Moseley ME, Cohen Y, Mintorovitch J, et al. Early detection of regional cerebral ischemia in cats: comparison of diffusion‐ and T2‐weighted MRI and spectroscopy. Magn Reson Med 1990;14:330–346. [DOI] [PubMed] [Google Scholar]
- 18. Kahle KT, Simard JM, Staley KJ, et al. Molecular mechanisms of ischemic cerebral edema: role of electroneutral ion transport. Physiology (Bethesda) 2009;24:257–265. [DOI] [PubMed] [Google Scholar]
- 19. Stokum JA, Gerzanich V, Simard JM. Molecular pathophysiology of cerebral edema. J Cereb Blood Flow Metab 2016;36:513–538. [DOI] [PMC free article] [PubMed] [Google Scholar]
- 20. Pond BB, Berglund K, Kuner T, et al. The chloride transporter Na(+)‐K(+)‐Cl− cotransporter isoform‐1 contributes to intracellular chloride increases after in vitro ischemia. J Neurosci 2006;26:1396–1406. [DOI] [PMC free article] [PubMed] [Google Scholar]
- 21. Macdonald RL, McLean MJ. Anticonvulsant drugs: mechanisms of action. Adv Neurol 1986;44:713–736. [PubMed] [Google Scholar]
- 22. Twyman RE, Rogers CJ, Macdonald RL. Differential regulation of gamma‐aminobutyric acid receptor channels by diazepam and phenobarbital. Ann Neurol 1989;25:213–220. [DOI] [PubMed] [Google Scholar]
- 23. Czapinski P, Blaszczyk B, Czuczwar SJ. Mechanisms of action of antiepileptic drugs. Curr Top Med Chem 2005;5:3–14. [DOI] [PubMed] [Google Scholar]
- 24. Dzhala VI, Brumback AC, Staley KJ. Bumetanide enhances phenobarbital efficacy in a neonatal seizure model. Ann Neurol 2008;63:222–235. [DOI] [PubMed] [Google Scholar]
- 25. Cleary RT, Sun H, Huynh T, et al. Bumetanide enhances phenobarbital efficacy in a rat model of hypoxic neonatal seizures. PLoS ONE 2013;8:e57148. [DOI] [PMC free article] [PubMed] [Google Scholar]
- 26. Dyhrfjeld‐Johnsen J, Berdichevsky Y, Swiercz W, et al. Interictal spikes precede ictal discharges in an organotypic hippocampal slice culture model of epileptogenesis. J Clin Neurophysiol 2010;27:418–424. [DOI] [PMC free article] [PubMed] [Google Scholar]
- 27. Berdichevsky Y, Dzhala V, Mail M, et al. Interictal spikes, seizures and ictal cell death are not necessary for post‐traumatic epileptogenesis in vitro. Neurobiol Dis 2012;45:774–785. [DOI] [PMC free article] [PubMed] [Google Scholar]
- 28. Sun H, Juul HM, Jensen FE. Models of hypoxia and ischemia‐induced seizures. J Neurosci Methods 2016;260:252–260. [DOI] [PubMed] [Google Scholar]
- 29. Rice JE III, Vannucci RC, Brierley JB. The influence of immaturity on hypoxic‐ischemic brain damage in the rat. Ann Neurol 1981;9:131–141. [DOI] [PubMed] [Google Scholar]
- 30. Kuner T, Augustine GJ. A genetically encoded ratiometric indicator for chloride: capturing chloride transients in cultured hippocampal neurons. Neuron 2000;27:447–459. [DOI] [PubMed] [Google Scholar]
- 31. Nemoto EM, Frinak S. Brain tissue pH after global brain ischemia and barbiturate loading in rats. Stroke 1981;12:77–82. [DOI] [PubMed] [Google Scholar]
- 32. Chopp M, Frinak S, Walton DR, et al. Intracellular acidosis during and after cerebral ischemia: in vivo nuclear magnetic resonance study of hyperglycemia in cats. Stroke 1987;18:919–923. [DOI] [PubMed] [Google Scholar]
- 33. Berglund K, Schleich W, Wang H, et al. Imaging synaptic inhibition throughout the brain via genetically targeted Clomeleon. Brain Cell Biol 2008;36:101–118. [DOI] [PMC free article] [PubMed] [Google Scholar]
- 34. Glykys J, Dzhala VI, Kuchibhotla KV, et al. Differences in cortical versus subcortical GABAergic signaling: a candidate mechanism of electroclinical uncoupling of neonatal seizures. Neuron 2009;63:657–672. [DOI] [PMC free article] [PubMed] [Google Scholar]
- 35. Dzhala V, Valeeva G, Glykys J, et al. Traumatic alterations in GABA signaling disrupt hippocampal network activity in the developing brain. J Neurosci 2012;32:4017–4031. [DOI] [PMC free article] [PubMed] [Google Scholar]
- 36. McBain CJ, Boden P, Hill RG. Rat hippocampal slices ‘in vitro’ display spontaneous epileptiform activity following long‐term organotypic culture. J Neurosci Methods 1989;27:35–49. [DOI] [PubMed] [Google Scholar]
- 37. Dzhala VI, Kuchibhotla KV, Glykys JC, et al. Progressive NKCC1‐dependent neuronal chloride accumulation during neonatal seizures. J Neurosci 2010;30:11745–11761. [DOI] [PMC free article] [PubMed] [Google Scholar]
- 38. Huberfeld G, Wittner L, Clemenceau S, et al. Perturbed chloride homeostasis and GABAergic signaling in human temporal lobe epilepsy. J Neurosci 2007;27:9866–9873. [DOI] [PMC free article] [PubMed] [Google Scholar]
- 39. Glykys J, Dzhala V, Egawa K, et al. Local impermeant anions establish the neuronal chloride concentration. Science 2014;343:670–675. [DOI] [PMC free article] [PubMed] [Google Scholar]
- 40. Dzhala VI, Staley KJ. Excitatory actions of endogenously released GABA contribute to initiation of ictal epileptiform activity in the developing hippocampus. J Neurosci 2003;23:1840–1846. [DOI] [PMC free article] [PubMed] [Google Scholar]
- 41. Dzhala VI, Talos DM, Sdrulla DA, et al. NKCC1 transporter facilitates seizures in the developing brain. Nat Med 2005;11:1205–1213. [DOI] [PubMed] [Google Scholar]
- 42. Dzhala V, Staley KJ. Acute and chronic efficacy of bumetanide in an in vitro model of posttraumatic epileptogenesis. CNS Neurosci Ther 2015;21:173–180. [DOI] [PMC free article] [PubMed] [Google Scholar]
- 43. Lillis KP, Kramer MA, Mertz J, et al. Pyramidal cells accumulate chloride at seizure onset. Neurobiol Dis 2012;47:358–366. [DOI] [PMC free article] [PubMed] [Google Scholar]
- 44. Alfonsa H, Lakey JH, Lightowlers RN, et al. Cl− out is a novel cooperative optogenetic tool for extruding chloride from neurons. Nat Commun 2016;7:13495. [DOI] [PMC free article] [PubMed] [Google Scholar]
- 45. Gillen CM, Brill S, Payne JA, et al. Molecular cloning and functional expression of the K‐Cl cotransporter from rabbit, rat, and human. A new member of the cation‐chloride cotransporter family. J Biol Chem 1996;271:16237–16244. [DOI] [PubMed] [Google Scholar]
- 46. Payne JA. Functional characterization of the neuronal‐specific K‐Cl cotransporter: implications for [K+]o regulation. Am J Physiol 1997;273:C1516–C1525. [DOI] [PubMed] [Google Scholar]
- 47. Sulis SS, Artoni P, Landi S, et al. Simultaneous two‐photon imaging of intracellular chloride concentration and pH in mouse pyramidal neurons in vivo. Proc Natl Acad Sci USA 2017;114:E8770–E8779. [DOI] [PMC free article] [PubMed] [Google Scholar]
- 48. Kang SK, Markowitz GJ, Kim ST, et al. Age‐ and sex‐dependent susceptibility to phenobarbital‐resistant neonatal seizures: role of chloride co‐transporters. Front Cell Neurosci 2015;9:173. [DOI] [PMC free article] [PubMed] [Google Scholar]
- 49. Darkhabani Z, Nguyen T, Lazzaro MA, et al. Complications of endovascular therapy for acute ischemic stroke and proposed management approach. Neurology 2012;79:S192–S198. [DOI] [PubMed] [Google Scholar]
- 50. Seung MK, You JS, Lee HS, et al. Comparison of complications secondary to cardiopulmonary resuscitation between out‐of‐hospital cardiac arrest and in‐hospital cardiac arrest. Resuscitation 2016;98:64–72. [DOI] [PubMed] [Google Scholar]
- 51. El‐Dib M, Soul JS. The use of phenobarbital and other anti‐seizure drugs in newborns. Semin Fetal Neonatal Med 2017;22:321–327. [DOI] [PubMed] [Google Scholar]
- 52. Yozawitz E, Stacey A, Pressler RM. Pharmacotherapy for seizures in neonates with hypoxic ischemic encephalopathy. Paediatr Drugs 2017;19:553–567. [DOI] [PubMed] [Google Scholar]
- 53. Shorvon S, Ferlisi M. The treatment of super‐refractory status epilepticus: a critical review of available therapies and a clinical treatment protocol. Brain 2011;134:2802–2818. [DOI] [PubMed] [Google Scholar]
- 54. Wang NC, Good LB, Marsh ST, et al. EEG stages predict treatment response in experimental status epilepticus. Epilepsia 2009;50:949–952. [DOI] [PubMed] [Google Scholar]
- 55. Pressler RM, Boylan GB, Marlow N, et al. Bumetanide for the treatment of seizures in newborn babies with hypoxic ischaemic encephalopathy (NEMO): an open‐label, dose finding, and feasibility phase 1/2 trial. Lancet Neurol 2015;14:469–477. [DOI] [PubMed] [Google Scholar]
- 56. Thoresen M, Sabir H. Epilepsy: neonatal seizures still lack safe and effective treatment. Nat Rev Neurol 2015;11:311–312. [DOI] [PubMed] [Google Scholar]
- 57. Meisel JE, Chang M. Selective small‐molecule inhibitors as chemical tools to define the roles of matrix metalloproteinases in disease. Biochim Biophys Acta 2017;1864:2001–2014. [DOI] [PubMed] [Google Scholar]