

Abstract
The air quality of many large coastal areas in the United States is affected by the confluence of polluted urban and relatively clean marine airmasses, each with distinct atmospheric chemistry. In this context, the role of iodide-mediated ozone (O3) deposition over seawater and marine halogen chemistry accounted for in both the lateral boundary conditions and coastal waters surrounding the continental U.S. is examined using the Community Multiscale Air Quality (CMAQ) model. Several nested simulations are conducted in which these halogen processes are implemented separately in the continental U.S. and hemispheric CMAQ domains, the latter providing lateral boundary conditions for the former. Overall, it is the combination of these processes within both the continental U.S. domain and from lateral boundary conditions that lead to the largest reductions in modeled surface O3 concentrations. Predicted reductions in surface O3 concentrations occur mainly along the coast where CMAQ typically has large overpredictions. These results suggest that a realistic representation of halogen processes in marine regions can improve model prediction of O3 concentrations near the coast.
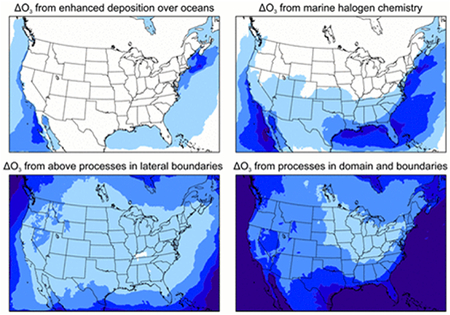
Abstract Graphic
Introduction
A large portion of the U.S. population lives in coastal areas where surface ozone (O3) concentrations can vary in part due to the relative mixture of urban and marine airmasses. Ozone can be formed locally in urban plumes(1) and can be transported to coastal areas from regional, national and international sources.(2–6) Additionally, onshore/offshore flow patterns can result in local or regional O3 precursors being advected into marine environments before reacting to form O3 and recirculating back into populated areas.(1, 7–11) Models and observations show that O3can build up over water bodies near large urban areas due, in part, to lower deposition velocities over water than land, shallower boundary layers, and ship emissions.(9, 12–15) It is in this context that we examine the role of iodide-mediated O3 deposition over seawater and marine halogen chemistry in both the coastal waters surrounding the continental U.S. and lateral boundary conditions using the Community Multiscale Air Quality (CMAQ) model.
Previous studies in urban environments have shown that gas-phase chlorine emissions (Cl2 and HOCl)(16–18) and chloride from sea-salt(19, 20) can lead to increases in O3 concentrations as a result of NO2 release via photolysis of ClNO2 and through the rapid oxidation of methane and other hydrocarbons by chlorine radicals. Conversely, halogens can deplete O3 in remote and marine environments.(21) This has been shown to occur from reactions of O3 with bromine and iodine(22–25) originating from the ocean surface(25–30) and through iodide-mediated enhanced deposition onto the ocean surface.(31)
Despite the demonstrated impact of marine halogen chemistry and iodide-mediated O3 deposition over the ocean on surface concentrations, these processes are currently not accounted for in most chemical transport models. A multimodel comparison of global and hemispheric chemical transport models found systematic overpredictions of surface O3 at regionally representative coastal sites in the Pacific Northwest and Florida/Gulf Coast.(32) Overprediction of surface O3concentrations in marine air masses by multimodel ensembles is also reported for Japanese islands in the East China Sea.(33) In recent years, several modeling studies have attempted to implement marine halogen emission sources and chemistry to better represent marine boundary layer chemistry.(34–37)
In this study, we apply the recently described implementation of iodide-mediated O3 deposition over seawater and marine halogen chemistry in the hemispheric version of the CMAQ model(38)to the continental U.S. (CONUS) domain. Compared to the coarse resolution of the hemispheric domain, the finer spatial resolution CONUS domain is expected to better to simulate the complex ocean-land-atmosphere interactions in the coastal zone while providing an opportunity to quantify the impact of these processes on the boundary conditions. Sarwar et al.(38) demonstrated that the inclusion of iodide-mediated O3 deposition and marine halogen chemistry in the hemispheric version of CMAQ reduces the large model overpredictions of surface O3 in remote marine and coastal regions throughout the Northern Hemisphere. However, extensive evaluation of CMAQ O3predictions using the national monitoring networks is more appropriate with finer horizontal resolution than the coarse model grids of the hemispheric domain. Additionally, the CONUS model domain can more closely capture the mesoscale meteorology that impacts the formation and transport of O3 in coastal areas. Employing a widely used CMAQ model domain covering the continental U.S., we used the same iodide-mediated O3 deposition and marine halogen chemistry implemented by Sarwar et al.(38) to isolate their impacts over coastal waters where the boundaries of typical regional model applications are specified. Additionally, we examined impacts of a parametrized version of the marine halogen chemistry on surface O3 predictions within the continental U.S. domain.
Materials and Methods
Model Description
The CMAQ model(39) employed in this study has been used to simulate ambient pollutant concentrations in many research and regulatory applications.(20, 40–43) Here, we employ CMAQ version 5.0 to simulate air quality over the continental U.S. using a horizontal grid resolution of 12-km. The vertical extent of the model, spanning from surface to 100 mb, is discretized with 35 layers of variable thickness with the first layer having a depth of 20 m. The model uses the CB05TUCl chemical mechanism(20) that integrates chlorine chemistry with the Carbon Bond mechanism. Anthropogenic emissions were derived from the 2005 National Emissions Inventory while biogenic emissions were derived from the Biogenic Emissions Inventory System version 3.14.(44) Emissions used in this study have been described elsewhere.(41) Meteorological fields were developed using the Weather Research and Forecasting (WRF3.4) model.(45) The configuration and evaluation of WRF have previously described by Hogrefe et al.(46) Boundary conditions were generated from the hemispheric CMAQ simulations described in Sarwar et al.(38)covering the Northern Hemisphere with a horizontal grid resolution of 108-km and 44 vertical layers from the surface to 50 mb.
Iodide-Mediated O3 Deposition over Seawater
Ozone deposition velocities over seawater predicted by CMAQ version 5.0 (median value ~0.001 cm s−1) are well below the recently documented observed O3 deposition velocities that range from 0.009 to 0.06 cm s−1 over the open ocean and up to 0.27 cm s−1 in coastal waters.(47, 48)Following the work of Chang et al.(49) and Oh et al.,(31) Sarwar et al.(38) revised the deposition of O3 to ocean surfaces in CMAQ to account for the reaction of dissolved O3 and iodide in seawater. This study uses the procedure described by Sarwar et al.(38) for O3 deposition over seawater, which calculates the O3 deposition velocity as a function of both wind speed and dissolved iodide in surface seawater (which itself is a function of sea surface temperature(50)). The value of dissolved iodide in surface seawater used for calculating O3 deposition velocities is consistent with the values previously used to calculate marine emissions of inorganic iodine.(51)Accounting for these seawater reactions in CMAQ enhances the deposition of O3 by increasing the deposition velocity from ≪0.01 cm s−1 to values in the range of 0.01–0.04 cm s−1 which are within the range of observed open ocean values, as noted above.
Marine Halogen Chemistry
The implementation of chlorine, bromine, and iodine chemistry in CMAQ has been previously described in detail(20, 38) and consists of 25 chlorine reactions adapted from Tanaka et al.,(17) 39 bromine reactions adapted from Yang et al.(34) and 53 iodine reactions adapted from Saiz-Lopez et al.(37) Marine emissions of halogen species in CMAQ fall into three categories: (1) halocarbons, (2) inorganic bromine, and (3) inorganic iodine. Halocarbon emissions include five bromocarbons and four iodocarbons, inorganic bromine is represented with one bromine species, and inorganic iodine emissions include two iodine species. The three halogen emission categories have different formation mechanisms, with halocarbons driven by chlorophyll-a concentrations, inorganic bromine driven by sea spray aerosol emissions, and inorganic iodine species driven by a combination of atmospheric O3, iodide concentration at the sea surface, and wind speed. Model inputs of chlorophyll-a concentrations(52) are derived from the Moderate Resolution Imaging Spectroradiometer (MODIS) aboard the Aqua satellite and projected to the Lambert conformal coordinate system used in the CMAQ domain.
Parameterized Marine Halogen Chemistry
Because the inclusion of detailed marine halogen chemistry increases computational time by >25%, Sarwar et al.(38) derived a first-order rate constant parametrizing the impacts of detailed marine halogen chemistry on predicted O3 concentrations. This O3 loss rate constant was developed using a nonlinear least-squares regression of the vertically resolved difference between the O3 production and loss rates for all marine regions in the Northern Hemisphere in simulations with and without detailed marine halogen chemistry (see the Supporting Information from Sarwar et al.(38) for more information). In CMAQ, the rate constant is applied to all oceanic grid cells as a function of atmospheric pressure as follows:
| (1) |
where kO3 is the halogen mediated first order O3 loss rate (s−1) and P is the pressure (Pa).
Simulation Details
Six different simulations were completed for assessing the impacts of iodide-mediated deposition, halogen chemistry, and boundary conditions on O3 concentrations (see Table 1). The first simulation (Case A) was completed using CB05TUCl with chlorine chemistry but without marine halogen chemistry or iodide-mediated O3 deposition over seawater. Time-varying boundary conditions for Case A were generated from the hemispheric CMAQ results without any iodide-mediated O3 deposition and halogen chemistry.(38) The second simulation (Case B) was completed using CB05TUCl chemistry and iodide-mediated O3 deposition. The third simulation (Case C) was completed using CB05TUCl and detailed marine halogen chemistry.(38) The boundary conditions for Cases B and C were identical to those of Case A. The fourth simulation (Case D) was completed using CB05TUCl but the boundary conditions for the model were generated from the hemispheric CMAQ results with iodide-mediated deposition and detailed halogen chemistry.(38) The fifth simulation (Case E) was completed using the CB05TUCl, iodide-mediated O3 deposition, detailed halogen chemistry, and boundary conditions with iodide-mediated deposition and detailed halogen chemistry used in Case D. Finally, the sixth simulation (Case F) was completed using the CB05TUCl, iodide-mediated O3 deposition, parametrized halogen chemistry, and boundary conditions with iodide-mediated deposition and detailed halogen chemistry used in Case D. Each simulation was completed for August 2006 with a 10-day spin-up period ending July 31st The spin-up period for the hemispheric CMAQ simulations used for boundary conditions was three-month. Hereafter, Case A will be referred to as the “Baseline” simulation and Case F the “Revised” simulation.
Table 1.
Configuration of CMAQ Model Sensitivity Simulations in the Continental U.S. Domain and Lateral Boundary Conditions
| continental U.S. configuration | hemispheric configuration | |||
|---|---|---|---|---|
| cases | iodide-mediated O3deposition | halogen chemistry | iodide-mediated O3deposition | halogen chemistry |
| Baselinea | no | no | no | no |
| Case B | yes | no | no | no |
| Case C | no | detailed | no | no |
| Case D | no | no | yes | detailed |
| Case E | yes | detailed | yes | detailed |
| Revisedb | yes | parametrized | yes | detailed |
This simulation is also referred to as the Case A simulation.
This simulation is also referred to as the Case F simulation.
Differences between the Baseline and Case B simulations are attributed to iodide-mediated O3deposition and differences between the Baseline and Case C are attributed to the impact of detailed marine halogen chemistry active within the continental model domain alone. Differences between the Baseline and Case D simulations isolate the impact of iodide-mediated O3 deposition and detailed marine halogen chemistry in the lateral boundary conditions. Differences between the Baseline and Case E represent the combined effects of iodide-mediated O3 deposition, detailed marine halogen chemistry, and lateral boundary conditions. Similar to the Baseline/Case E comparison, the Baseline/Revised simulation differences show the combined effects of these processes but with parametrized halogen chemistry. We determine model errors introduced by parametrizing marine halogen chemistry by comparing the differences between the Case E and Revised simulations.
Results
Impact of Marine Halogen Chemistry and Iodide-Mediated O3 Deposition on Surface O3 Concentrations in the Continental U.S. Domain
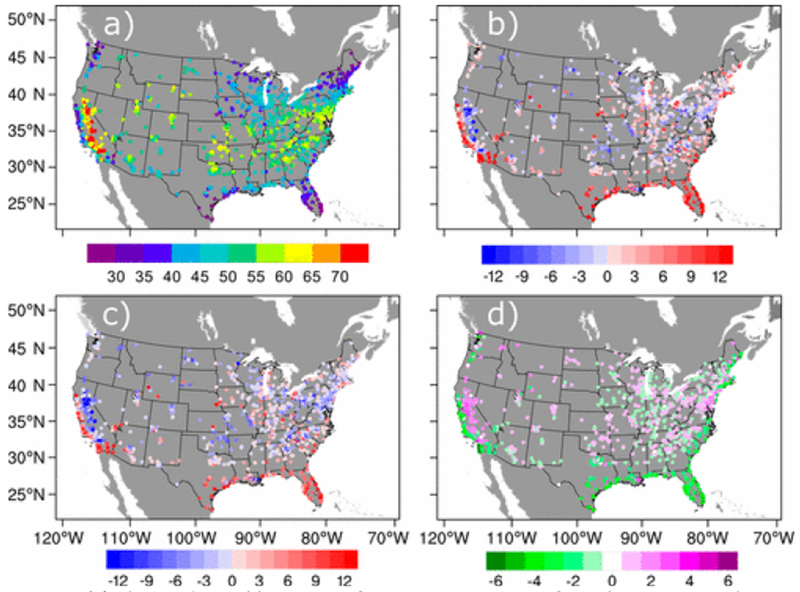
Figure 1 shows that the inclusion of iodide-mediated O3 deposition over seawater and halogen chemistry in lateral boundary conditions and/or within the continental U.S. domain have distinct impacts on the spatial distribution and magnitude of monthly mean surface maximum daily 8-h average (MDA8) O3 concentrations relative to the Baseline simulation. Iodide-mediated O3deposition, when applied only within the continental U.S. domain, has impacts of <1–2 ppb on inland and marine surface O3 concentrations with the exception of areas just along the southern Pacific and northern Atlantic coasts which have predicted O3 reductions up to 2 ppb inland and 3 ppb offshore (see Figure 1a). These hotspots of O3 reduction also have high O3 deposition rates in the Baseline simulation (due to moderate/high surface O3 concentrations and wind speeds) that are further enhanced by the inclusion of the O3-iodide reaction in seawater.
Figure 1.
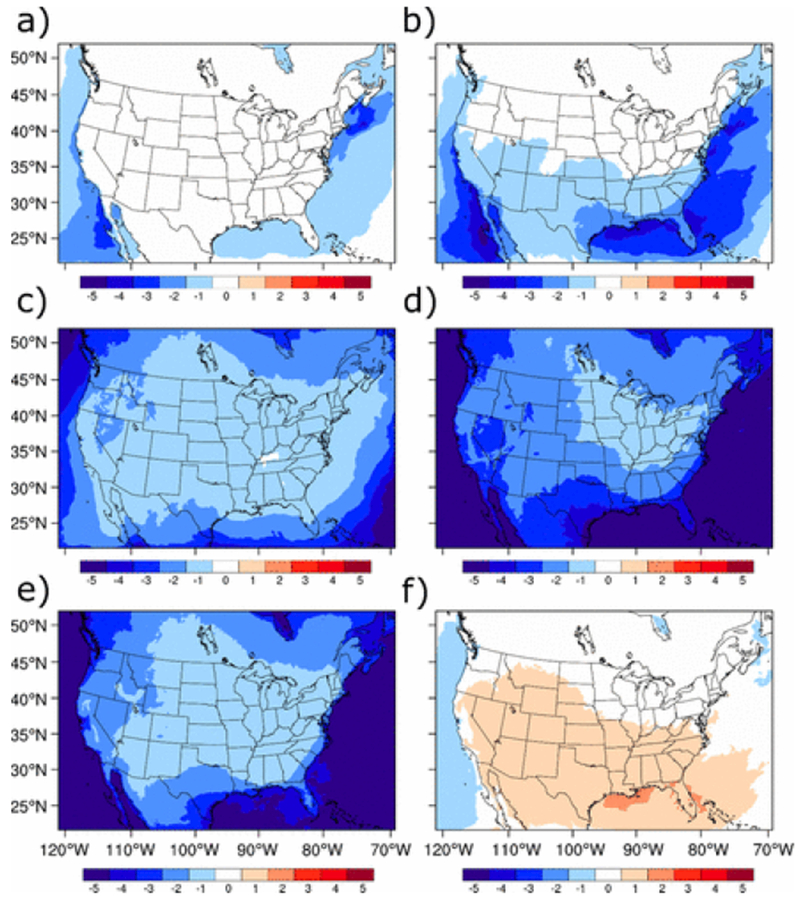
Average monthly mean changes in predicted surface MDA8 O3 concentrations (in units of ppb) for August 2006 due to (a) iodide-mediated deposition solely in the CONUS domain (Case B minus Baseline), (b) detailed halogen chemistry solely in the CONUS domain (Case C minus Baseline), (c) iodide-mediated deposition and detailed halogen chemistry solely in hemispheric domain (i.e., represented in the lateral boundary conditions for the CONUS domain) (Case D minus Baseline), (d) the combination of iodide-mediated deposition and detailed halogen chemistry in both the CONUS and hemispheric domains (Case E minus Baseline), (e) combination of iodide-mediated deposition and parametrized marine halogen chemistry in the CONUS domain and iodide-mediated deposition and detailed halogen chemistry in the lateral boundary conditions (Revised minus Baseline), and (f) parametrized marine halogen chemistry in the CONUS domain relative to that of detailed marine halogen chemistry (Revised minus Case E). Note that when the scale labels of this and subsequent figures are situated in the middle of the color block, they represent the middle of the range indicated by the color.
Relative to iodide-mediated O3 deposition, detailed marine halogen chemistry in the continental U.S. domain (see Figure 1b) results in monthly mean MDA8 O3 reductions that are greater in magnitude and occur further inland. Unlike deposition changes which only affect the surface layer, marine halogen chemistry reduces O3 in all model layers and can therefore impact regional O3concentrations. Widespread areas over the Pacific, Atlantic, and Gulf of Mexico have reductions in surface O3 concentrations around 3 ppb, whereas areas along the Baja California and Gulf of Mexico coasts have O3 reductions in excess of 4 ppb. The short oceanic fetch near the boundaries of the regional domain results in little O3 impact from either iodide-mediated O3deposition or detailed marine halogen chemistry.
When iodide-mediated O3 deposition and detailed halogen chemistry are included solely in the hemispheric CMAQ simulations used to generate lateral boundary conditions for the continental U.S. domain (see Figure 1c), reductions of 4–5 ppb in surface MDA8 O3 concentrations are predicted at the boundaries with lesser (1–2 ppb) reductions over much of the continental U.S. In the western U.S., high elevation areas in vicinity of the Great Basin have relatively greater reductions of surface O3 than the surrounding lower elevations areas because they are more likely to be influenced by free tropospheric air masses that are affected by the larger O3 reductions in the lateral boundary conditions.(53) Along the western edge of the CONUS domain, the lateral boundary conditions have monthly mean MDA8 O3 reductions of ~5 ppb from the surface up to 1 km (and by >2 ppb for all vertical layers up to 50 mb) when iodide-mediated O3 deposition and detailed halogen chemistry are included in the hemispheric CMAQ simulations. Supporting Information Figure S1 shows that the Revised simulation had a similar reduction in O3concentrations above the surface at coastal and near-coastal sites when compared to the Baseline simulation. Including iodide-mediated O3 deposition and marine halogen chemistry in both the lateral boundary conditions and within the continental U.S. domain results in widespread surface O3 concentration reductions in excess of 5 ppb over the ocean and 1–4 ppb over land as shown in Figure 1d. The largest inland surface O3 reductions occur near the coasts, with the western U.S. and Gulf Coast typically having greater reductions than the northeastern U.S. due to the differences in the wind directions between these regions. The magnitude of these reductions is similar to that of the Sarwar et al.(38) hemispheric CMAQ results.
Detailed vs Parametrized Marine Halogen Chemistry
Although the first order rate constant used in the parametrized marine halogen chemistry simulations was derived from simulations with detailed marine halogen chemistry, spatial differences in the halogen emissions and long atmospheric lifetimes of several halogen species result in subtle differences in the surface O3 impacts. A comparison of Figure 1e and d shows that O3 reductions in the simulation with parametrized marine halogen chemistry are similar to that of detailed marine halogen chemistry, with inland and marine regions having a 1–4 and ≥5 ppb reduction, respectively. A difference plot of the two simulations in Figure 1f, however, shows that the simulation with parametrized marine halogen chemistry has lower O3 concentrations over most of the Pacific Ocean and higher O3 concentrations over much of the Gulf of Mexico, Atlantic Ocean, and most inland regions due to the impact of sea surface temperature and halogen lifetime on modeled O3. Unlike the parametrized marine halogen chemistry simulations, the detailed chemistry simulation includes sea surface temperature-dependent inorganic iodine emissions and chemical reactions between halogens and O3 occurring well inland. Because predicted surface O3concentrations in the detailed and parametrized halogen chemistry simulations are typically within 1 ppb over most inland regions of the continental U.S. and the parametrized marine halogen chemistry requires significantly less computational time, this Revised simulation was used for comparison to ambient measurements as described below.
Comparison with TexAQS Ship-Based O3 Measurements
The 2006 Texas Air Quality Study - Gulf of Mexico Atmospheric Composition and Climate Study (TexAQS/GoMACCS(54)) campaign provides a valuable data set for evaluating CMAQ surface O3predictions over the Gulf of Mexico during this time period. Throughout August 2006, the NOAA research vessel Ronald H. Brown (R/V Brown) measured surface O3 concentrations (see Figure 2a) in the north-central Gulf of Mexico near Houston, TX. Figure 2b shows that the Baseline CMAQ predictions overpredict O3 in the north-central Gulf of Mexico by 10–12 ppb with the exception of isolated underpredictions near Houston-Galveston and Port Arthur, TX where high NOx levels suggest O3 titration. The largest overpredictions occur near the coast, but overpredictions of 5–10 ppb extend well offshore into the Gulf of Mexico. The change in mean bias between the Baseline and Revised simulations in Figure 2d shows a widespread 3–4 ppb bias reduction in the Revised simulation offshore in the Gulf of Mexico and slightly higher bias reductions (up to 6 ppb) near the coast. Coastal urban areas like Houston where the Baseline simulation underpredicts O3 concentrations experience a slight degradation in the O3 model bias (1–2 ppb larger underprediction) with the implementation of iodide-mediated O3 deposition and marine halogen chemistry in the Revised CMAQ simulation. The modeled O3 underprediction in Houston likely occurs due to several factors including uncertainties in emissions, grid resolution, or the complex chemistry of the area.
Figure 2.
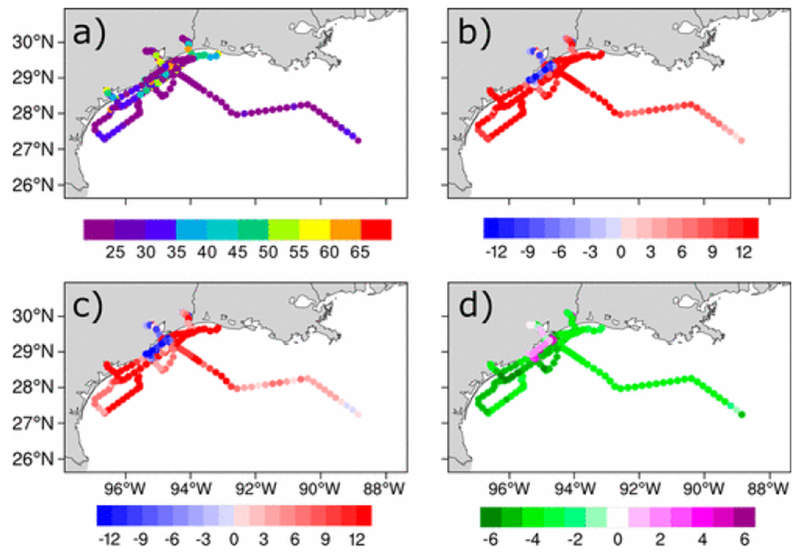
(a) Observed surface O3 concentrations from R/V Ronald H. Brown during the August 2006 period of the TexAQS campaign (b) mean bias for Baseline simulation (c) mean bias for Revised simulation, and d) changes in mean bias between the Baseline and Revised simulations. The green colors in (d) represent locations where the Revised simulation had a lower model bias (improved prediction) and purple colors represent locations where the Revised simulation had a higher model bias (worse prediction). All units are in ppb.
For all hourly averaged O3 measurements in August 2006 from the R/V Brown matched in space to the hourly model concentration, the Revised simulation has a reduced normalized mean bias (49.2 to 34.2%) and normalized mean error (65.9 to 53.2%) and has a slightly improved Pearson’s correlation efficient (0.66 to 0.69) relative to the Baseline simulation.
Comparison with MDA8 Surface O3 Measurements Across the Continental U.S
Figure 3 shows that CMAQ generally overpredicts O3 during periods with the lowest observed concentrations (likely dominated by marine airmasses) and underpredicts O3 during the highest concentrations (likely dominated by urban airmasses), with the greatest improvement in model performance occurring during these low concentrations. This pattern of overpredicting low concentrations and underpredicting high concentrations is present in previous versions of CMAQ, and is still an active area of research.(40) When only sites immediately along the coastline are considered in the analysis, the Revised simulation had an even greater improvement of the predicted MDA8 O3 mean bias (see Supporting Information Figure S2).
Figure 3.
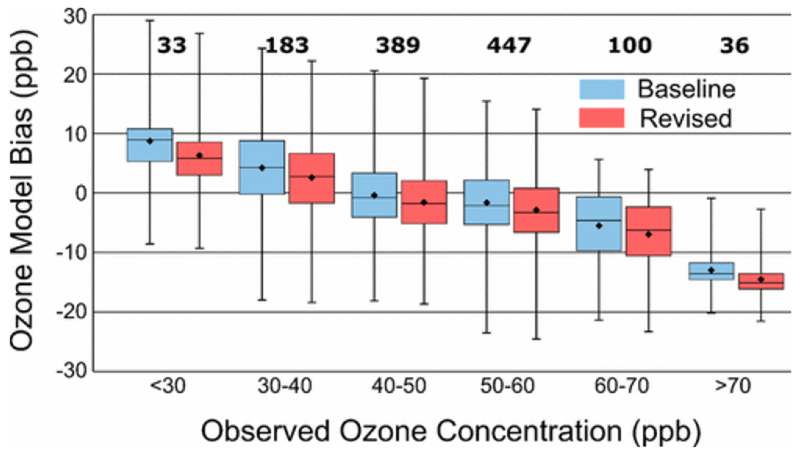
Monthly mean MDA8 bias in August 2006 for the Baseline and Revised simulations, binned by observed MDA8 O3 concentrations retrieved from the EPA Air Quality System (AQS) database. The lower bar in the box represents 25th percentile, middle bar represents the median, and upper bar represents 75th percentile values. The mean values are given by the diamonds, maximum and minimum values are shown by the error bars, and the numbers in bold indicate the total number of monitors in each O3 concentration bin.
Similar to previous modeling studies having systematic overprediction of surface O3concentrations at nonurban coastal sites in the continental U.S.,(32, 55) comparison of observed MDA8 surface O3 measurements (see Figure 4a, Supporting Information Figure S3) with the Baseline CMAQ simulation reveals overpredictions in the monthly mean MDA8 O3 concentrations by 5–10 ppb at several coastal sites in California, Gulf of Mexico, and southeast U.S. for August 2006 (see Figure 4b, Supporting Information Figure S4). The insets within Supporting Information Figure S4 reveal divergent model biases for O3 in the Baseline simulation at urban and nonurban sites along the coast, with underpredictions at some urban sites near Los Angeles, CA, Houston, TX, and New Orleans, LA and overpredictions outside urban regions. The Baseline simulation shows a previously reported(40) systematic overprediction of surface O3 concentrations over the entire continental U.S. at the lowest observed values and underprediction at the highest observed values (see Figure 3).
Figure 4.
(a) Observed monthly mean surface O3 concentrations from the EPA Air Quality System (AQS) sites in August 2006, (b) mean bias for the Baseline simulation at AQS sites (c) mean bias for the Revised simulation at AQS sites and (d) change in mean bias between the Baseline and Revised simulations at AQS sites. The green colors in (d) represent sites where the Revised simulation had a lower mean bias (improved prediction) and purple colors represent sites where the Revised simulation had a higher mean bias (worse prediction). All units are in ppb.
Comparison of the monthly mean bias in the Baseline (Figure 4b) and Revised (Figure 4c) simulations shows that the Revised simulation has lower bias at many sites in the continental U.S. relative to the Baseline. Generally, the consistent O3 concentration reduction in the Revised simulation results in lower bias when the Baseline simulation is biased high and higher bias when the Baseline simulation is biased low (see Figure 4c, Supporting Information Figure S5). The largest reductions in monthly mean bias were along the California coast, where the bias are reduced by >5 ppb (see Figure 4d, Supporting Information Figure S6). In high O3 concentration areas near the coast such as the Central Valley of California and the metropolitan region from Washington DC to New York City, O3 underpredictions in the Baseline simulation are exacerbated in the Revised simulation. The higher bias in some coastal urban and inland areas in California may be due to emissions uncertainties and complex meteorology which is poorly predicted in fine scale (4 km) simulations,(56) let alone the 12 km model resolution of the CONUS domain. Along the Gulf and Atlantic coasts, the Revised simulation has reductions in the bias of 2–3 ppb for the majority of sites, similar to the bias reductions in the offshore and near-coastal nonurban TexAQS predictions. Because the Revised simulation has consistent reductions in O3 concentrations across the continental U.S. relative to the Baseline simulation, the pattern of overpredictions/underpredictions at low/high observed concentrations is retained in the Revised simulation (see Figure 3). The preponderance of very low observed O3 concentrations at coastal sites (see Supporting Information Figure S3) that are affected by iodide-mediated O3 deposition and marine halogen chemistry results in greater reduction of the bias at the lowest observed concentrations than increases in the bias at the highest observed concentrations (see Figure 3).
Discussion
As health science continues to support the lowering of standards for ozone and many criteria pollutants, realistic simulation of the processes affecting background O3 concentrations has become increasingly important to the development of air quality management plans for attaining these lower standards.(57) This work shows the importance of properly representing marine halogen processes including emissions, chemistry, and deposition in chemical transport models such as CMAQ to the prediction of surface O3 concentrations at coastal (and some inland) sites during low O3 periods. The spatially variable impact of lateral boundary conditions on model predictions of O3 in the CONUS domain was also demonstrated, highlighting the importance of including these marine halogen processes in global/hemispheric models that feed the lateral boundary conditions.(58–60) Including these marine halogen processes in the model does not completely alleviate overpredictions of low surface O3 concentrations along the coast and over the open ocean, and exacerbates underpredictions of high surface O3 concentrations in some near-coast areas like the Central Valley of California and the metropolitan region from Washington DC to New York City. Many factors are likely responsible for these persistent over- and underpredictions, including model representation of boundary layer mixing or ventilation processes and uncertain emissions. For a comprehensive evaluation of O3 model performance at sites across the U.S. using the latest public release of CMAQ, see Appel et al.(61)
While previous studies have examined the factors affecting O3 deposition on a local or regional scale,(31, 49) marine halogen emissions and their impact on atmospheric chemistry have been studied mainly using global models.(27, 29, 35, 36) These different domains may have distinct factors affecting marine halogen emissions due to the preponderance of coastal vs open ocean waters within the domain. The uncertainty in the marine halogen emissions used in this study is also particularly high because of the scarcity of marine halogen observations to evaluate the model performance.
Not yet included in these simulations is the impact of seawater dimethyl sulfide, dissolved organic carbon, bromine, or dissolved salts on the O3 deposition over seawater which has recently been studied using the hemispheric CMAQ model.(62) Further improvement in the predicted O3concentrations over marine regions could be achieved through the use of planetary boundary layer parametrizations based on eddy-diffusivity–mass-flux concepts(63) or the inclusion of photochemical reactions of higher iodine oxides.(37) Additional future work may also include extending both the hemispheric and CONUS CMAQ simulations with these marine halogen processes over an entire year to better understand their impact on the seasonal variability of surface concentrations and vertical profiles of O3 and other oxidants and to enable long-lived halocarbons to release their reactive halogen atoms. As both long-range transport patterns and design value calculations have a seasonal component, this annual simulation would better quantify the impact of marine halogen processes to regulatory-based model predictions of O3.
Supplementary Material
Acknowledgment
The Community Multiscale Air Quality (CMAQ) model (CMAQv5.0) was used for generating the model results. The CMAQ model can be downloaded from www.cmascenter.org. We also acknowledge James Johnson with NOAA-PMEL for the use of the R/V Ronald H. Brown ozone data measured during TexAQS-GoMACCS 2006 and Gary Morris formerly of Valparaiso University for the ozonesonde data measured during the INTEX-B Ozonesonde Network Study. All plots and analyses were performed using the NCAR Command Language (Version 6.3.0), UCAR/NCAR/CISL/TDD: http://dx.doi.org/10.5065/D6WD3XH5. Lastly, we greatly appreciate the comments of the three anonymous reviewers.
Footnotes
This article represents the authors’ views and not necessarily those officially of the EPA.
The authors declare no competing financial interest.
References
- 1.Parrish DD; Hanwant SB; Molina L; Madronich S Air quality progress in North American megacities: A review Atmos. Environ. 2011, 45, 7015–7025 DOI: 10.1016/j.atmosenv.2011.09.039 [DOI] [Google Scholar]
- 2.Mao H; Talbot R Role of meteorological processes in two New England ozone episodes during summer 2001 J. Geophys. Res 2004, 109, D20305 DOI: 10.1029/2004JD004850 [DOI] [Google Scholar]
- 3.Chen M; Talbot R; Mao H; Sive B; Chen J; Griffin RJ Air mass classification in coastal New England and its relationship to meteorological conditions J. Geophys. Res 2007, 112, D10S05 DOI: 10.1029/2006JD007687 [DOI] [Google Scholar]
- 4.Parrish DD; Millet DB; Goldstein AH Increasing ozone in marine boundary layer inflow at the west coasts of North America and Europe Atmos. Chem. Phys 2009, 9, 1303–1323 DOI: 10.5194/acp-9-1303-2009 [DOI] [Google Scholar]
- 5.Huang M; Carmichael GR; Adhikary B; Spak SN; Kulkarni S; Cheng YF; Wei C; Tang Y.; Parrish DD; Oltmans SJ Impacts of transported background ozone on California air quality during the ARCTAS-CARB period – a multi-scale modeling study Atmos. Chem. Phys 2010, 10, 6947–6968 DOI: 10.5194/acp-10-6947-2010 [DOI] [Google Scholar]
- 6.Zhang H; Ying Q Contributions of local and regional sources of NOx to ozone concentrations in Southeast Texas Atmos. Environ. 2011, 45, 2877–2887 DOI: 10.1016/j.atmosenv.2011.02.047 [DOI] [Google Scholar]
- 7.Yimin M; Lyons TJ Recirculation of coastal urban air pollution under a synoptic scale thermal trough in Perth, Western Australia Atmos. Environ. 2003, 37, 443–454 DOI: 10.1016/S1352-2310(02)00926-3 [DOI] [Google Scholar]
- 8.Boucouvala D; Bornstein R Analysis of transport patterns during an SCOS97-NARSTO episode Atmos. Environ. 2003, 37 (Suppl. 2) 73–94 DOI: 10.1016/S1352-2310(03)00383-2 [DOI] [Google Scholar]
- 9.Banta RM; Seniff CJ; Nielsen-Gammon J; Darby LS; Ryerson TB; Alvarez RJ; Sandberg SR; Williams EJ; Trainer M A bad air day in Houston Bull. Am. Meteorol. Soc 2005, 86 (5)657–669 DOI: 10.1175/BAMS-86-5-657 [DOI] [Google Scholar]
- 10.Darby LS Cluster analysis of surface winds in Houston, Texas, and the impact of wind patterns on ozone J. Appl. Meteorol 2005, 44, 1788–1806 DOI: 10.1175/JAM2320.1 [DOI] [Google Scholar]
- 11.Loughner CP; Tzortziou M; Follette-Cook M; Pickering KE; Goldberg D; Satam C; Weinheimer A; Crawford JH; Knapp DJ; Montzka DD Impact of bay-breeze circulations on surface air quality and boundary layer export J. Appl. Meteorol. Clim 2014, 53, 1697–1713 DOI: 10.1175/JAMC-D-13-0323.1 [DOI] [Google Scholar]
- 12.Angevine WM; Senff CJ; White AB; Williams EJ; Koermer J; Miller STK; Talbot R; Johnston PE; McKeen SA; Downs T. Coastal boundary layer influence on pollutant transport in New England J. Appl. Meteorol 2004, 43, 1425–1437 DOI: 10.1175/JAM2148.1 [DOI] [Google Scholar]
- 13.Goldberg DL; Loughner CP; Tzortziou M; Stehr JW; Pickering KE; Marufu LT; Dickerson RR Higher surface ozone concentrations over the Chesapeake Bay than over the adjacent land: Observations and models from the DISCOVER-AQ and CBODAQ campaigns Atmos. Environ. 2014, 84, 9–19 DOI: 10.1016/j.atmosenv.2013.11.008 [DOI] [Google Scholar]
- 14.Cleary PA; Fuhrman N; Schulz L; Schafer J; Fillingham J; Bootsma H; McQueen J; Tang Y; Langel T; McKeen S Ozone distributions over southern Lake Michigan: comparisons between ferry-based observations, shoreline-based DOAS observations and model forecasts Atmos. Chem. Phys 2015,15, 5109–5122 DOI: 10.5194/acp-15-5109-2015 [DOI] [Google Scholar]
- 15.Burley JD; Theiss S; Bytnerowicz A; Gertler A; Schilling S; Zielinska B. Surface ozone in the Lake Tahoe basin Atmos. Environ. 2015, 109, 351–369 DOI: 10.1016/j.atmosenv.2015.02.001 [DOI] [Google Scholar]
- 16.Chang SY; McDonaldBuller E; Kimura Y; Yarwood G; Neece J; Russell M; Tanaka P; Allen D. Sensitivity of urban ozone formation to chlorine emission estimates Atmos. Environ. 2002, 36, 4991–5003DOI: 10.1016/S1352-2310(02)00573-3 [DOI] [Google Scholar]
- 17.Tanaka PL; Riemer DD; Change SH; Yarwood G; McDonald-Buller EC; Apel EC; Orlando JJ; Silva PJ; Jimenez JL; Canagaratna MR Direct evidence for chlorine-enhanced urban ozone formation in Houston, Texas Atmos. Environ. 2003, 37, 1393–1400 DOI: 10.1016/S1352-2310(02)01007-5 [DOI] [Google Scholar]
- 18.Sarwar G; Bhave PV Modeling the effect of chlorine emissions on ozone levels over the eastern United States J. Appl. Meteorol. Clim 2007, 46, 1009–1019 DOI: 10.1175/JAM2519.1 [DOI] [Google Scholar]
- 19.Simon H; Kimura Y; McGaughey G; Allen DT; Brown SS; Osthoff HD; Roberts JM; Byun D; Lee D. Modeling the impact of ClNO2 on ozone formation in the Houston area J. Geophys. Res 2009, 114, D00F03 DOI: 10.1029/2008JD010732 [DOI] [Google Scholar]
- 20.Sarwar G; Simon H; Bhave P; Yarwood G Examining the impact of heterogeneous nitryl chloride production on air quality across the United States Atmos. Chem. Phys 2012, 12, 6455–6473 DOI: 10.5194/acp-12-6455-2012 [DOI] [Google Scholar]
- 21.Saiz-Lopez A; von Glasow R. Reactive halogen chemistry in the troposphere Chem. Soc. Rev 2012, 41,6448–6472 DOI: 10.1039/c2cs35208g [DOI] [PubMed] [Google Scholar]
- 22.Chameides WL; Davis DD. Iodine: Its possible role in tropospheric photochemistry J. Geophys. Res 1980, 85 (C12) 7383–7398 DOI: 10.1029/JC085iC12p07383 [DOI] [Google Scholar]
- 23.Solomon S; Garcia RR; Ravishankara AR. On the role of iodine in ozone depletion J. Geophys. Res 1994, 99, 20491–20499 DOI: 10.1029/94JD02028 [DOI] [Google Scholar]
- 24.Saiz-Lopez A; Mahajan AS; Salmon RA; Bauguitte SJ-B; Jones AE; Roscoe HK; Plane JMC. Boundary layer halogens in coastal Antarctica Science 2007, 317, 348–351 DOI: 10.1126/science.1141408 [DOI] [PubMed] [Google Scholar]
- 25.Read KA; Mahajan AS; Carpenter LJ; Evans MJ; Faria BVE; Heard DE; Hopkins JR; Lee JD; M?ller SJ; Lewis AC. Extensive halogen mediated ozone destruction over the tropical Atlantic Ocean Nature 2008, 453, 1232–1235 DOI: 10.1038/nature07035 [DOI] [PubMed] [Google Scholar]
- 26.Alicke B; Hebestreit K; Stutz J; Platt U. Iodine oxide in the marine boundary layer Nature 1999, 397,572–573 DOI: 10.1038/1750810050849 [DOI] [Google Scholar]
- 27.Mahajan AS; Gómez Martín JC; Hay TD; Royer S-J; Yvon-Lewis S; Liu Y; Hu L; Prados-Roman C; Ordóñez C; Plane JMC Latitudinal distribution of reactive iodine in the Eastern Pacific and its link to open ocean sources Atmos. Chem. Phys 2012, 12, 11609–11617 DOI: 10.5194/acp-12-11609-2012 [DOI] [Google Scholar]
- 28.Carpenter LJ; MacDonald SM; Shaw MD; Kumar R; Saunders RW; Parthipan R; Wilson J; Plane JMC Atmospheric iodine levels influenced by sea surface emissions of inorganic iodine Nat. Geosci 2013, 6, 108–111 DOI: 10.1038/ngeo1687 [DOI] [Google Scholar]
- 29.Prados-Roman C; Cuevas CA; Hay T; Fernandez RP; Mahajan AS; Royer S-J; Gali M; Simo R; Dachs J; Großmann K Iodine oxide in the global marine boundary layer Atmos. Chem. Phys 2015, 15, 583–593 DOI: 10.5194/acp-15-583-2015 [DOI] [Google Scholar]
- 30.Simpson WR; Brown SS; Saiz-Lopez A; Thornton JA; Von Glasow R Tropospheric Halogen Chemistry: Sources, Cycling, and Impacts Chem. Rev 2015, 115, 4035–4062 DOI: 10.1021/cr5006638 [DOI] [PMC free article] [PubMed] [Google Scholar]
- 31.Oh I-B; Byun DW; Kim H-C; Kim S; Cameron B Modeling the effect of iodide distribution on ozone deposition to seawater surface Atmos. Environ 2008, 42, 4453–4466 DOI: 10.1016/j.atmosenv.2008.02.022 [DOI] [Google Scholar]
- 32.Reidmiller DR; Fiore AM; Jaffe DA; Bergmann D; Cuvelier C; Dentener FJ; Duncan BN; Folberth G; Gauss M; Gong S The influence of foreign vs. North American emissions on surface ozone in the US. Atmos. Chem. Phys 2009, 9, 5027–5042 DOI: 10.5194/acp-9-5027-2009 [DOI] [Google Scholar]
- 33.Han Z; Sakurai T; Ueda H; Carmichael GR; Streets D; Hayami H; Wang Z; Hollowy T; Engardt M; Hozumi Y MICS-Asia II: Model intercomparison and evaluation of ozone and relevant species Atmos. Environ 2008, 42 (15) 3491–3509 DOI: 10.1016/j.atmosenv.2007.07.031 [DOI] [Google Scholar]
- 34.von Glasow R; von Kuhlmann R; Lawrence MG; Platt U; Crutzen PJ Impact of reactive bromine chemistry in the troposphere Atmos. Chem. Phys 2004, 4, 2481–2497 DOI: 10.5194/acp-4-2481-2004 [DOI] [Google Scholar]
- 35.Yang X; Cox RA; Warwick NJ; Pyle JA; Carver GD; O’Connor FM; Savage NH Tropospheric bromine chemistry and its impacts on ozone: A model study J. Geophys. Res 2005, 110, D23311 DOI: 10.1029/2005JD006244 [DOI] [Google Scholar]
- 36.Ordóñez C; Lamarque J-F; Tilmes S; Kinnison DE; Atlas EL; Blake DR; Sousa Santos G; Brasseur G; Saiz-Lopez A Bromine and iodine chemistry in a global chemistry-climate model: description and evaluation of very short-lived oceanic sources Atmos. Chem. Phys 2012, 12, 1423–1447 DOI: 10.5194/acp-12-1423-2012 [DOI] [Google Scholar]
- 37.Saiz-Lopez A; Fernandez RP; Ordóñez C; Kinnison DE; Gómez Martín JC; Lamarque J-F; Tilmes S Iodine chemistry in the troposphere and its effect on ozone Atmos. Chem. Phys 2014, 14,13119–13143 DOI: 10.5194/acp-14-13119-2014 [DOI] [Google Scholar]
- 38.Sarwar G; Gantt B; Schwede D; Foley K; Mathur R; Saiz-Lopez A Impact of enhanced ozone deposition and halogen chemistry on tropospheric ozone over the Northern Hemisphere Environ. Sci. Technol 2015, 49 (15) 9203–9211 DOI: 10.1021/acs.est.5b01657 [DOI] [PubMed] [Google Scholar]
- 39.Byun D; Schere KL Review of the governing equations, computational algorithms, and other components of the Models-3 Community Multiscale Air Quality (CMAQ) Modeling System Appl. Mech. Rev 2006, 59, 51–77 DOI: 10.1115/1.2128636 [DOI] [Google Scholar]
- 40.Foley KM; Roselle SJ; Appel KW; Bhave PV; Pleim JE; Otte TL; Mathur R; Sarwar G; Young JO; Gilliam RC Incremental Testing of the Community Multiscale Air Quality (CMAQ) Modeling System Version 4.7 Geosci. Model Dev 2010, 3, 205–226 DOI: 10.5194/gmd-3-205-2010 [DOI] [Google Scholar]
- 41.Appel KW; Pouliot G; Simon H; Sarwar G; Pye HOT; Napelenok S; Akhtar F; Roselle SJ Evaluation of dust and trace metal estimates from the Community Multiscale Air Quality (CMAQ) model version 5.0 Geosci. Model Dev 2013, 6, 883–899 DOI: 10.5194/gmd-6-883-2013 [DOI] [Google Scholar]
- 42.Sarwar G; Simon H; Xing J; Mathur R Importance of tropospheric ClNO2 chemistry across the Northern Hemisphere Geophys. Res. Lett 2014, 41, 4050–4058 DOI: 10.1002/2014GL059962 [DOI] [Google Scholar]
- 43.Xing J; Mathur R; Pleim J; Hogrefe C; Gan C-M; Wong DC; Wei C; Gilliam R; Pouliot G Observations and modeling of air quality trends over 1990–2010 across the Northern Hemisphere: China, the United States and Europe Atmos. Chem. Phys 2015, 15, 2723–2747 DOI: 10.5194/acp-15-2723-2015 [DOI] [Google Scholar]
- 44.Schwede D; Pouliot G; Pierce T Changes to the biogenic emissions inventory system version 3 (BEIS3), 4th Annual CMAS Models-3 Users’ Conference, September 26–28 2005, UNC-Chapel Hill, NC, available at: https://www.cmascenter.org/conference/2005/abstracts/2_7.pdf. [Google Scholar]
- 45.Skamarock WC; Klemp JB; Dudhia J; Gill DO; Barker DM; Duda MG; Huang X-Y; Wang W; Powers JG A Description of the Advanced Research WRF Version 3, NCAR/TN-475+STR; Mesoscale and Microscale Meteorology Division, National Center for Atmospheric Research: Cambridge, MA, 2008 [Google Scholar]
- 46.Hogrefe C; Pouliot G; Wong D; Torian A; Roselle S; Pleim J; Mathur R Annual application and evaluation of the online coupled WRF–CMAQ system over North America under AQMEII phase 2 Atmos. Environ 2015, 115, 683–694 DOI: 10.1016/j.atmosenv.2014.12.034 [DOI] [Google Scholar]
- 47.Ganzeveld L; Helmig D; Fairall CW; Hare J; Pozzer A Atmosphere-ocean ozone exchange: A global modeling study of biogeochemical, atmospheric, and waterside turbulence dependencies. GlobalBiogeochem. Cycles 2009, 23, GB4021 DOI: 10.1029/2008GB003301 [DOI] [Google Scholar]
- 48.Helmig D; Lang EK; Bariteau L; Boylan P; Fairall CW; Ganzeveld L; Hara JE; Hueber J; Pallandt M Atmosphere-ocean ozone fluxes during the TexAQS 2006, STRATUS 2006, GOMECC 2007, GasEx 2008, and AMMA 2008 cruises J. Geophys. Res 2012, 117, D04305 DOI: 10.1029/2011JD015955 [DOI] [Google Scholar]
- 49.Chang W; Heikes BG; Lee M Ozone deposition to the sea surface: chemical enhancement and wind speed dependence Atmos. Environ 2004, 38, 1053–1059 DOI: 10.1016/j.atmosenv.2003.10.050 [DOI] [Google Scholar]
- 50.Chance R; Baker AR; Carpenter L; Jickells TD The distribution of iodide at the sea surface Environ. Sci.: Processes Impacts 2014, 16, 1841–1859 DOI: 10.1039/C4EM00139G [DOI] [PubMed] [Google Scholar]
- 51.MacDonald SM; Gómez Martín JC; Chance R; Warriner S; Saiz-Lopez A; Carpenter LJ; Plane JMC A laboratory characterisation of inorganic iodine emissions from the sea surface: dependence on oceanic variables and parameterisation for global modelling Atmos. Chem. Phys 2014, 14,5841–5852 DOI: 10.5194/acp-14-5841-2014 [DOI] [Google Scholar]
- 52.Hu C; Lee Z; Franz B Chlorophyll a algorithms for oligotrophic oceans: A novel approach based on three-band reflectance difference J. Geophys. Res 2012, 117 (C1) C01011 DOI: 10.1029/2011JC007395 [DOI] [Google Scholar]
- 53.Cooper OR; Gao RS; Tarasick D; Leblanc T; Sweeney C Long-term ozone trends at rural ozone monitoring sites across the United States, 1990–2010 J. Geophys. Res.-Atmos 2012, 117, D22307 DOI: 10.1029/2012JD018261 [DOI] [Google Scholar]
- 54.Parrish DD; Allen DT; Bates TS; Estes M; Fehsenfeld FC; Feingold G; Ferrare R; Hardesty RM; Meagher JF; Nielsen-Gammon JW Overview of the Second Texas Air Quality Study (TexAQS II) and the Gulf of Mexico Atmospheric Composition and Climate Study (GoMACCS) J. Geophys. Res 2009, 114, D00F13 DOI: 10.1029/2009JD011842 [DOI] [Google Scholar]
- 55.Dolwick P; Akhtar F; Baker KR; Possiel N; Simon H; Tonnesen G Comparison of background ozone estimates over the western United States based on two separate model methodologies Atmos. Environ 2015, 109, 282–296 DOI: 10.1016/j.atmosenv.2015.01.005 [DOI] [Google Scholar]
- 56.Kelly JT; Baker KR; Nowak JB; Murphy JG; Markovic MZ; VandenBoer TC; Ellis RA; Neuman JA; Weber RJ; Roberts JM Fine-scale simulation of ammonium and nitrate over the South Coast Air Basin and San Joaquin Valley of California during CalNex-2010 J. Geophys. Res.-Atmos 2014,119, 3600–3614 DOI: 10.1002/2013JD021290 [DOI] [Google Scholar]
- 57.Environmental Protection Agency (EPA).Implementation ofthe 2015 Primary Ozone NAAQS: Issues Associated with Background OzoneWhite Paper for Discussion. (2015,https://www.epa.gov/sites/production/files/2016-03/documents/whitepaper-bgo3-final.pdf.
- 58.Tang Y; Lee P; Tsidulko M; Huang HC; McQueen JT; DiMego GJ; Emmons LK; Pierce RB; Lin HM; Kang D The impact of chemical lateral boundary conditions on CMAQ predictions of tropospheric ozone over the continental United States Environ. Fluid Mech 2009, 9 (1) 43–58 DOI: 10.1007/s10652-008-9092-5 [DOI] [Google Scholar]
- 59.Schere K; Flemming J; Vautard R; Chemel C; Colette A; Hogrefe C; Bessagnet B; Meleux F; Mathur R; Roselle S Trace gas/aerosol boundary concentrations and their impacts on continental-scale AQMEII modeling domains Atmos. Environ 2012, 53, 38–50 DOI: 10.1016/j.atmosenv.2011.09.043 [DOI] [Google Scholar]
- 60.Henderson BH; Akhtar F; Pye HOT; Napelenok SL; Hutzell WT A database and tool for boundary conditions for regional air quality modeling: description and evaluation Geosci. Model Dev 2014,7, 339–360 DOI: 10.5194/gmd-7-339-2014 [DOI] [Google Scholar]
- 61.Appel KW; Napelenok SL; Foley KM; Pye HOT; Hogrefe C; Luecken DJ; Bash JO; Roselle SJ; Pleim JE; Foroutan H Overview and evaluation of the Community Multiscale Air Quality (CMAQ) model version 5.1 Geosci. Model Dev. Discuss 2016, 1 DOI: 10.5194/gmd-2016-226 [DOI] [PMC free article] [PubMed] [Google Scholar]
- 62.Sarwar G; Kang D; Foley K; Schwede D; Gantt B; Mathur R Technical note: Examining ozone deposition over seawater Atmos. Environ 2016, 141, 255–262 DOI: 10.1016/j.atmosenv.2016.06.072Huang H-Y; Hall A; Teixeira J Evaluation of the WRF PBL parameterizations for marine boundary layer clouds: Cumulus and stratocumulus Mon. Weather Rev 2013, 141, 2265–2271 DOI: [DOI] [Google Scholar]
- 63.Huang H-Y; Hall A; Teixeira J Evaluation of the WRF PBL parameterizations for marine boundary layer clouds: Cumulus and stratocumulus Mon. Weather Rev. 2013, 141, 2265–2271 DOI: 10.1175/MWR-D-12-00292.1 [DOI] [Google Scholar]
Associated Data
This section collects any data citations, data availability statements, or supplementary materials included in this article.