Abstract
Microphysiological tissue engineering models of human skeletal muscle (myobundles) provide a platform to investigate the mechanism of muscle diseases and to study the response to drugs and toxins in vitro. To examine the dynamic response to drugs, which often take several days to induce responses, we developed a system to monitor the contractile force of the same human skeletal muscle myobundles over time before and after treatment with drugs. Myobundles were formed in series with Ecoflex rubber films (platinum-catalyzed silicones) with embedded microbeads. The displacement of the microbeads in Ecoflex exhibited a linear relation between muscle force production and Ecoflex film stretch. Forces measured with the microbeads embedded in Ecoflex agreed well with simultaneous measurements with a force transducer. Application of the Hill model for the myobundles showed that the Ecoflex affected the magnitude of the response, but not the kinetics. After continuous exposure to 100 nM cerivastatin, both active and passive forces were reduced relative to controls after 2–4 days. The decline in force was associated with a decline in the muscle myofiber organization. The inhibitory effect of cerivastatin was reduced when 0.1–1 mM mevalonate was added with cerivastatin. Although addition of co-enzyme Q10 with cerivastatin inhibited degradation of sarcomeric α-actinin (SAA) in myoblasts, the contractile force still declined, suggesting that statin-induced myopathy was related to mevalonate pathway but the addition of co-enzyme Q10 was insufficient to overcome the effect of statins on the mevalonate pathway. Thus, cerivastatin rapidly induces myopathy which can be reversds with mevalonate but not co-enzyme Q10.
Introduction
Skeletal muscle accounts for 40% of the body’s mass, is the source of power for moving bone and other structures, and plays a crucial role in energy metabolism in the body1, 2. Engineered human skeletal muscle is a promising system to study muscle development, screening muscle-active drugs, and supplying tissue sources to clinical transplant3–6. Further, 3D engineered human skeletal muscle is a closer model of the native muscle tissue in vivo, and can be used to monitor contractions and calcium transients 7–10. Because animal models do not always exhibit the same response as humans, engineered human skeletal muscle myobundles may better reflect the responses of human muscle to drugs or other stimuli10–12.
Several different systems of engineered skeletal muscles that replicate normal physiological function have been developed, which exhibited both good biological and mechanical features13–18.
Four methods are used to measure contractile force in tissue engineering. One, larger engineered constructs, including skeletal muscle, are connected to force transducers10, 19. Two, force is calculated from displacement of embedded micro/nano particles in hydrogel/PDMS with cells of engineered tissue and a constitutive relation for the matrix materials and known properties of the matrix materials20–22. Three, force is determined from the displacement of a layer of muscle cells that adhere to and then form myofibers on a thin film 23, 24, or cantilevers 25. Four, myobundles form between two flexible pillars and measurement of the bending angle of the pillars yields the force from beam theory or finite element models 13, 17, 26.
While these various methods can determine force, not all of these techniques are capable of measuring the force on the same group of myobundles over time, determine twitch, tetanus, and passive force as well as relaxation and fatigue kinetics or couple with fluorescent methods to measure calcium dynamics. To satisfy these requirements and provide a system that permits improved throughput, we established an in situ force monitoring system for three-dimensional skeletal muscle myobundles arranged in series with platinum-catalyzed silicone films (Ecoflex) in which marker beads were embedded. By mapping the film displacement induced by muscle contraction and calibrating with a force transducer, the force production of the myobundle was measured. At least four muscles could be tested simultaneously under the same conditions in a single well, enabling a dose-response curve in a six well plate.
Using this platform, we investigated cerivastatin–induced myopathy. Statins are one of the most commonly used drugs in the world, and play an important role in prevention of cardiovascular diseases by blocking mevalonate pathway of cholesterol synthesis 27. About 3% to 15% of patients taking statins exhibit myopathy ranging from mild myalgia to fatal, but extremely rare, rhabdomyolysis11, 27–29. While relationships have been obtained between statin concentration and contractile force with three-dimensional human skeletal muscle myobundles10–12, the dynamics are not known. We examined the time required for the onset of myopathy in engineered human myobundles and assessed the important role of mevalonate pathway in force generation of muscle. Further, as a potential compound to block statin–induced myopathy 28–33, we examined addition of co-enzyme Q10 with statin on force production.
Experimental
Design and fabrication of the frame, Ecoflex film and mold
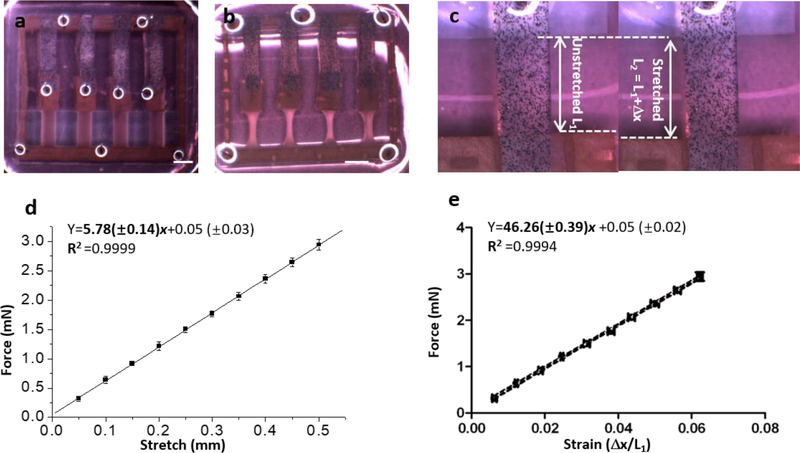
The system consisted of Ecoflex membranes (platinum-catalyzed silicones) aligned in series with myobundles and attached to nylon frames (Figs. 1 and S1). There were two designs of the mold and frame: one design was the four myobundles and Ecoflex films compacted in a same frame (20.4 × 17.6 mm outer dimensions, 18.6 × 14 mm inner dimensions), which was used in in situ force testing (Fig.1a and S1a); The other design was the single myobundle grown in a smaller frame (19 × 8 mm outer dimensions, 15 × 6.2 mm inner dimensions) connected to the Ecoflex membrane (Fig. S1b), which was used in force transducer validation testing. Microbeads were added at a final concentration of 1.25% (w/w) prior to polymerization. The polymer solution with beads was poured into a Teflon mold and covered with a glass slide, bubbles were removed and the mixture cured.
Fig. 1.
Ecoflex binding myobundle fabrication and characterization. a, Seeding the myobundle in the PDMS mold with attached Ecoflex; b, Myobundle in 6-well plate for force testing in situ., 5 days in shift media, scale bar: 3 mm. c, Ecoflex before and after stretching. d, Linear relationship between force and stretch. e, Calibration curve of strain vs. force within Ecoflex (n=3, data presented as mean ±S.D.).
HSKM cells isolation and culture
Human skeletal muscle (HSkM) samples were obtained using Duke University IRB approved protocols. Myoblasts were isolated similar to the method previously described10. HSkM cells (Duke University Hospital) were cultured in skeletal muscle growth media (GM), consisting of DMEM, 8% Fetal bovine serum, 0.4 μg/ml Dexamethasone, 10 ng/ml EGF, 50 μg/ml Fetuin, 1% antibiotic-antimycotic and fed every other day. HSkM in passage 3–5 were used for generation of myobundles.
Fabrication of human myobundles and culture
Each of four Ecoflex films was bonded on a nylon frame (Fig.1a and S1) and the other end was linked with a small piece of nylon. Then this Ecoflex bonding frame was placed into a PDMS mold treated with Pluronic F-127 and aligned with a seeding chamber in the mold. Myobundles were formed similarly to our previously published methods10. For each bundle 3 × 10⁵ cells were encapsulated in 20 μl of gel containing thrombin, fibrinogen, Matrigel and growth media. Then the gel was pipetted into the seeding chamber. After gelation, myobundles were incubated in GM containing 1.5 mg/ml 6-aminocaproic acid for 4–5 days. Frames with myobundles were removed from molds and cultured in shift media (SM), consisting of low glucose DMEM, 2% horse serum, 10nM insulin, 2 mg/ml ACA, and 1% antibiotic-antimycotic for 7 days34. Myobundles were fed every day and incubated on the rocker. Beginning on day 8, contractile forces were obtained daily for the myobundles at room temperature. The culture media was changed immediately after forces were measured and the myobundles returned to the incubator.
Force Testing
To compare force production of myobundles by the force transducer and Ecoflex membrane displacement method, a larger myobundle (50 μl with 7.5× 10⁵ cells/bundle) was cultured on a smaller frame (Fig S1b). Then the force was measured under stimulation by the transducer and Ecoflex displacement.
To electrically stimulate the muscles (20 Hz, 20 pulses, 40V/cm), a pair of electrodes connected to a stimulator was placed into the well containing frame with myobundles array (Fig. S2 a, b) and the stretch of all Ecoflex films were recorded as video through stereomicroscope. Particle image velocimetry (PIV) was performed using an ImageJ plugin (ImageJ-PIV) to quantify Ecoflex displacement.
Relation between strain and force of Ecoflex
In force testing, the Ecoflex film was stretched for 10 0.05 mm steps and the passive force of the Ecoflex film was measured at each step. At the same time, the displacement of individual microbeads in the film was recorded as video through stereomicroscope. By application of ImageJ-PIV, the primary length of the Ecoflex film (defined as L1 as shown in Fig. 1c) and the longest displacement of Ecoflex at each step was measured (defined as L2 as shown in Fig. 1c), and the strain was calculated.
Statistics
Data were analyzed using Originlab and Graphpad Prism. Results are presented as mean ± S.D.(N=3) or mean ± S.E.(N≥4). Statistical significance was determined by unpaired t-test. p < 0.05 was considered statistically significant, for N=3–6 samples (*p < 0.05, ** p < 0.01, *** p < 0.001).
Results
Ecoflex characterization
Microbeads were distributed uniformly in the Ecoflex enabling measurement of displacement versus applied force (Figs. S3a, b). Since the Ecoflex films needed to maintain consistent properties throughout growth, differentiation and testing of myobundles, we tested whether the elastic force of Ecoflex material was affected by long-term exposure to media. The force-displacement relation was not influenced by long-term incubation in media for 5 weeks (Fig. S3c). As described in Experimental, the relationship of stretch length versus passive force was linear and three different batches of Ecoflex gave similar results (Figs. S3d, e) When pooled, the curves yielded a very good fit (R2 =0.9999) (Fig. 1d). From the slope, the spring constant for the Ecoflex is 57.8±1.4 mN/cm.
The relationship between stretch length vs. strain (Δ x/L1) was also linear with R2 =0.9999 (Fig. 1d). The relation between strain and force was obtained by combining these results (Fig. 1e) and the resulting linear relation was Y (mN)=46.26(±0.39)x +0.05 (±0.02).
In situ monitoring of myobundle contraction
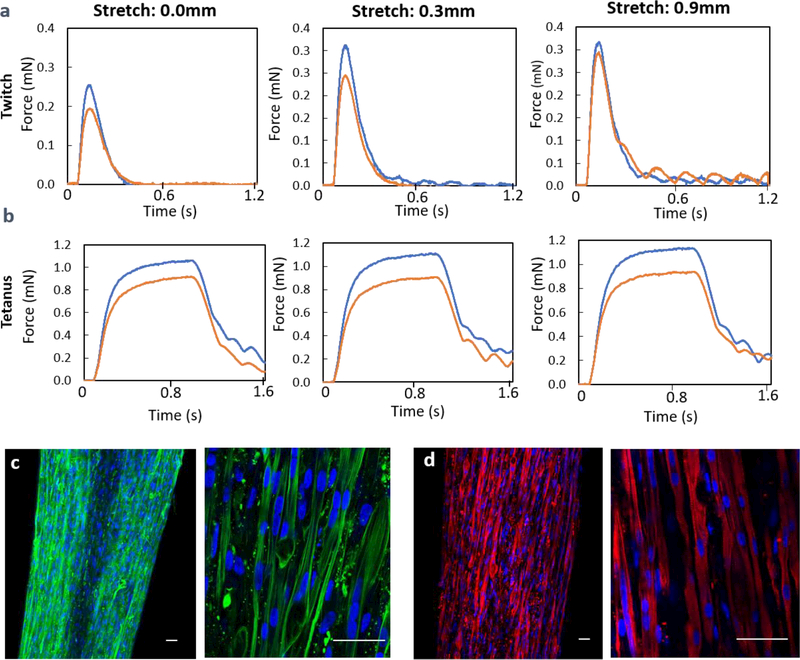
To determine whether the series linkage of the Ecoflex affected contractile force generation by myobundles, we used a force transducer to measure the contractile force of myobundles with and without bonding to an Ecoflex film at the unstretched length and stretches of 3.6% (0.3 mm) and 11% (0.9 mm). Although the twitch and tetanus force was about 20% smaller when the Ecoflex was connected in series with the skeletal myobundle than when the force was measured for the myobundle alone (Fig. 2a, b), the dynamics were similar, indicating that the Ecoflex did not exhibit viscoelasticity.
Fig. 2.
a. The influence of Ecoflex film on the twitch force generation of myobundle with (red) and without Ecoflex film (blue). b. The tetanus force generation of the same myobundle with (red) and without Ecoflex film (blue). c-d. Characterization of bio-functions of engineered muscle (day 7 in shift media). Immunofluorescence staining of myobundles with (c) F-actin (green) and DAPI(blue), (d) sarcomeric alpha actin (SAA, red), scale bar: 50μm
In these initial experiments, the Ecoflex was in series with a myobundle in a nylon frame (Fig. S1b). However, after the frame was cut to enable stretching of the myobundle to 115%−120% of its original length for maximum force production, force measurements on subsequent days deteriorated relative to bundles for which the frames were cut immediately before measurement. To prevent loss of tension, subsequent experiments were performed in which the Ecoflex was placed directly in series with the myobundles and connected to the frames (Fig. 1a).
More than 80% of the frames with four myobundles in series with Ecoflex could be fabricated reproducibly. The initial width of the myobundles attached to Ecoflex (1.36±0.02 mm, n=8) were less than the mold width (1.8 mm). After 7 days in SM, myofibers in myobundles attached to Ecoflex membranes were aligned with Ecoflex film in series (Fig. 1b) with very minor deviation relative to horizontal (1.1±0.8 degrees, n=8), which guaranteed that the muscle force was transmitted directly to the Ecoflex film.
The size of the engineered human skeletal muscles after 1 week in shift media was about 4.2 mm length × 0.6–0.7mm width (Fig. S4a), which was much thinner than the initial width due to compaction of the hydrogel. The displacement patterns at tetanus were very similar for 4 myobundles in a single frame (Fig. S4b) with the smallest displacements near the fixed end. Densely packed and aligned myofibers (F-actin) and multinucleated myofibers were observed in myobundles (Fig. 2c). The expression of sarcomeric α-actinin (SAA) cross-striations indicated the mature structure of the myofiber (Fig. 2d). Furthermore, the engineered human skeletal muscle displayed force production in response to electro-physiological stimulation (Fig 2a,b) consistent with our previous report 10 (response time≈0.1s, ≈0.3mN twitch force and 1mN tetanus force) and spontaneous twitching of myobundles was observed (Supplementary Video 2).
From a plot of the passive force versus length for the same donor used in Figure 2, the myobundle spring constant is 8.3±0.3 mN/cm, indicating that the Ecoflex is about 7 times stiffer than the myobundles.
Comparison of contractile force measured by the Ecoflex-coupling method and a force transducer
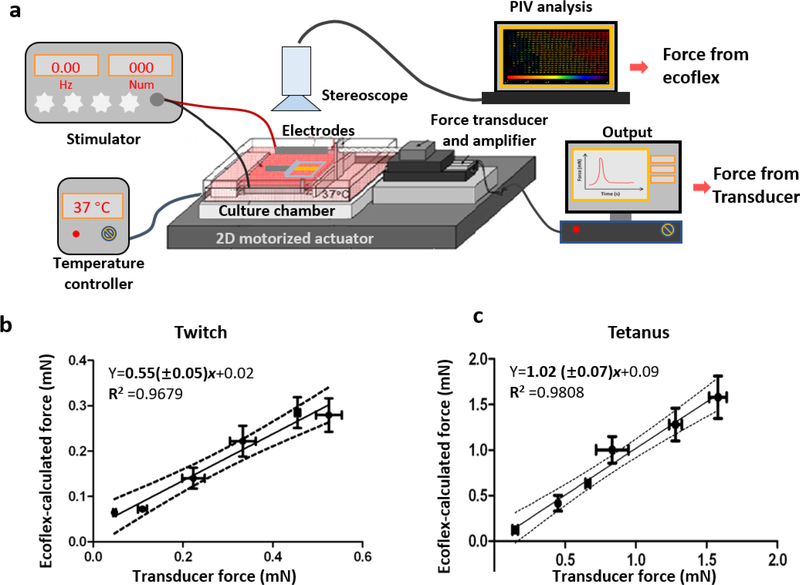
When myobundles responded to a single electrical pulse, the Ecoflex film stretched accordingly and the extent of stretch depended on the force generated by the myobundle (Supplementary Video 1). To establish whether the force determined by coupling the Ecoflex with the myobundles (“Ecoflex coupling method”) accurately measured the contractile force, we measured the twitch and tetanus force of the same myobundles by both the Ecoflex coupling method and a force transducer (Fig. 3a). To produce myobundles with a range of contractile forces, myobundles were cultured under three different conditions for 7 days in shift media. In group 1, myobundles were cultured under static conditions without rocking which produced myobundles with low contractile forces (0.02–0.05 mN twitch, 0.12–0.17 mN tetanus). In group 2, myobundle culture alternated between the rocker and static conditions every other day, which produced myobundles with moderate contractile forces (0.1–0.25 mN in twitch, 0.38–0.68 mN in tetanus). In group 3, myobundles were cultured on the rocker for the duration of the experiment, which produced myobundles with the largest contractile forces (0.3–0.65 mN in twitch, 0.7–1.65 mN in tetanus). Each myobundle was electrically stimulated at three different values of stretch (0.0mm, 0.3mm, 0.6mm). The relation between force measured with a transducer vs. force calculated from bead displacement was linear for both twitch and tetanus (Fig. 3b, c). The slopes of linear regression were 0.52±0.05 (twitch) and 1.02±0.07 (tetanus). For twitch testing, the force calculated using the Ecoflex is about half of the actual force, possibly due to the low frame rate of the camera, 12 frames/s. Since the calculated force for tetanus is not different than that produced by the force transducer, subsequent results are presented for tetanus.
Fig. 3.
Comparison of contractile force of measured by the Ecoflex-coupling method and with force of measured by a transducer. a, Schematic diagram of forcing the myobundle with two methods. b-c, The relationships of calculated force using the Ecoflex coupling method and transducer force for twitch (b) and tetanus (c). (n=3–6, data presented as mean ±S.D.)
To further establish whether the presence of the Ecoflex affected the contractile force, we used a Hill model in series with an elastic element representing the Ecoflex membrane (Fig. S5a). (Details of the model formulation and parameter estimates are in the Supplementary Materials.) The model reproduced the kinetics of the twitch force as a function of time (Fig. S5b) and tetanus. Simulations showed that adding the Ecoflex in series with the myobundle did not alter the kinetics but reduced the peak twitch force and tetanus force (Fig. S6), similar to that observed experimentally (Fig. 2a, b).
Assessment of the time course of cerivastatin–induced myopathy
The Ecoflex coupling method was applied to examine the time course of cerivastatin–induced myopathy (Fig. S7a). The in situ force measurement system was composed of a stimulator, a pair of electrodes, stereoscope and PDMS coated 6 well plate (Figs. S2 a, b). To produce a more compact system to measure the contractile force, the Ecoflex films were reduced to 9mm ×2mm×0.5mm a single frame consisted four myobundles in series with Ecoflex in a single well of a 6 well plate (Fig. S2b). In order to ensure that the Young’s modulus remained the same when the cross-sectional area was reduced by 1/3, the resulting relation between strain and force (mN) was revised to Y=30.84(±0.26)x +0.03. Passive forces generated by the myobundle over could be monitored over time by regular measurement of bed displacement.
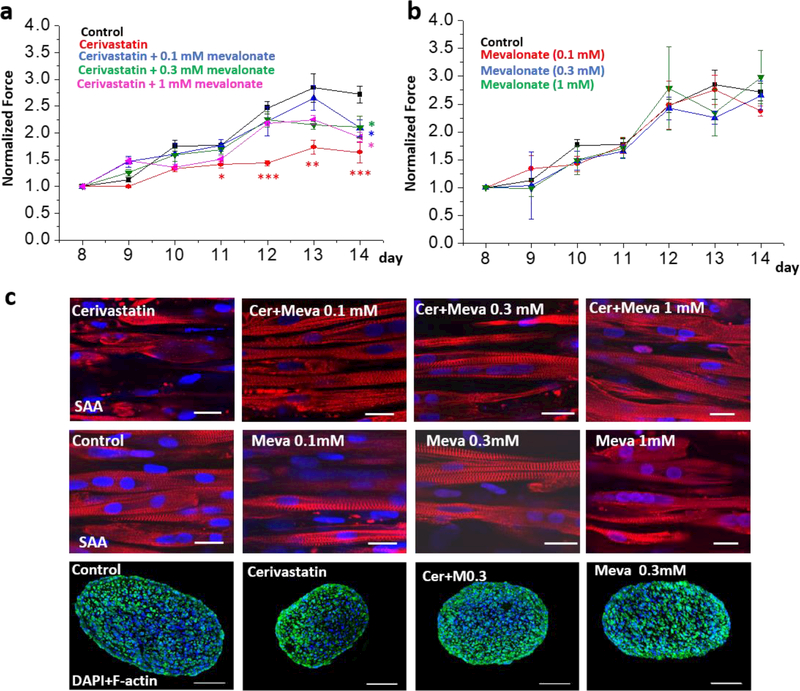
The tetanus force generation of myobundles in control group increased from day 8 to 14 after shifting (Fig. 4a), as was observed previously with bundles examined at separate time points10. In the cerivastatin-treated group, the tetanus force increased more slowly and by day 4 after addition of cerivasatin, the tetanus force was significantly less than the value for the control group (Fig. 4a). Like the active force, the passive force and the normalized specific force (active force/diameter of myobundle) increased from day 8 to 14 in control group and was significantly less in cerivastatin-treated groups from day 9 or day 12 (Fig. S7b, c). Addition of 0.1–1 mM mevalonate with the cerivastatin limited the effect of the cerivastatin for 7 days (Fig. 4a), but addition of these levels of mevalonate did not affect active force production in myobundles that did not receive cerivastatin (Fig 4b). However, higher concentrations of mevalonate (0.3–1mM) did prevent the passive force from increasing, an effect which was significant on days 13 and 14 (Fig. S7d). Throughout, the coefficient of variation (COV) of the Ecoflex coupling method was 7.1±0.2% and exhibited a significant negative correlation with days after start of measurement (Fig. S7e).
Fig. 4.
Pharmacological assessment of myobundles under treatments of cerivastatin (Cer) and mevalonate (Meva). a, the active normalized force of myobundles under treatments of cerivastatin and mevalonate (* p < 0.05; ** p<0.01 relative to control conditions); b, the active normalized force of myobundles after treatments with 0.1 mM, 0.3 mM, 1 mM mevalonate. Force were normalized to day 8. (n=4–6, data presented as mean ±S.E.). c, Immunofluorescence staining of myobundles with sarcomeric α-actinin (SAA, red), F-actin (green) and DAPI (blue), scale bar: 20 μm for SAA staining, 100 μm for cross-sections.
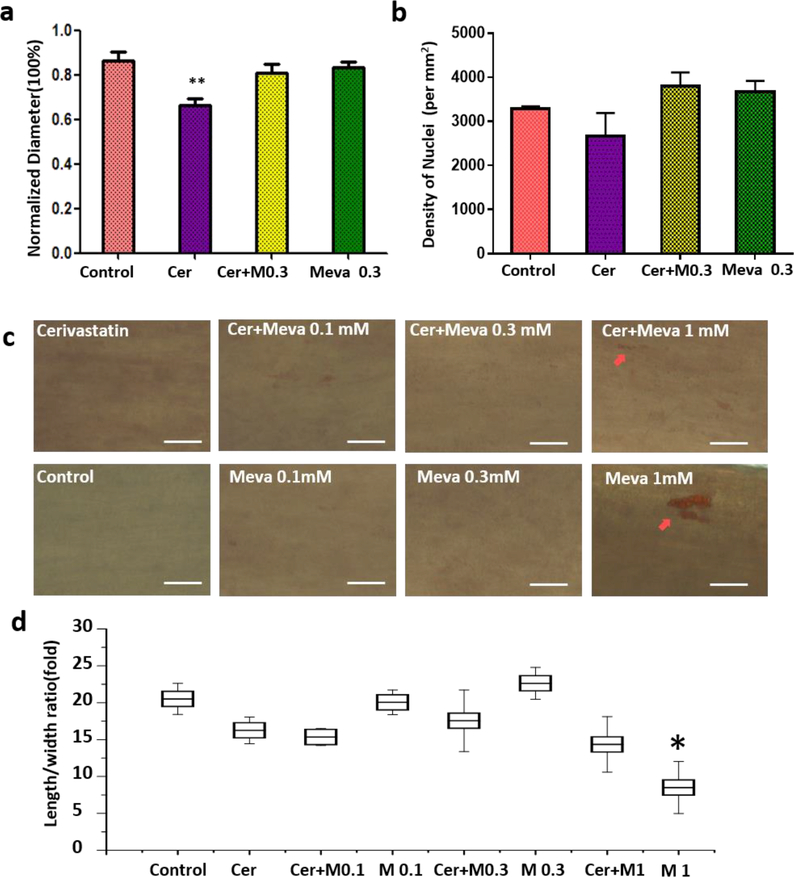
In addition to influencing the contractile force, cerivastatin treatment resulted in degradation of SAA in myofibers. In the control group, SAA cross-striations could be observed clearly in the cells. But the cross-striations of SAA in cerivastatin treated myobundles had disappeared in some cells and only the SAA fragments were observed (Fig. 4c). Treatment with cerivastatin and mevalonate prevented the breakdown of SAA (Fig. 4c). For the cerivastatin treatment group, the myobundle diameter was smaller than other groups, but the density of nuclei did not change among groups (Fig. 5a, b). The diameter change impacted the specific force for cerivastatin-treated myobundles, but there was still a significant reduction in specific force on day 12 (Fig. S7c). Addition of 0.1 mM or 0.3 mM mevalonate alone did not affect the myobundle diameter or nuclear density (Fig 5a and Fig. 5b). Addition of 1 mM mevalonate increased lipid accumulation in muscle cells as judged by Oil Red O staining (Fig. 5c) and changed the morphology of HSKM from elliptical into round (Figs. 4c and 5d). But it did not influence the presence of SAA striations in myofiber (SAA) (Fig. 4c). Overall, the 0.3 mM mevalonate seemed to be the optimal condition to block the cerivastatin –induced myopathy.
Fig 5.
Myofiber diameter (a) and nuclear density (b) with cerivastatin treatment. c, Oil-red staining of myobundles under different treatments, scale bar: 50 μm. d, calculation of length to width ratio for multinucleated cells in myobundle, (All images were taken at day 14 in shift media and under treatments for a week.)
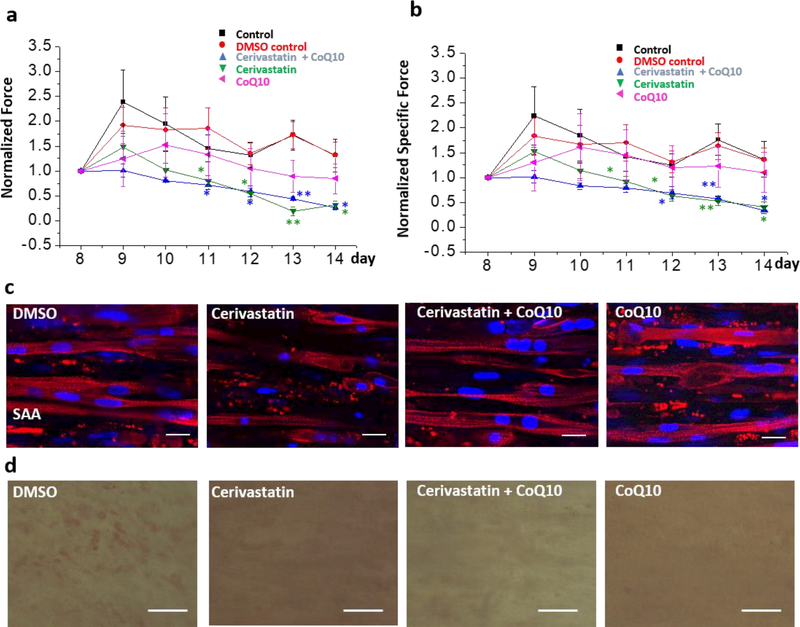
Addition of co-enzyme Q10 is reported in some studies to block statin–induced myopathy28–30, whereas other studies failed to see an effect29. We found that addition of 10 μM co-enzyme Q10 with cerivastatin did not block the decline in active (Fig. 6a) and passive force induced by cerivastatin treatment (Fig. S8a). Addition of 10 μM co-enzyme Q10 itself reduced the active force generation of myobundles, but had no effect on passive force. Furthermore, cerivastatin and co-enzyme Q10 alone and in combination induced a decrease in the myobundle diameter (Fig. S8b). To normalize the effect of diameter change, we computed the specific force (active force/cross-sectional area) for all groups (Fig. 6b). The results indicated that the decline in force in co-enzyme Q10 group resulted from the diameter change since the specific force of co-enzyme Q10 group was not statistically different than the control group. On the other hand, the specific force declined with time in cerivastatin-treated groups, which indicates dysfunction of myoblasts independent of the diameter change. However, based on the immunofluorescence results, co-enzyme Q10 addition with cerivastatin appeared to reduce the degradation of SAA observed with cerivastatin treatment (Fig. 6c). Also, co-enzyme Q10 appeared to reduce the lipid levels as identified from Oil Red O staining in muscle when compared to DMSO vehicle control (Fig. 6d).
Fig.6.
Testing whether co-enzyme Q10 (CoQ10) can block cerivastatin–induced myopathy. a, the active force and (b) the specific active force (active force/diameter of myobundle) of myobundles under treatments of cerivastatin and CoQ10 for a week. All forces were normalized to day 8. (n=4–6, data presented as mean ±S.E.) mevalonate (* p < 0.05; ** p<0.01 relative to control conditions; c, Immunofluorescence staining of myobundles with sarcomeric α-actinin (SAA, red) and DAPI (blue), scale bar: 20μm. d, Oil-red O staining of myobundles under different treatments, scale bar: 50μm.
Discussion
In this work, we developed a novel and flexible Ecoflex-coupling method to measure dynamically the active and passive forces of individually engineered human muscle bundles. The Ecoflex membrane exhibited linearly elastic behavior without hysteresis up to a stretch of 4.2%, was not affected by long-term exposure to media and is compatible with muscle cells. Because the force only depended on the strain of Ecoflex, the force production of different sizes Ecoflex films was calculated by multiplying the ratio of cross-sectional areas of differently sized Ecoflex membranes. Using stretch to determine force provides greater flexibility than other methods that rely on bending, for which the mechanical model is more complicated.
The force of myobundles measured by Ecoflex-coupling method was validated using a force transducer as the gold standard. The results demonstrated that our method was suitable to test myobundles with tetanus stimulation. However, the twitch force measured by Ecoflex-coupling method was only half of the transducer force because camera frame rate (12 frames/s) was not fast enough to capture the maximum force. As shown in Figs.2 a and b, the total force duration of twitch was about 0.3s. The peak occurred near the end of the second frame or close to the third frame after start of contraction, producing an average much less than the peak due to the rapid rise and decline of the force. To accurately capture the peak twitch force would require frame rates of about 120 frames/s. The longer duration of the tetanus force (1 s) enabled accurate measurement of the maximum force.
Application of the Hill model provided good representation of the twitch force (Fig. S5b). The model indicated that addition of the Ecoflex in series did not affect the dynamic response and only produced a small decrease in the peak force and tetanus force, thus supporting the view that the Ecoflex measurements are a reliable indicator of the contractile force. The sensitivity of Ecoflex-coupling method is at least 0.12 mN, but could be reduced further by using Ecoflex film with smaller cross-sectional area (e.g. 1mm×0.5mm) or lower stiffness, and forces smaller than 0.06 mN may be detected. Furthermore, the ImageJ-PIV software used is a semi-automated and free version, which can generate a displacement pattern map and can be widely used in some non-specialist labs. On the other hand, if the automatic and higher efficient method is needed, there are some commercial systems can be used as well, such as VIC-3D software.
Using the Ecoflex-coupling method, four myobundles in single well of a six well dish could be examined under stimulation regimen (Supplementary video 1). We can perform a dose-response curve with 4 replicates in 6-well plate, which results in a higher throughput than we obtained previously10. By tracking individual bundles over time, the error is reduced.
Several different methods have been developed to measure contractile forces of muscle cells, including the use of deformable posts, cantilevers, displacement of nanobeads or deformation of thin polymer films13, 22, 35–37. An advantage of our approach is that it can be used to determine the dynamics of passive force or active force production in response to twitch or tetanus stimuli and yields additional information about the kinetics of contractions, such as the relaxation time. The cost of this system is low, requiring only video-microscopy capability. Also, separating the muscles bundle from the testing scaffolds is advantageous for bio-analysis or transplant in the downstream experiment. We have reduced the myobundle volume by 85% and can adjust dimensions of the myobundle and Ecolfex to optimize tetanus force production. This method can be integrated on a perfusion chamber with stimulating electrodes. Then this muscle chip can be connected easily with other “organ chips”. One limitation to this method is that since the frame is pinned on the PDMS coated bottom, the PDMS material may need to be treated to minimize drug absorption38.
The Ecoflex bonding method was used to examine the evolution of cerivastatin–induced myopathy. Cerivastatin belongs to the family of statins that inhibit the enzyme HMG-CoA reductase and block the cholesterol biosynthesis pathway. While cerivastatin was effective in reducing plasma cholesterol27, severe toxicity was observed and it was removed from the market11. While in clinical trials the occurrence of reported muscle weakness and pain has been reported in statin treated and placebo groups39, we extended our previous work10 by tracking force on individual myobundles following exposure to cerivastatin. To confirm the molecular mechanism of this effect, we showed addition of mevalonate blocked the reduction of force and prevented degradation of the sarcomeric structure. However, higher concentration of mevalonate did not increase the force of muscle, and resulted in increasing of lipid accumulation in the myobundle and changed the morphology of cell into round.
Recently, it has been hypothesized that a reduced coenzyme Q10 which is a downstream production of mevalonate pathway and plays a role in energy transfer in skeletal muscle is a cause of statin-induced myopathy28, since co-enzyme Q10 could increase the ATP synthetic capacity and inhibit oxidative stress in cell40. Whether or not the circulating levels of CoQ10 could relieve myopathic symptoms is not still clear28–30. Our results demonstrated that coenzyme Q10 did not inhibit the effect of cerivastatin, thus providing a relatively rapid test for mediators of drug toxicity in human skeletal muscle. Especially, this novel platform could help to determine the onset of a drug-induced effect over time.
Conclusions
In this work, we firstly developed an “Ecoflex-coupling method” to measure the force generation of engineered muscle. This novel method was proved accurate, flexible and stable to test the muscle force within long-term culture. The response time of mechanical scaffold to force was first proposed in this work, which revealed that our method was suitable to be used in tetanus testing of muscle. The present detection limit is 0.12mN, which can be improved with Ecoflex films. Due to the series binding, the myobundle was independent from the Ecoflex, which reduced the influence of mechanical scaffold to engineered muscle if following experiments are needed. Based on the “Ecoflex-coupling method”, an in situ monitoring system with parallel myobundles array was established. Through integrating 24 myobundles in one 6-well plate and testing four of them synchronously, the throughput of testing was improved. This system was used to monitoring myobundles in situ for one week and the cerivastatin–induced myopathy was investigated. The results demonstrated that cerivastatin can induce the decline in both active forces and passive forces relative to controls after 2–4 days, which was associated with a decline in the muscle myofiber organization. This inhibitory effect of cerivastatin was reduced when 0.1–1 mM mevalonate was added with cerivastatin, that revealed the side effect of cerivastatin to skeletal muscle was also related to mevalonate pathway. Although addition of co-enzyme Q10 with cerivastatin inhibited degradation of sarcomeric a-actinin (SAA) in myoblasts, the contractile force still declined, suggesting that the inhibiting of co-enzyme Q10 synthesis in body was only one factor in this result. This novel system opens new possibilities for investigate the mechanical stresses of muscle, which has potential applications in drug screen and multi-organs integration study.
Supplementary Material
Acknowledgements
This work was supported NIH grants UH3TR000505, and the NIH Common Fund for the Microphysiological Systems Initiative and NIH grant UG3TR002142 supported by NCATS and NIAMS.
Footnotes
Conflicts of Interest
None to declare.
References
- 1.Zurlo F, Larson K, Bogardus C and Ravussin E, Journal of Clinical Investigation, 1990, 86, 1423. [DOI] [PMC free article] [PubMed] [Google Scholar]
- 2.Powell CA, Smiley BL, Mills Jand Vandenburgh HH, American Journal of Physiology-Cell Physiology, 2002, 283, C1557–C1565. [DOI] [PubMed] [Google Scholar]
- 3.Martin NR, Passey SL, Player DJ, Khodabukus A, Ferguson RA, Sharples AP, Mudera V, Baar K and Lewis MP, Biomaterials, 2013, 34, 5759–5765. [DOI] [PubMed] [Google Scholar]
- 4.Cheng CS, Davis BNJ, Madden L, Bursac N and Truskey GA, Experimental Biology and Medicine, 2014, 239, 1203–1214. [DOI] [PMC free article] [PubMed] [Google Scholar]
- 5.Truskey GA, Achneck HE, Bursac N, Chan HF, Cheng CS, Fernandez C, Hong S, Jung Y, Koves T and Kraus WE, Stem cell research & therapy, 2013, 4, S10. [DOI] [PMC free article] [PubMed] [Google Scholar]
- 6.Juhas M, Engelmayr GC, Fontanella AN, Palmer GM and Bursac N, Proceedings of the National Academy of Sciences, 2014, 111, 5508–5513. [DOI] [PMC free article] [PubMed] [Google Scholar]
- 7.Cheng CS, Ran L, Bursac N, Kraus WE and Truskey GA, Tissue engineering Part A, 2016, 22, 573–583. [DOI] [PMC free article] [PubMed] [Google Scholar]
- 8.Abraham MR, Henrikson CA, Tung L, Chang MG, Aon M, Xue T, Li RA, O’Rourke B and Marbán E, Circulation research, 2005, 97, 159–167. [DOI] [PubMed] [Google Scholar]
- 9.Guo X, Gonzalez M, Stancescu M, Vandenburgh HH and Hickman JJ, Biomaterials, 2011, 32, 9602–9611. [DOI] [PMC free article] [PubMed] [Google Scholar]
- 10.Madden L, Juhas M, Kraus WE, Truskey GA and Bursac N, Elife, 2015, 4, e04885. [DOI] [PMC free article] [PubMed] [Google Scholar]
- 11.Osaki Y, Nakagawa Y, Miyahara S, Iwasaki H, Ishii A, Matsuzaka T, Kobayashi K, Yatoh S, Takahashi A, Yahagi N, Suzuki H, Sone H, Ohashi K, Ishibashi S, Yamada N and Shimano H, Biochemical and Biophysical Research Communications, 2015, 466, 536–540. [DOI] [PubMed] [Google Scholar]
- 12.Esch MB, King TL and Shuler ML, Annual Review of Biomedical Engineering, 2011, 13, 55–72. [DOI] [PubMed] [Google Scholar]
- 13.Sakar MS, Neal D, Boudou T, Borochin MA, Li Y, Weiss R, Kamm RD, Chen CS and Asada HH, Lab on a Chip, 2012, 12, 4976. [DOI] [PMC free article] [PubMed] [Google Scholar]
- 14.Moon DG, Christ G, Stitzel JD, Atala A and Yoo JJ, Tissue Engineering Part A, 2008, 14, 473–482. [DOI] [PubMed] [Google Scholar]
- 15.Khodabukus A and Baar K, Cells Tissues Organs, 2016, 202, 159–168. [DOI] [PubMed] [Google Scholar]
- 16.Neal D, Sakar MS, Ong L-LS and Harry Asada H, Lab on a Chip, 2014, 14, 1907. [DOI] [PubMed] [Google Scholar]
- 17.Cvetkovic C, Raman R, Chan V, Williams BJ, Tolish M, Bajaj P, Sakar MS, Asada HH, Saif MTA and Bashir R, Proceedings of the National Academy of Sciences, 2014, 111, 10125–10130. [DOI] [PMC free article] [PubMed] [Google Scholar]
- 18.Guo X, Greene K, Akanda N, Smith AST, Stancescu M, Lambert S, Vandenburgh H and Hickman JJ, Biomater. Sci, 2014, 2, 131–138. [DOI] [PMC free article] [PubMed] [Google Scholar]
- 19.Zhang D, Shadrin IY, Lam J, Xian H-Q, Snodgrass HR and Bursac N, Biomaterials, 2013, 34, 5813–5820. [DOI] [PMC free article] [PubMed] [Google Scholar]
- 20.Jones CAR, Cibula M, Feng J, Krnacik EA, McIntyre DH, Levine H and Sun B, Proceedings of the National Academy of Sciences, 2015, 112, E5117–E5122. [DOI] [PMC free article] [PubMed] [Google Scholar]
- 21.Hall MS, Alisafaei F, Ban E, Feng X, Hui C-Y, Shenoy VB and Wu M, Proceedings of the National Academy of Sciences, 2016, 113, 14043–14048. [DOI] [PMC free article] [PubMed] [Google Scholar]
- 22.Schaefer JA and Tranquillo RT, Tissue Engineering Part C: Methods, 2015, 22, 76–83. [DOI] [PMC free article] [PubMed] [Google Scholar]
- 23.Nesmith AP, Agarwal A, McCain ML and Parker KK, Lab Chip, 2014, 14, 3925–3936. [DOI] [PMC free article] [PubMed] [Google Scholar]
- 24.Nesmith AP, Wagner MA, Pasqualini FS, O’Connor BB, Pincus MJ, August PR and Parker KK, The Journal of Cell Biology, 2016, 215, 47–56. [DOI] [PMC free article] [PubMed] [Google Scholar]
- 25.Smith A, Long C, Pirozzi K, Najjar S, McAleer C, Vandenburgh H and Hickman J, Journal of biotechnology, 2014, 185, 15–18. [DOI] [PMC free article] [PubMed] [Google Scholar]
- 26.Raman R, Cvetkovic C, Uzel SGM, Platt RJ, Sengupta P, Kamm RD and Bashir R, Proceedings of the National Academy of Sciences, 2016, 113, 3497–3502. [DOI] [PMC free article] [PubMed] [Google Scholar]
- 27.Feingold KR, Atherosclerosis, 2015, 239, 85–86. [DOI] [PubMed] [Google Scholar]
- 28.Marcoff L and Thompson PD, Journal of the American College of Cardiology, 2007, 49, 2231–2237. [DOI] [PubMed] [Google Scholar]
- 29.Banach M, Serban C, Sahebkar A, Ursoniu S, Rysz J, Muntner P, Toth PP, Jones SR, Rizzo M, Glasser SP, Lip GYH, Dragan S and Mikhailidis DP, Mayo Clinic Proceedings, 2015, 90, 24–34. [DOI] [PubMed] [Google Scholar]
- 30.Fedacko J, Pella D, Fedackova P, Hänninen O, Tuomainen P, Jarcuska P, Lopuchovsky T, Jedlickova L, Merkovska L and Littarru GP, Canadian journal of physiology and pharmacology, 2012, 91, 165–170. [DOI] [PubMed] [Google Scholar]
- 31.Taylor BA, Lorson L, White CM and Thompson PD, Atherosclerosis, 2015, 238, 329–335. [DOI] [PMC free article] [PubMed] [Google Scholar]
- 32.Parker BA, Gregory SM, Lorson L, Polk D, White CM and Thompson PD, Journal of Clinical Lipidology, 2013, 7, 187–193. [DOI] [PMC free article] [PubMed] [Google Scholar]
- 33.Fragaki K, Chaussenot A, Benoist J-F, Ait-El-Mkadem S, Bannwarth S, Rouzier C, Cochaud C and Paquis-Flucklinger V, Biological Research, 2016, 49. [DOI] [PMC free article] [PubMed] [Google Scholar]
- 34.Jackman CP, Carlson AL and Bursac N, Biomaterials, 2016, 111, 66–79. [DOI] [PMC free article] [PubMed] [Google Scholar]
- 35.Legant WR, Pathak A, Yang MT, Deshpande VS, McMeeking RM and Chen CS, Proceedings of the National Academy of Sciences, 2009, 106, 10097–10102. [DOI] [PMC free article] [PubMed] [Google Scholar]
- 36.Wilson K, Das M, Wahl KJ, Colton RJ and Hickman J, PloS one, 2010, 5, e11042. [DOI] [PMC free article] [PubMed] [Google Scholar]
- 37.Alford PW, Feinberg AW, Sheehy SP and Parker KK, Biomaterials, 2010, 31, 3613–3621. [DOI] [PMC free article] [PubMed] [Google Scholar]
- 38.van Meer BJ, de Vries H, Firth KSA, van Weerd J, Tertoolen LGJ, Karperien HBJ, Jonkheijm P, Denning C, IJzerman AP, Mummery CL, Biochemical and Biophysical Research Communications, 2017. 482(2), 323–328. [DOI] [PMC free article] [PubMed] [Google Scholar]
- 39.Ganga HV, Slim HB and Thompson PD, American Heart Journal, 2014, 168, 6–15. [DOI] [PubMed] [Google Scholar]
- 40.Noh YH, Kim KY, Shim MS, Choi SH, Choi S, Ellisman MH, Weinreb RN, Perkins GA and Ju WK, Cell Death & Disease, 2013, 4, e820. [DOI] [PMC free article] [PubMed] [Google Scholar]
Associated Data
This section collects any data citations, data availability statements, or supplementary materials included in this article.


