

Abstract
Study Design
Retrospective image-based analysis
Objective
To measure endplate three-dimensional (3D) geometry, endplate changes in vivo and to investigate correlations between disc degeneration and endplate 3D geometry dependent on symptoms of low back pain (LBP).
Summary of Background Data
It has been hypothesized that alteration of load transmission from the nucleus pulposus (NP) to the annulus fibrosus (AF) affects vertebral endplate geometry.
Methods
3D surface models of inferior/superior lumbar endplates were created from computed tomography (CT) scans of n=92 volunteers with and without LBP. Disc degeneration was evaluated using Pfirrmann’s scale. Concavity in both coronal and sagittal planes was assessed with the Concavity Index (unitless; larger than 1: concave; flat: 1; and less than 1: convex, respectively). Endplate area and disc height distribution were computed and the effects from demographics and spinal degeneration were sought with an ANOVA model.
Results
Both sagittal and coronal planes revealed significantly decreased concavity in those with terminal Grade 5 disc degeneration (mean 0.833 ± 0.235) compared to the other grades in the cohort. Older subjects presented with larger endplate areas than the younger subjects (p = 0.0148) at L4-S1. Overall, symptomatic subjects had significantly larger endplate areas (p = 0.022), especially at the lower lumbar levels (p < 0.001). ANOVA showed that gender, disc level, disc degeneration grade and disc height reached significance (p < 0.0001) as influential parameters in both Concavity Index cases.
Conclusions
With advancing intervertebral disc degeneration, endplates become more convex over time in both sagittal and coronal planes. Our findings implicate the endplate changes with advancing disc degeneration in the shift in load transmission from the NP to the AF, resulting in changes within the curvature of the endplates. This is also the first study to describe the direct impact of age, gender, and low back pain on vertebral endplate anatomy.
Keywords: Vertebral Endplate, Concavity, Disc Degeneration, Low-Back Pain, Endplate Area, 3D Models, Disc Height Distribution, CT-based models, Point Cloud Data
Introduction
Low back pain (LBP) continues to represent one of the most common presentations when seeking medical care, with approximately 80% of the population experiencing LBP sometime during their lifetime.1–3 Lumbar disc disease has been described as the most common etiology of persistent sciatica and LBP.4 Investigating biomechanical factors of the intervertebral disc in patients with or without degenerative disc disease is essential in understanding this pathology, and the subsequent evaluation and treatment.
The load applied to the vertebral body is distributed evenly to the annulus fibrosus through hydrostatic pressure generated in the nucleus pulposus.5 The literature has clearly shown that disc degeneration (DD) affects the multidirectional flexibility of the spine, at the level of the biomechanical behavior of each motion segment.6,7 It has been hypothesized that DD alters load transmission to the endplates; as the load transmission shifts from the nucleus pulposus (NP) to the annulus fibrosus (AF).5 Thereby, the alteration of this load may ultimately affect the geometry of the adjacent endplates. However, no studies have specifically evaluated the effect of DD on the endplate geometry.
The measurements of endplate surfaces in healthy individuals are critical to provide baseline information on the estimation of stress in intervertebral discs, approximation of disc volume, and determination of spinal implant size parameters. Due to the complex endplate geometry, three-dimensional (3D) models are necessary for accurate assessment of endplate dimensions.
In order to address the current limitations in literature, the purpose of this study is to evaluate the 3D endplate geometry in vivo (in a cohort that includes both subjects symptomatic and asymptomatic for LBP and with varying degrees of DD) and investigate the possible correlation between the 3D endplate geometry and intervertebral DD. Secondarily, we sought to identify changes in endplate anatomy with differences in gender, presentation of symptoms, and across all lumbar levels. We hypothesize that the endplate geometry is altered by the progression of DD, gender, age, and presence of LBP symptoms.
Materials and Methods
Subject Selection
A total of 105 volunteers participated in this study (IRB approved) and each subject signed an approved informed consent form. The subjects were recruited using an IRB-approved flyer at the author’s institution and consisted of staff, students, and general populace. Both asymptomatic individuals and patients with LBP (with or without known DD) were recruited. The inclusion criteria for the subjects with LBP includes recurrent pain in the low back with at least two episodes of at least 6 weeks brought on by modest physical exertion. Exclusions to the study comprised: prior spine surgery for back pain, contraindications to computed tomography (CT) or magnetic resonance imaging (MRI), litigation or compensation proceedings, destructive process involving the spine, claustrophobia, a congenital spine defect and pregnancy in females. Thirteen subjects were excluded from this study due to spondylolisthesis, spondylolysis, and lumbosacral transitional vertebrae. In consequence, a total of 92 subjects were used for the analyses.
Imaging Studies
Each subject underwent CT imaging (Volume Zoom, Siemens, Malvern, PA, tube voltage: 120 kV, tube current: 100mAs, field of view: approximately 200 mm, image matrix: 512×512, slice increment: 1.0 mm, slice thickness: 1.0 mm) in a supine position. The CT data were post-processed (Mimics, Materialise Corp., Leuven, Belgium) to obtain point cloud 3D models of the lumbar spine (L1-S1).
Each subject also underwent MR imaging of lumbar spine in supine position. A 1.5-T MR unit (Signa, GE Medical Systems) was used to obtain 3.0 mm thick axial (proton density) and sagittal (T2-weighted) images. The T2-weighted sagittal MR images were used to evaluate the spectrum of DD based on Pfirrmann’s criteria where Grade 1 is normal and Grade 5 represents advanced DD.8
Disc Height Distribution
The reconstructed 3D CT vertebral models were transformed into surface point cloud models. The endplates were subsequently isolated and each endplate surface contained approximately 3,000 points. The least distance from an individual point on the inferior endplate to a point on the corresponding superior endplate was defined as the “height” at that point (Figure 1). From the distribution of these distances, the mean height of each disc was calculated.
Figure 1.
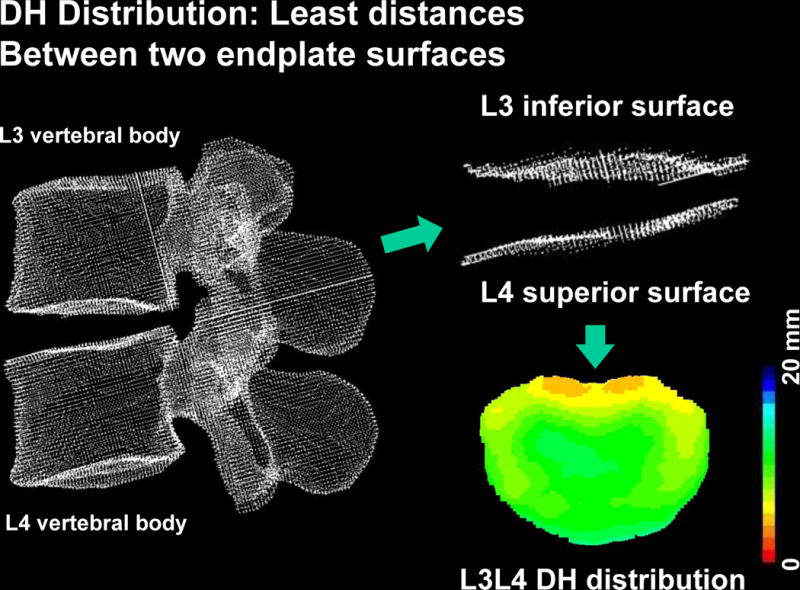
Representative data set for a L3/L4 motion segment where the least-distance algorithm performed a search across the entire surface to obtain the disc height distribution. The mean height of each disc was calculated from this data.
Endplate Area and Coordinate System
The area of each polygon was computed by calculating the cross product of the two vectors. As such, a normal vector of the polygon was obtained simultaneously by vectorial cross product. The procedures of triangulation, and area measurement were completed using a custom-made software program (Microsoft Visual C++ 2003 under Microsoft Foundation Class programming environment). The area of the entire endplate surface was calculated by summating the area of the polygons throughout the joint surface.
A local coordinate system was created to establish a mapping system on the endplate (Figure 2). A normal vector was calculated for each mesh element and a mean normal vector of all normal vectors was calculated through the entire endplate surface.9 The mean normal vector was defined as one of the coordinate system axes. This axis and the CT coordinate system pointing towards the posterior direction formed a plane. The second coordinate was determined by the normal vector of this plane and directed towards the left lateral direction. The third coordinate was determined by the cross product between the first and the second vectors.
Figure 2.

Diagram showing the local coordinate system used as a mapping system on the endplate. The origin of the diagonal lines is the centroid of the endplate and the diagonals were set at 45° from the mid-coronal plane. Radial distances cutoff was set at 60% to define the Anterior (A, cyan), Posterior (P, green), Left-lateral (L-Lat, yellow), and Right-lateral (R-lat, red) zones.
Endplate Concavity and Determination of Topographic Zones
We divided the endplate into five topographic zones, which consisted of the central, anterior, posterior, and 2 lateral zones were determined in 3D space (Figure 3). Cartesian coordinates for each point-cloud data point were converted to a spherical coordinate system with the origin set at each endplate surface model’s area center. The central zone margin was defined so that its shape is concentric to the outer margin of the endplate surface with a radius 60% of the radius of the outer margin. Proportions were similar to experimental measurements reported by O’Connell et al.10 The peripheral area, outside of the central zone, was divided into four zones defined by an angular parameter in the spherical coordinate of each point (posterior zone; ±45°, lateral zone; 45°-135°, anterior zone; 135°-225°, lateral zone; 225°-315°) from the posterior axis. These angles represent projected angles on a plane perpendicular to the mean normal vector of the endplate surface.
Figure 3.
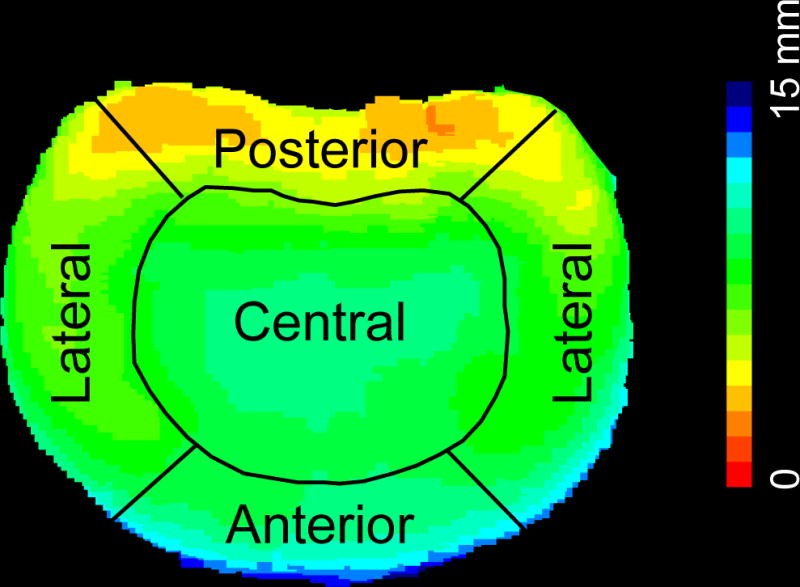
Using the convention from Fig. 2, the endplate was divided into five topographic zones. This is a representative image showing the disc height distribution with the colormap scale bar in mm.
Definition of Concavity Parameters
To assess and describe endplate concavity and convexity, we defined the unitless Concavity Index in three variations: a) Coronal concavity was defined as a ratio determined by central zone height divided by the average of the lateral zones. b) The sagittal concavity was defined as a ratio determined by the central zone height divided by the average of anterior and posterior zones, and c) following the same concept, the Overall Concavity index was defined as the ratio of the central zone to the average of the outer peripheral zones. A reference value of 1 was assigned to a flat surface. Thus, a value of greater than 1 described a concave geometry and a value less than 1 described the opposite case of convex geometry.
Statistical Analyses
Statistical analyses were conducted using SPSS Statistics v. 23 (IBM, Armonk, NY). Descriptive statistics were calculated for the participants, and the outcomes (Sagittal and Coronal Convexity Indexes) were examined for deviations from a normal distribution, with no deviations found. Confidence intervals were computed for both the Coronal and Sagittal Concavity Indexes. Bivariate relationships were examined and then these predictors were entered into a simple Analysis of Variance with the two continuous predictors (mean disc height and endplate area) included as covariates. Simple main effects were examined.
Results
In total, n = 92 volunteers participated in this study and underwent all previously described imaging studies. The average age was 37.7 ± 9.8 years old, and 54.3% were male. From this cohort, when considering symptoms and gender, the resulting sub-groups are as follows: asymptomatic males, n = 33; asymptomatic females, n = 26; symptomatic males, n = 17, and symptomatic females, n = 16, respectively (also see Tables 1 and 2).
Table 1.
Summary of the impact of Pfirrmann grade and symptomatic presentation on endplate concavity
| n | % Female | CONCAVITY INDEX1 | ||||||
|---|---|---|---|---|---|---|---|---|
| Sagittal | Coronal | Overall | ||||||
| Mean ± SD | p-value | Mean ± SD | p-value | Mean ± SD | p-value | |||
| Pfirrmann Grade 1 Asymptomatic | 3 | 66.7 | 1.12 ± 0.10 | – | 1.02± 0.12 | – | 1.05 ± 0.09 | – |
| Pfirrmann Grade 1 Symptomatic2 | – | – | – | – | – | – | – | – |
| Pfirrmann Grade 2 Asymptomatic | 42 | 50.0 | 1.13 ± 0.13 | 0.323 | 1.09 ± 0.15 | 1.11 ± 0.11 | 0.949 | |
| Pfirrmann Grade 2 Symptomatic | 10 | 60.0 | 1.27 ± 0.14 | 1.13 ± 0.16 | 0.881 | 1.18 ± 0.13 | ||
| Pfirrmann Grade 3 Asymptomatic | 50 | 42.0 | 1.12 ± 0.14 | 0.983 | 1.13 ± 0.15 | 0.852 | 1.12 ± 0.11 | 0.871 |
| Pfirrmann Grade 3 Symptomatic | 31 | 51.6 | 1.12 ± 0.15 | 1.08 ± 0.18 | 1.10 ± 0.12 | |||
| Pfirrmann Grade 4 Asymptomatic | 27 | 40.7 | 1.05 ± 0.29 | 0.894 | 1.25 ± 0.46 | 0.609 | 1.13 ± 0.35 | 0.822 |
| Pfirrmann Grade 4 Symptomatic | 27 | 44.4 | 1.05 ± 0.17 | 1.12 ± 0.19 | 1.08 ± 0.15 | |||
| Pfirrmann Grade 5 Asymptomatic2 | – | – | – | – | – | – | – | – |
| Pfirrmann Grade 5 Symptomatic | 8 | 37.5 | 0.79 ± 0.22 | – | 0.88 ± 0.30 | – | 0.83 ± 0.23 | – |
Notes:
Concavity Index: A value of 1 represents a flat surface. Thus, a value greater than 1 described a concave geometry and a value less than 1 described a convex geometry.
There were neither symptomatic Pfirrmann Grade 1 subjects nor asymptomatic Pfirrmann Grade 5 subjects.
Table 2.
Summary of the impact of age, gender, and symptomatic presentation on endplate concavity
| Parameter or Interaction | Parameter Level | n | % Female | CONCAVITY INDEX1 | |||||
|---|---|---|---|---|---|---|---|---|---|
| Sagittal | Coronal | Overall | |||||||
| Mean ± SD | p-value | Mean ± SD | p-value | Mean ± SD | p-value | ||||
| Spinal Level | L1/2 | 92 | 45.7 | 1.18 ± 0.17 | 0.977 | 1.02 ± 0.13 | 0.863 | 1.09 ± 0.14 | 0.943 |
| L2/3 | 92 | 44.8 | 1.17 ± 0.14 | 0.971 | 1.05 ± 0.11 | 0.839 | 1.10 ± 0.11 | 0.927 | |
| L3/4 | 92 | 45.7 | 1.11 ± 0.11 | 0.578 | 1.06 ± 0.10 | 0.858 | 1.09 ± 0.10 | 0.867 | |
| L4/5 | 92 | 44.8 | 1.05 ± 0.13 | 0.563 | 1.13 ± 0.15 | 0.691 | 1.08 ± 0.13 | 0.937 | |
| L5/S1 | 92 | 44.8 | 1.00 ± 0.19 | 0.908 | 1.29 ± 0.25 | 0.659 | 1.15 ± 0.29 | 0.819 | |
|
| |||||||||
| Age Group | Younger2 | 55 | 43.6 | 1.11 ± 0.15 | 0.960 | 1.12 ± 0.19 | 0.570 | 1.11 ± 0.14 | 0.926 |
| Older3 | 37 | 48.6 | 1.10 ± 0.21 | 1.10 ± 0.26 | 1.09 ± 0.21 | ||||
|
| |||||||||
| Age Group × Spinal Location | Younger Upper LS4 | 55 | 47.2 | 1.14 ± 0.15 | 0.403 | 1.04 ± 0.12 | 0.409 | 1.09 ± 0.12 | 0.816 |
| Younger Lower LS | 1.05± 0.14 | 1.25 ± 0.21 | 1.14 ± 0.15 | ||||||
| Older Upper LS | 37 | 40.5 | 1.16 ± 0.14 | 0.514 | 1.05 ± 0.11 | 0.738 | 1.10 ± 0.11 | 0.871 | |
| Older Lower LS | 1.00 ± 0.26 | 1.19 ± 0.38 | 1.08 ± 0.30 | ||||||
|
| |||||||||
| Symptoms | Symptomatic | 59 | 44.1 | 1.08 ± 0.19 | 0.878 | 1.09 ± 0.20 | 0.957 | 1.07 ± 0.16 | 0.830 |
| Asymptomatic | 33 | 48.5 | 1.11 ± 0.17 | 1.13 ± 0.23 | 1.12 ± 0.17 | ||||
|
| |||||||||
| Age Group × Symptoms | Younger Asymptomatic | 37 | 45.9 | 1.10 ± 0.15 | 0.891 | 1.12 ± 0.19 | 0.928 | 1.11 ± 0.14 | 0.899 |
| Younger Symptomatic | 18 | 38.9 | 1.12 ± 0.16 | 1.12 ± 0.19 | 1.11 ± 0.13 | ||||
| Older Asymptomatic | 22 | 40.9 | 1.14 ± 0.20 | 0.656 | 1.15 ± 0.29 | 0.594 | 1.13 ± 0.21 | 0.565 | |
| Older Symptomatic | 15 | 66.7 | 1.04 ± 0.21 | 1.04 ± 0.21 | 1.03 ± 0.18 | ||||
| Spinal Location × Symptoms | Upper L Asymptomatic | 59 | 44.1 | 1.15 ± 0.13 | 0.714 | 1.05 ± 0.11 | 0.952 | 1.09 ± 0.11 | 0.994 |
| Upper L Symptomatic | 33 | 48.5 | 1.16 ± 0.15 | 1.04 ± 0.13 | 1.09 ± 0.13 | ||||
| Lower LS Asymptomatic | 59 | 44.1 | 1.06 ± 0.20 | 0.623 | 1.26 ± 0.30 | 0.749 | 1.15 ± 0.23 | 0.659 | |
| Lower LS Symptomatic | 33 | 48.5 | 0.97 ± 0.18 | 1.16 ± 0.26 | 1.05 ± 0.19 | ||||
|
| |||||||||
| Gender | Male | 50 | – | 1.11 ± 0.19 | 0.973 | 1.12 ± 0.25 | 0.955 | 1.11 ± 0.20 | 0.950 |
| Female | 42 | 100 | 1.10 ± 0.15 | 1.10 ± 0.18 | 1.09 ± 0.13 | ||||
|
| |||||||||
| Gender × Symptoms | Male Asymptomatic | 33 | – | 1.13 ± 0.19 | 0.694 | 1.16 ± 0.27 | 0.749 | 1.14 ± 0.20 | 0.659 |
| Male Symptomatic | 17 | – | 1.06 ± 0.19 | 1.06 ± 0.21 | 1.05 ± 0.17 | ||||
| Female Asymptomatic | 26 | 100 | 1.09 ± 0.13 | 0.911 | 1.10 ± 0.18 | 0.970 | 1.09 ± 0.11 | 0.951 | |
| Female Symptomatic | 16 | 100 | 1.11 ± 0.19 | 1.11 ± 0.19 | 1.10 ± 0.15 | ||||
Notes:
Concavity Index: A value of 1 represents a flat surface. Thus, a value greater than1 described a concave geometry and a value less than 1 described a convex one.
Younger: ages 20-39
Older: ages 40-59.
LS: Lumbar Spine.
Concavity Index
Sagittal plane endplate concavity index values were significantly lower in individuals with DD Grade 5 (mean 0.88 ± 0.29, p = 0.045) when compared to those with DD Grades 1-4 (Table 1), and in fact were convex in shape overall (Figure 4A–C). Similar findings were observed in the coronal plane concavity index values with significantly lower concavity levels in the subjects with advanced DD (Grade 5) [0.805 ± 0.211, p=0.042] compared to those with less severe DD findings on MRI (Grades 1-4). While Sagittal and Overall Concavity Indexes decreased in general with increasing DD grade, the Coronal Concavity Index showed no differences from Grade 1 to 4, with a more abrupt decrease in Grade 5. There were no significant differences in the concavity index between symptomatic and asymptomatic subjects within the same Pfirrmann’s Grade (Table 1). The Concavity Index values showed low dispersion around the mean, as shown by the confidence intervals computed for both, a pattern that held even when the data was split by gender, symptoms, disc level and DD grade, as shown in Table 3. The ANOVA model showed that gender, disc level, DD grade and disc height reached significance (p < 0.0001) as influential parameters in both Concavity Index cases.
Figure 4.
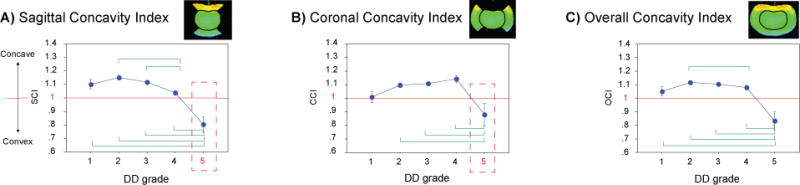
Concavity index with disc degeneration based on Pfirrmann Grades. A value of 1 was designated to imply a flat surface. Thus, a value larger than 1 described a concave geometry and a value less than 1 described a convex geometry. The sagittal (A) and coronal (B) endplate geometry was found to become significantly concave in Pfirmann Grade 5 discs compared to those with the other Grades of disc degeneration. The sagittal and coronal plane measurements were combined, revealing similar patterns to those of the sagittal and coronal planes (C). The green lines depict significant differences (P< 0.05) between groups. Abbrevations: SCI, Sagittal Concavity Index; CCI, Coronal Concavity Index, and OCI, Overall Concavity Index, respectively.
Table 3.
Confidence Intervals for both Concavity Indexes
| Coronal Concavity Index
|
Sagittal Concavity Index
|
||||||
|---|---|---|---|---|---|---|---|
| Covariate | Levels | UCL | LCL | Covariate | Levels | UCL | LCL |
| Symptoms | N | 1.16 | 1.11 | Symptoms | N | 1.13 | 1.10 |
| S | 1.12 | 1.05 | S | 1.11 | 1.05 | ||
| Levels | UCL | LCL | Levels | UCL | LCL | ||
|
|
|
||||||
| Gender | F | 1.13 | 1.08 | Gender | F | 1.12 | 1.08 |
| M | 1.16 | 1.09 | M | 1.13 | 1.08 | ||
| Levels | UCL | LCL | Levels | UCL | LCL | ||
|
|
|
||||||
| Disc Level | L1/L2 | 1.05 | 0.99 | Disc Level | L1/L2 | 1.21 | 1.14 |
| L2/L3 | 1.07 | 1.02 | L2/L3 | 1.20 | 1.14 | ||
| L3/L4 | 1.08 | 1.04 | L3/L4 | 1.14 | 1.09 | ||
| L4/L5 | 1.15 | 1.09 | L4/L5 | 1.07 | 1.02 | ||
| L5/S1 | 1.40 | 1.25 | L5/S1 | 1.07 | 0.97 | ||
| Levels | UCL | LCL | Levels | UCL | LCL | ||
|
|
|
||||||
| Disc Degeneration Grade | 1 | 1.08 | 0.93 | Disc Degeneration Grade | 1 | 1.17 | 1.03 |
| 2 | 1.12 | 1.07 | 2 | 1.17 | 1.12 | ||
| 3 | 1.14 | 1.09 | 3 | 1.14 | 1.10 | ||
| 4 | 1.24 | 1.11 | 4 | 1.10 | 1.01 | ||
| 5 | 1.04 | 0.72 | 5 | 0.92 | 0.69 | ||
Note: 95% Confidence intervals are labeled as UCL: Upper Control Limit and LCL: Lower Control Limit, respectively.
The results of correlation analyses showed a negative correlation between the mean disc height and the disc grade (correlation coefficient r = -0.229, p ≤ 0.0001). Negative significant correlations were found between the disc grade and the Sagittal Concavity Index except subgroups of asymptomatic young females and asymptomatic older males (Table 4). In these subgroups, positive correlations were found between the disc grade and the Coronal Concavity Index. Positive correlation was found between the disc height and the Sagittal Concavity Index in the symptomatic older subjects but only male subjects reached significance. Negative correlations were found between the disc height and both concavity indexes in asymptomatic male subjects with younger and older ages (Table 4).
Table 4.
Correlations between Disc Height/Disc Degeneration Grade and Concavity Indexes subdivided by age group, gender and symptoms
| Parameter/Sub-groups | Correlation Coefficients, r | |||||
|---|---|---|---|---|---|---|
|
| ||||||
| Gender | Age Group | Symptoms | Disc Height and Coronal Concavity | Disc Height and Sagittal Concavity | Disc Grade and Coronal Concavity | Disc Grade and Sagittal Concavity |
| F | 20-30s | N | −0.156 | −0.325 | 0.305 | −0.125 |
| 20-30s | S | 0.059 | −0.283 | 0.160 | −0.489 | |
| 40-50s | N | −0.105 | −0.001 | 0.091 | −0.396 | |
| 40-50s | S | 0.104 | 0.261 | −0.103 | −0.375 | |
|
| ||||||
| M | 20-30s | N | −0.353 | −0.250 | 0.173 | −0.262 |
| 20-30s | S | −0.075 | 0.050 | −0.008 | −0.513 | |
| 40-50s | N | −0.575 | −0.512 | 0.304 | −0.081 | |
| 40-50s | S | 0.177 | 0.565 | −0.218 | −0.449 | |
|
| ||||||
| Age group | 20-30s | −0.189 | −0.206 | 0.137 | −0.261 | |
| 40-50s | −0.184 | 0.014 | −0.008 | −0.342 | ||
|
| ||||||
| Gender | F | −0.071 | −0.052 | 0.066 | −0.288 | |
| M | −0.247 | −0.112 | 0.032 | −0.306 | ||
|
| ||||||
| Symptoms | N | −0.345 | −0.313 | 0.224 | −0.142 | |
| S | 0.044 | 0.200 | −0.152 | −0.507 | ||
NOTES: Bold: Correlation is significant at the 0.01 level (2-tailed). Bold and Italic: Correlation is significant at the 0.05 level (2-tailed).
Endplate Area
There was a trend towards greater total endplate area in males compared to females (1,978 ± 692 mm2 vs. 1,819 ± 502 mm2; p = 0.055). When stratified for symptoms of LBP within each gender, there was no difference in the female group (symptomatic 1,754 ± 517 mm2 vs. asymptomatic 1,902 ± 491 mm2; p = 0.248), but males with complaints of LBP presented with significantly larger endplate areas (symptomatic 2,213 ± 591 mm2 vs. asymptomatic 1,808 ± 704 mm2; p < 0.001) (Figure 5). There were no significant differences in endplate concavity index between gender, nor when evaluating for presentation of LBP, stratified by gender (Table 2).
Figure 5.

Left: There was a trend towards greater total endplate area in males compared to females. Right: When stratified for symptoms of low back pain within each gender, there were differences in both genders, but in reversed fashion: Normal females had larger areas than symptomatic females; and in males the opposite was shown. Abbreviations: M, male; F, female. N, no symptoms; S, Symptomatic for low back pain. Error bars span one standard deviation. Lines above bars show significant differences between groups (*: p< 0.05; **: p < 0.001).
Older subjects (ages 40–59) presented with large endplate areas than that of the younger subjects (ages 20-39) at the lower lumbar levels L4-S1 (older 2,192 ± 697 mm2 vs. younger 1,951 ± 534 mm2, p = 0.0148) while at similar endplate areas were observed at the upper lumbar levels L1-L3 (older 1,882 ± 571 mm2 vs. younger 1,861 ± 521 mm2, p = 0.762) [Figure 6a]. When evaluating the presence of LBP symptoms, stratified by age groups, the older group of subjects with symptoms had significantly larger endplate areas than those that denied LBP symptoms (older 2,187 ± 702 mm2 vs. younger 1,842 ± 541 mm2, p=0.001) [Figure 6bc]. A similar comparison in younger subjects revealed similar endplate areas regardless of their symptom presentation (older 1,823 ± 552 mm2 vs. younger 1,811 ± 341 mm2, p=0.794). Overall, subjects who presented with LBP symptoms revealed significantly larger endplate areas (p=0.022), especially at the lower lumbar levels (p < 0.001). Both variables (LBP and lumbar level) influenced the results, with a combined effect of 0.64 (presence of LBP symptoms × lumbar level). There were no significant differences in endplate concavity index between the two different age groups, symptom presentation, or lumbar levels.
Figure 6.

A) Endplate areas were larger in older subjects (ages 40-59) than in younger subjects (ages 20-39) at the lower lumbar levels. B) When evaluating the presence of low back pain symptoms, stratified by age groups, the older group of subjects with symptoms had significantly larger endplate areas than those that denied low back pain symptoms. Overall, symptomatic subjects were shown to have significantly larger endplate areas, especially at the lower lumbar levels (C). Abbreviations: LLS, Lower Lumbo-Sacral (L4-S1); ULS, Upper Lumbar (L1-L3); N, no symptoms; S, Symptomatic for low back pain. Error bars span one standard deviation. Unless noted, lines above experimental groups denote significant differences at p < 0.05.
Discussion
Given the magnitude of lumbar disc disease leading to persistent sciatica and LBP understanding the basic biomechanical changes as the pathology progresses is critical. Specifically, the relationship between the intervertebral disc during the DD progression and load transmission to the endplates has been previously hypothesized.5 However, there are scarce reports that evaluate the effect of this load alteration on endplate geometry as the disc degenerates. We sought to evaluate the 3D endplate geometry in vivo (in subjects with or without LBP and/or DD) and investigate the correlation between the 3D endplate geometry and intervertebral DD. We also evaluated the impact of LBP symptoms, age, gender, and lumbar level on the endplate anatomy. In summary, we observed a transition from a concave endplate surface in individuals without disc degenerative changes and mild-moderate DD towards a more convex geometry of the endplate surface in advanced DD (Grade 5). Secondarily, older subjects and those with LBP symptoms often presented with greater endplate areas, especially in the lumbo-sacral region. However, no significant differences in endplate concavity were observed when comparing different age groups, gender, lumbar levels, and presentation of LBP. The correlation analyses showed that an increase in DD is associated with a decrease in concavity in the sagittal plane in the symptomatic subjects. Since subjects with Grade 5 were not included in the asymptomatic subjects, this correlation might not be shown in the asymptomatic group. A positive correlation was found between the disc height and the Sagittal Concavity Index in the symptomatic male older subgroup. Unexpectedly, however, negative correlations between the disc height and the concavity indexes were found some of the asymptomatic subgroups. The negative correlation can be explained if uniform disc height loss would occur without changes in endplate geometry because equal amount of disc height reduction in the central and peripheral regions causes an increase in the central disc height/peripheral disc height ratio. Another possible explanation would be disc height loss at the peripheral region due to AF degeneration with a relatively healthy NP. Future studies on the analysis of individual endplate geometry and detailed MRI evaluation of the AF degeneration will allow for a better explanation of the negative association on the disc height.
It has been hypothesized that DD alters load transmission to the endplates, as the load transmission shifts from the NP to the AF.5 Although the mechanism has not been fully elucidated, is it thought that this occurs due to a decrease in the hydrostatic pressure of the NP as the disc degenerates.5 Histological studies have determined the thickness of the cartilage endplate to be 0.3-1.0 mm, but exact locations of these measurements within the endplate surface are not well described.11–14 Van der Houwen et al. a large variation in the depth profile over the endplates from convex to concave, but no correlation with anatomy could be determined.15 Our findings of concavity are in agreement with similar reports published in the literature.15–18
There are few reports describing the effect of age, gender, and LBP symptoms on endplate anatomy. Vertebral endplates can be weakened as a consequence of DD and bone thinning over time causing an adverse combination of endplate nerve proliferation plus chemical sensitization and mechanical stimulation, ultimately implicated as a possible cause for LBP.19
This study is not without limitations. The CT scans were performed with subjects in supine position, so the resulting images may be different when standing. Although we have successfully applied the use of disc height distribution to evaluate the endplate geometry in this study, this is only an indirect measurement of the endplate anatomy. We are not currently able to directly measure and quantify the actual endplate thickness, since the cartilaginous endplate is not visible using CT. Similarly, there are no common, standard reference conventions to define what the plane of the endplate should be. Lastly, this study is not powered to constitute a population study. A much larger sample size would provide better insights into this issue.
Conclusion
The results from this work implicate the changes in endplate shape with increasing age and advancing DD in the shift in load transmission from the nucleus pulposus to the annulus fibrosus associated with DD, resulting in changes within the curvature of the endplates. This is also the first study to describe the direct impact of age, gender, and LBP on vertebral endplate anatomy in vivo. Future studies that can perform these types of measurements of the endplate 3D geometry may constitute useful diagnostic method to estimate alteration of load transmission during DD.
Acknowledgments
The manuscript submitted does not contain information about medical device(s)/drug(s). National Center for Complementary and Integrative Health (R01-AT006692) and National Institute of Arthritis and Musculoskeletal and Skin Diseases (P01 AR-48152) funds were received in support of this work.
Relevant financial activities outside the submitted work: board membership, grants, royalties, stocks.
References
- 1.Freburger JK, Holmes GM, Agans RP, et al. The rising prevalence of chronic low back pain. Arch Intern Med. 2009;169(3):251–258. doi: 10.1001/archinternmed.2008.543. [DOI] [PMC free article] [PubMed] [Google Scholar]
- 2.Dagenais S, Caro J, Haldeman S. A systematic review of low back pain cost of illness studies in the United States and internationally. The Spine Journal. 2008;8(1):8–20. doi: 10.1016/j.spinee.2007.10.005. [DOI] [PubMed] [Google Scholar]
- 3.Vos T, Flaxman AD, Naghavi M, et al. Years lived with disability (YLDs) for 1160 sequelae of 289 diseases and injuries 1990-2010: a systematic analysis for the Global Burden of Disease Study 2010. Lancet. 2012;380(9859):2163–2196. doi: 10.1016/S0140-6736(12)61729-2. [DOI] [PMC free article] [PubMed] [Google Scholar]
- 4.Mok FPS, Samartzis D, Karppinen J, Fong DYT, Luk KDK, Cheung KMC. Modic changes of the lumbar spine: prevalence, risk factors, and association with disc degeneration and low back pain in a large-scale population-based cohort. Spine J. 2016;16(1):32–41. doi: 10.1016/j.spinee.2015.09.060. [DOI] [PubMed] [Google Scholar]
- 5.White AA, III, Panjabi MM. Clinical Biomechanics of the Spine. 2nd. Philadelphia: Lippincott; 1990. [Google Scholar]
- 6.Mimura M, Panjabi MM, Oxland TR, Crisco JJ, Yamamoto I, Vasavada A. Disc degeneration affects the multidirectional flexibility of the lumbar spine. Spine. 1994;19(12):1371–1380. doi: 10.1097/00007632-199406000-00011. [DOI] [PubMed] [Google Scholar]
- 7.Rohlmann A, Zander T, Schmidt H, Wilke H-J, Bergmann G. Analysis of the influence of disc degeneration on the mechanical behaviour of a lumbar motion segment using the finite element method. Journal of Biomechanics. 2006;39(13):2484–2490. doi: 10.1016/j.jbiomech.2005.07.026. [DOI] [PubMed] [Google Scholar]
- 8.Pfirrmann CW, Metzdorf A, Zanetti M, Hodler J, Boos N. Magnetic resonance classification of lumbar intervertebral disc degeneration. Spine. 2001;26(17):1873–1878. doi: 10.1097/00007632-200109010-00011. [DOI] [PubMed] [Google Scholar]
- 9.Simon P, Espinoza Orías AA, Andersson GBJ, An HS, Inoue N. In Vivo Topographic Analysis of Lumbar Facet Joint Space Width Distribution in Healthy and Symptomatic Subjects. Spine. 2012;37(12):1058–1064. doi: 10.1097/BRS.0b013e3182552ec9. [DOI] [PMC free article] [PubMed] [Google Scholar]
- 10.O’Connell GD, Johannessen W, Vresilovic EJ, Elliott DM. Human internal disc strains in axial compression measured noninvasively using magnetic resonance imaging. Spine. 2007;32(25):2860–2868. doi: 10.1097/BRS.0b013e31815b75fb. [DOI] [PubMed] [Google Scholar]
- 11.Zhang Y, Lenart BA, Lee JK, et al. Histological features of endplates of the mammalian spine: from mice to men. Spine. 2014;39(5):E312–E317. doi: 10.1097/BRS.0000000000000174. [DOI] [PMC free article] [PubMed] [Google Scholar]
- 12.Lama P, Zehra U, Balkovec C, et al. Significance of cartilage endplate within herniated disc tissue. Eur Spine J. 2014;23(9):1869–1877. doi: 10.1007/s00586-014-3399-3. [DOI] [PubMed] [Google Scholar]
- 13.Roberts S, Menage J, Urban JP. Biochemical and structural properties of the cartilage end-plate and its relation to the intervertebral disc. Spine. 1989;14(2):166–174. doi: 10.1097/00007632-198902000-00005. [DOI] [PubMed] [Google Scholar]
- 14.DeLucca JF, Peloquin JM, Smith LJ, Wright AC, Vresilovic EJ, Elliott DM. MRI quantification of human spine cartilage endplate geometry: Comparison with age, degeneration, level, and disc geometry. In: Iatridis JC, Kang J, Kandel R, Risbud MV, editors. J Orthop Res. 8. Vol. 34. 2016. pp. 1410–1417. [DOI] [PMC free article] [PubMed] [Google Scholar]
- 15.van der Houwen EB, Baron P, Veldhuizen AG, Burgerhof JGM, van Ooijen PMA, Verkerke GJ. Geometry of the Intervertebral Volume and Vertebral Endplates of the Human Spine. Ann Biomed Eng. 2009;38(1):33–40. doi: 10.1007/s10439-009-9827-6. [DOI] [PMC free article] [PubMed] [Google Scholar]
- 16.Shao Z, Rompe G, Schiltenwolf M. Radiographic changes in the lumbar intervertebral discs and lumbar vertebrae with age. Spine. 2002;27(3):263–268. doi: 10.1097/00007632-200202010-00013. [DOI] [PubMed] [Google Scholar]
- 17.Pappou IP, Cammisa FP, Girardi FP. Correlation of end plate shape on MRI and disc degeneration in surgically treated patients with degenerative disc disease and herniated nucleus pulposus. The Spine Journal. 2007;7(1):32–38. doi: 10.1016/j.spinee.2006.02.029. [DOI] [PubMed] [Google Scholar]
- 18.Amonoo-Kuofi HS. Morphometric changes in the heights and anteroposterior diameters of the lumbar intervertebral discs with age. Journal of Anatomy. 1991;175:159–168. doi: 10.1111/(ISSN)1469-7580. [DOI] [PMC free article] [PubMed] [Google Scholar]
- 19.Lotz JC, Fields AJ, Liebenberg EC. The role of the vertebral end plate in low back pain. Global Spine J. 2013;3(3):153–164. doi: 10.1055/s-0033-1347298. [DOI] [PMC free article] [PubMed] [Google Scholar]