Pancreatic ductal adenocarcinoma (PDAC) is a lethal cancer with less than 7% of patients surviving past 5 years. T cell immunity has been linked to the exceptional outcome of the few long term survivors (LTSs)1,2, yet the relevant antigens remain unknown. Here we use genetic, immunohistochemical, and transcriptional immunoprofiling, computational biophysics, and functional assays to identify T cell antigens in LTSs. Using whole exome sequencing and in silico neoantigen prediction, we found that tumors with both the highest neoantigen number and the most abundant CD8+ T cell infiltrates, but neither alone, stratified patients with the longest survival. Investigating the specific neoantigen qualities promoting T cell activation in LTSs, we discovered that LTSs were enriched in neoantigen qualities defined by a fitness model, and neoantigens in the tumor antigen MUC16/CA125. A neoantigen quality fitness model conferring greater immunogenicity to neoantigen presentation and homology to infectious disease-derived peptides, identified LTSs in two independent datasets, whereas a neoantigen quantity model ascribing greater immunogenicity to increasing neoantigen number alone did not. We detected intratumoral and lasting circulating T cell reactivity to both high quality and MUC16 neoantigens in LTSs, including clones with specificity to both high quality neoantigens and predicted cross reactive microbial epitopes, consistent with neoantigen molecular mimicry. Interestingly, we observed selective loss of high quality and MUC16 neoantigenic clones on metastatic progression, suggesting neoantigen immunoediting. Our results identify neoantigens with unique qualities as T cell targets in PDAC. More broadly, we identify neoantigen quality as a biomarker for immunogenic tumors that may guide application of immunotherapies.
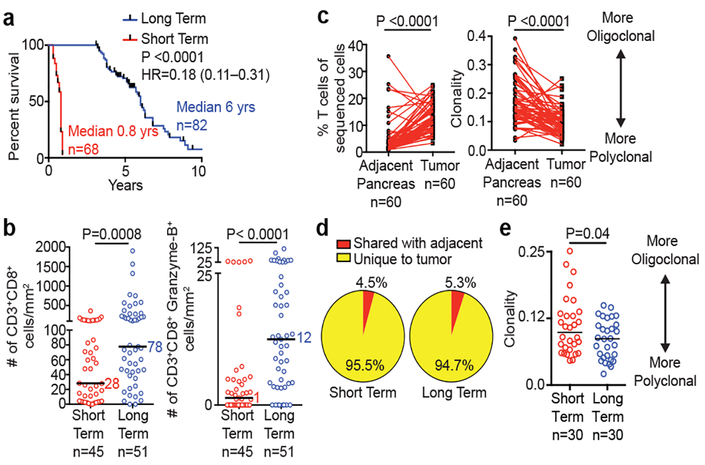
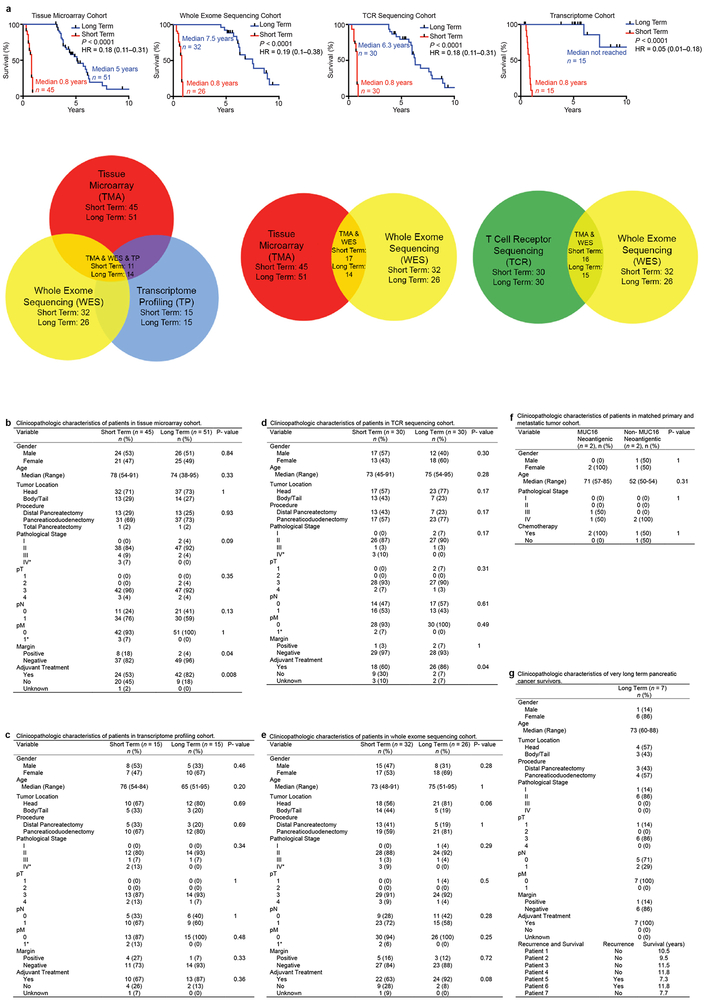
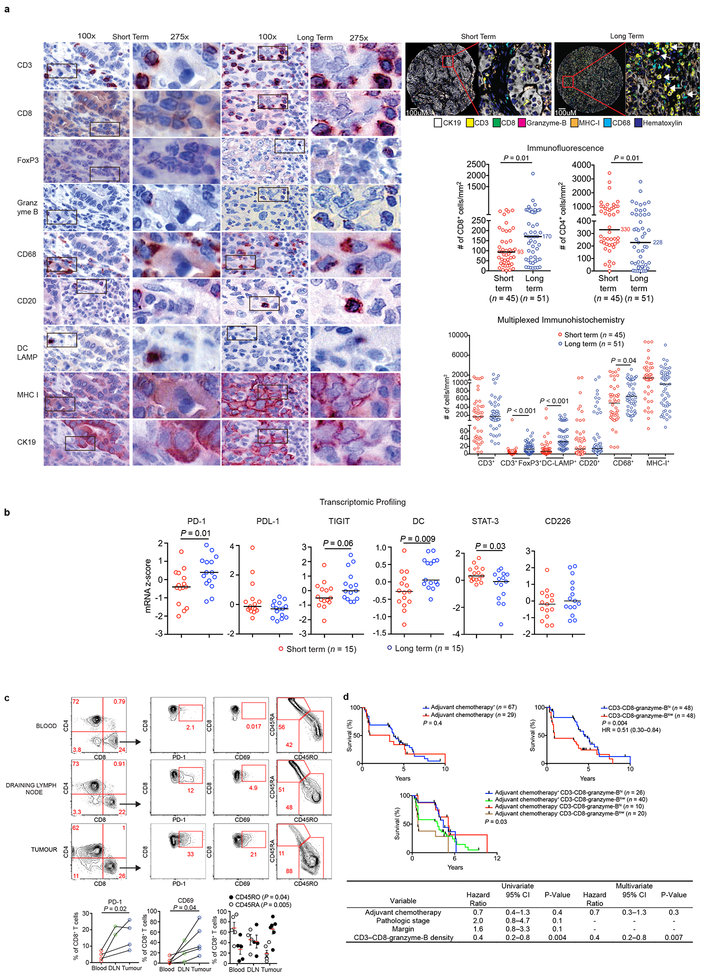
To define the significance of neoantigens in PDAC, we compared stage-matched cohorts of treatment-naïve, surgically resected, rare LTSs (median survival 6 years, n=82) to short term survivors (STS) with more typical poor outcome (median survival 0.8 years, n=68; MSKCC cohort; Figure 1a, Extended Data Figure 1a-e). Using 9-parameter multiplexed immunohistochemistry3 and immunofluorescence in tissue microarrays, we found greater densities of CD8+ T cells (3-fold), cytolytic CD8+ cells (12-fold), mature dendritic cells, regulatory T cells, macrophages, and decreased CD4+ T cells in tumors of LTSs, yet no differences in B and MHC-I+ cells (Figures 1b, Extended Data Figure 2a). Transcriptomic profiling revealed an immunogenic microenvironment in tumors of LTSs, with upregulation of molecular markers of dendritic cells4, and antigen experience (PD-1 and TIGIT)5, as well as downregulation of the immunosuppressive marker STAT3 (Extended Data Figure 2b). T cell receptor (TCR) Vβ chain sequencing demonstrated that intratumoral T cells were increased 5-fold compared to matched adjacent non-tumor pancreatic tissue and markedly polyclonal (Figure 1c). Strikingly, >94% of intratumoral T cell clones were unique to tumors, consistent with tumor specificity (Figure 1d). Additionally, in unselected patients, flow cytometry on intratumoral T cells revealed activation and memory marker upregulation compared to draining lymph node and blood T cells, consistent with antigen specificity (Extended Data Figure 2c). Finally, tumors of LTSs exhibited greater TCR repertoire diversity (Figure 1e). The association of activated CD8+ T cells and survival was independent of clinicopathologic factors and adjuvant chemotherapy (Extended Data Figure 2d) Collectively, tumors of LTSs exhibited an activated, polyclonal, tumor-specific T cell infiltrate implying differential antigenic targets.
Figure 1: Pancreatic cancer survivors display enhanced T cell immunity.
(a) Survival of MSKCC cohorts. (b) Quantification of CD8+ T cells using multiplexed immunohistochemistry. (c) T cell frequency, repertoire clonality and (d) clonal overlap in tumor and matched adjacent normal pancreatic tissues by TCR Vβ sequencing. (e) Intratumoral T cell repertoire clonality in tumors of short and long term survivors. Horizontal bars, median values. n = biologically independent samples in individual patients. P values were determined by log rank test (a), two-tailed Mann Whitney test (b), two-tailed paired (c) and two-tailed unpaired Student’s t-tests (e).
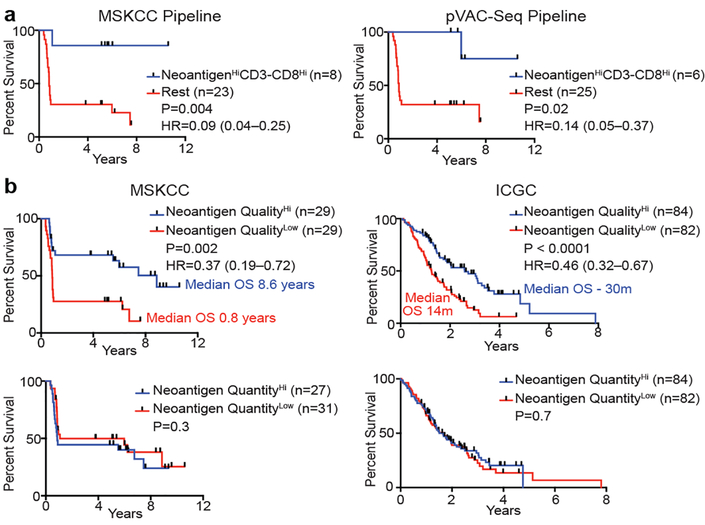
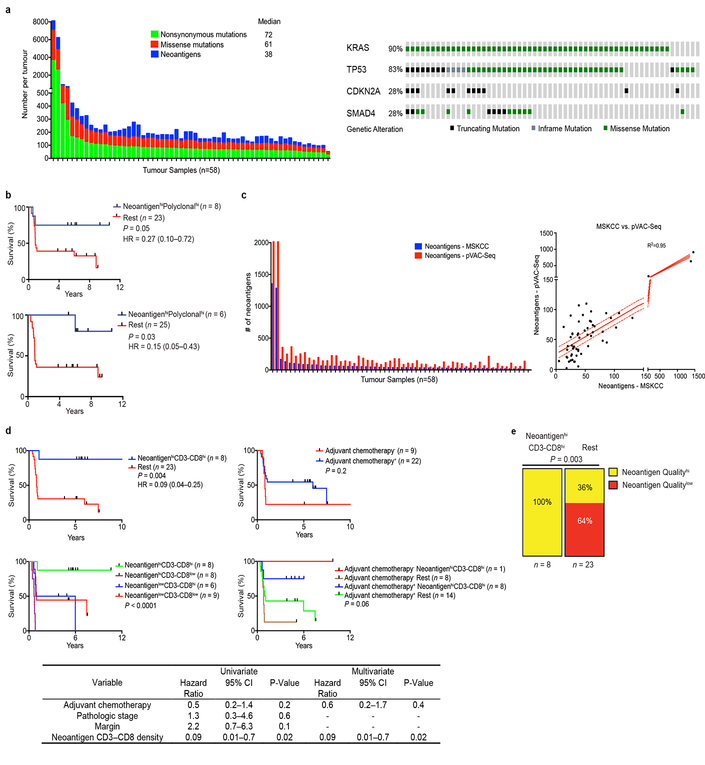
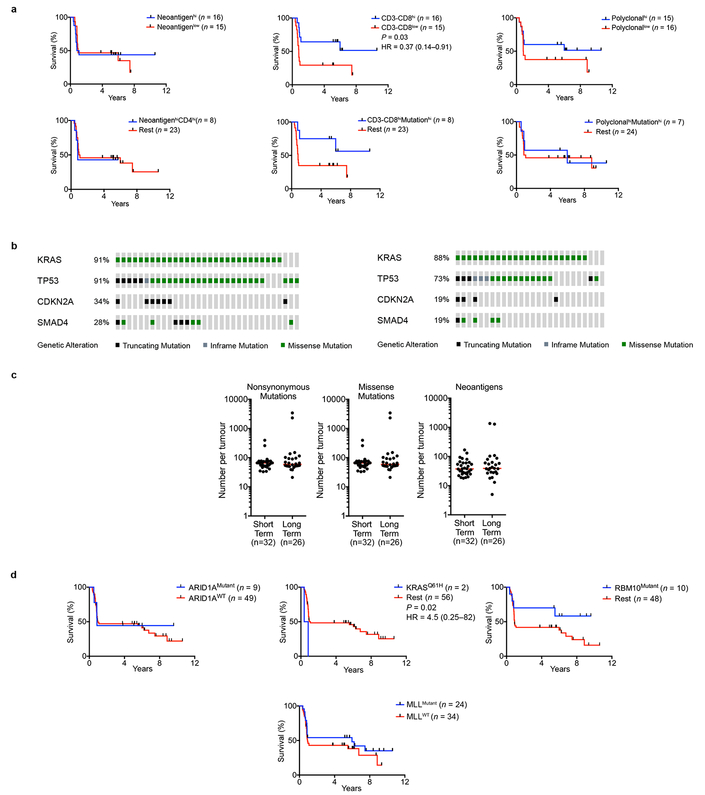
To determine the neoantigen frequency in PDACs, we performed whole exome sequencing on macrodissected tumor islands. We detected a median of 38 predicted neoantigens per tumor (Extended Data Figure 3a, Supplemental Table 1)6. Remarkably, patients with both the highest predicted neoantigen number and either the greatest CD3+CD8+, or polyclonal T cell repertoire, but neither alone, exhibited the longest survival (median survival not reached, Figure 2a, Extended Data Figure 3b). We corroborated these findings using a second neoantigen prediction algorithm7 (Figure 2a, Extended Data Figure 3c). This association of higher neoantigen quantity and CD8+ T cell infiltrate with survival was independent of adjuvant chemotherapy (Extended Data Figure 3d). Furthermore, we found that higher neoantigen quantity and CD8+ T cell infiltrate together exhibited the strongest association with survival, with other genomic and immune parameters showing weak/no associations with survival (Extended Data Figure 4a-d)8. Together, these data suggest that neoantigen immunogenicity/quality, and not purely quantity, correlates with survival.
Figure 2: Neoantigen quality is prognostic of survival.
(a) Survival of patients with tumors harboring both greater than the median number of neoantigens (NeoantigenHi), and CD3-CD8 double positive cells (CD3-CD8Hi), compared to all other patients (Rest), as determined by the MSKCC and pVAC-Seq neoantigen prediction pipelines. (b) Patient survival stratified by neoantigen quality and quantity in the MSKCC and ICGC cohorts. n = biologically independent samples in individual patients. P-values were determined using log-rank test (a, b).
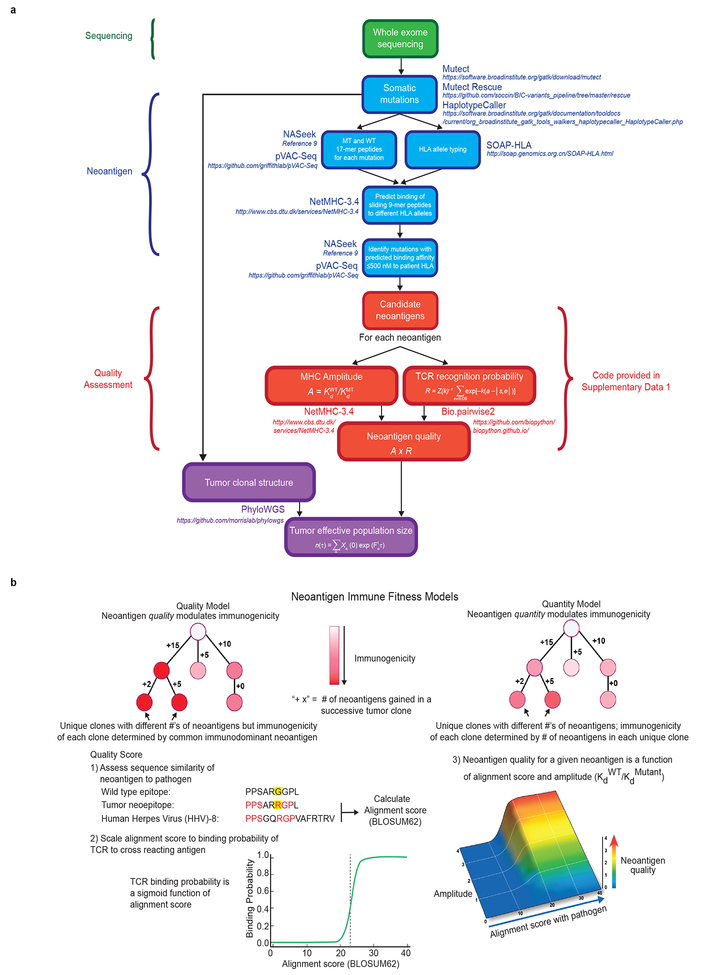
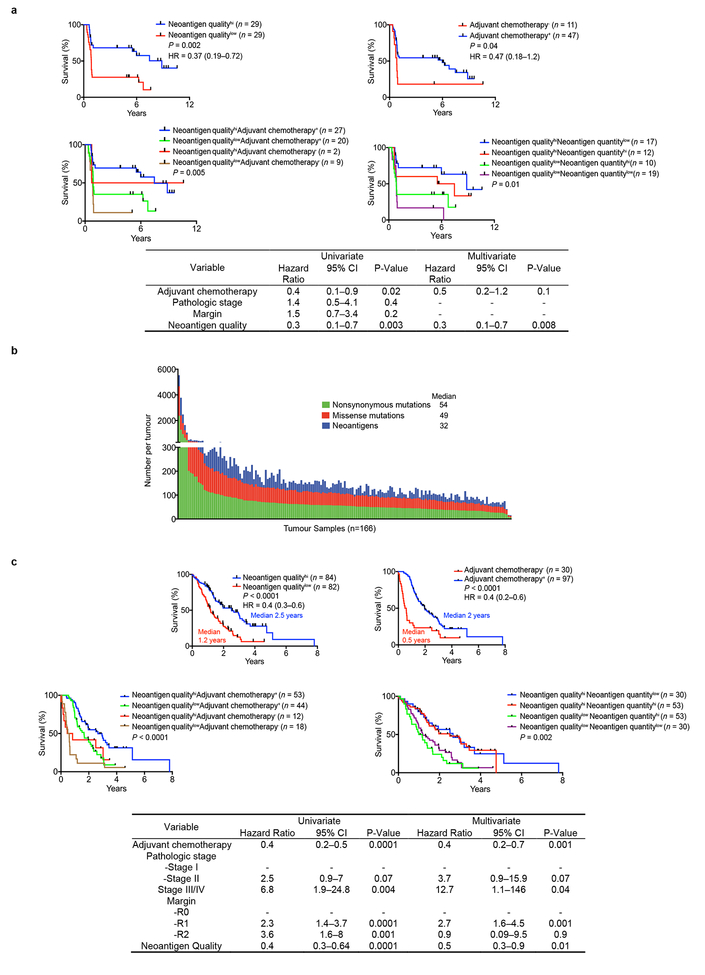
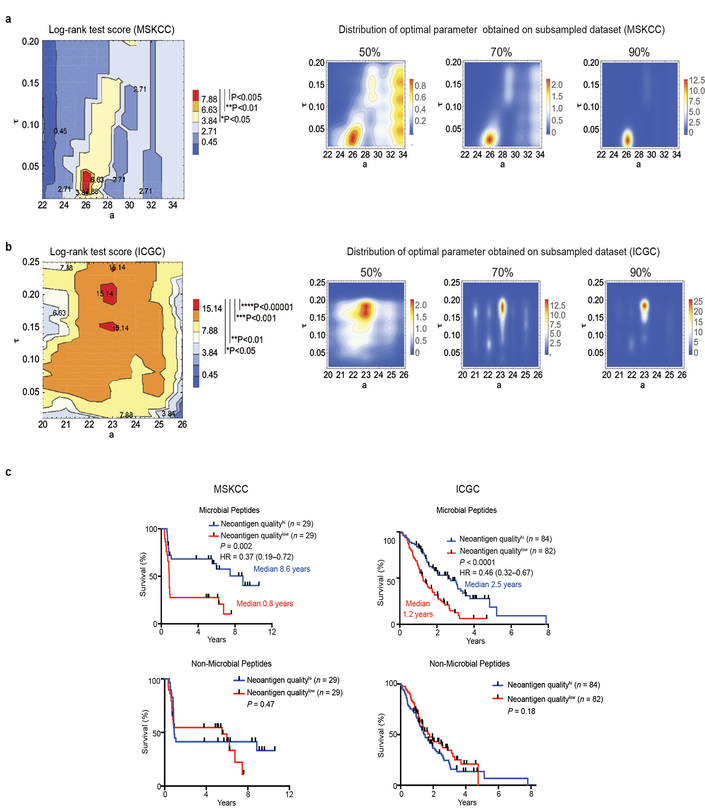
We next investigated neoantigen qualities that modulate differential immunogenicity. The theory of molecular mimicry postulates TCRs that can recognize pathogenic antigens can also recognize non-pathogenic antigens, which has been documented in autoimmunity9, but not in the cancer context. We theorized that neoantigen homology to infectious disease-derived epitopes, which are recognized by the human TCR repertoire, can serve as a partial surrogate for differential neoantigen immunogenicity or “nonselfness”. This hypothesis does not assume any associations between pre-existing antimicrobial immunity and survival, but rather aims to develop a strategy to identify candidate neoantigens based on defined immunogenic pathogen-derived epitopes. To test this hypothesis, we developed neoantigen quality and quantity models (Extended Data Figure 5a, b). For each neoantigen in the quality model, we derived sequence alignment scores to human infectious derived, class-I restricted peptide sequences with positive immune assays (hereby referred to as “microbial”) from the Immune Epitope Database (IEDB, Supplementary Table 2). We then inferred its probability of TCR-recognition using a non-linear logistic dependence on alignment score, and calculated quality scores by amplifying these binding probabilities by inferred relative wild type and mutant peptide-MHC-I affinities (Extended Data Figure 5a, b). For the quantity model, the neoantigen score equaled the total number of neoantigens within a clone. Using an evolutionary model, we interpreted the score of a clone as calculated by each model as its fitness cost due to immune interactions10. We then recreated the clonal tree structure for each tumor based on mutant allele frequencies, and projected the change to each tumor’s effective cancer cell population size. Of these models, the quality model, but not the quantity model, significantly stratified short and LTSs independent of confounding factors and adjuvant chemotherapy (Figure 2b, Extended Data Figure 6a) Notably, all tumors with the highest neoantigen load in combination with the most abundant CD8+ T cell infiltrates harbored high quality neoantigens (Extended Data Figure 3e). Testing these models in a larger cohort unselected by survival (International Cancer Genome Consortium (ICGC); n=166), neoantigen quality, but not quantity, was prognostic of survival and independent of confounding variables (Figure 2b, Extended Data Figure 6b, c), with a stable association with survival in subsampled datasets in both cohorts (Extended Data Figure 7a, b). We conclude that neoantigen quality is a biomarker of survival in PDAC.
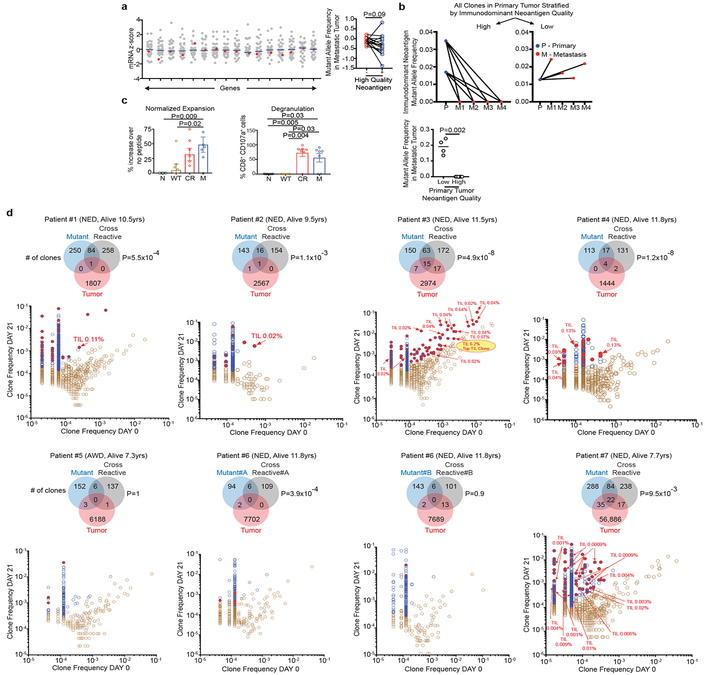
Recent data has shown that T cell-recognized neoantigens can be selectively lost from the tumor cell population either by mutant allelic loss or overall reduced gene expression11. Consistently, genes with high quality neoantigens evidenced a modest trend to lower mRNA expression compared to gene expression in the absence of high quality neoantigens (Figure 3a). To further explore possible in vivo high quality neoantigen immunoediting, we examined neoantigen clonal dynamics on primary to metastatic tumor progression in one patient obtained through rapid autopsy. Of the three clones in the primary tumor, both clones with high quality neoantigens were lost in multiple metastatic samples, in contrast to the clone with a low quality neoantigen which was propagated to multiple metastatic sites (Figure 3b, Extended Data Figure 1f). These findings suggest differential immune fitness of clones bearing high versus low quality neoantigens within the same primary tumor.
Figure 3: Neoantigen and cross reactive microbial peptide T cells detected in blood and tumors.
(a) Gene expression in the presence (red) or absence (gray) of high quality neoantigenic mutations. X axis = genes, shaded circles = biologically independent samples in individual patients (n=30). Median non-neoantigenic and neoantigenic expression (right). All high quality neoantigenic genes with available mRNA expression are shown. (b) Metastatic propagation of all clones in the primary tumor stratified by neoantigen quality. Mutant allele frequencies in matched primary-metastatic tumors (left) and metastatic tumors alone (right) are shown in biologically independent samples in one patient. (c, d) PBMCs pulsed with no (N), WT control (WT), cross reactive (CR), and high quality neo (M) peptide (n=7). (c) CD8+ T cell expansion and degranulation. (d) Clonal overlap of expanded T cell clones in (c) and archival tumors by TCR Vβ sequencing. Arrows = clones in archival primary tumors with rank frequencies. Venn diagrams show number of T cell clones expanding with mutant, and cross reactive peptides, their respective clonal overlap, and clonal overlap with archival primary tumors. Note presence of clones recognizing both neopeptides and cross reactive peptides in archival tumors. Years surviving following surgery are shown for each individual patient. NED = No Evidence of Disease, AWD = Alive with Disease. Horizontal bars, median values. Error bars, mean ± SEM. n = biologically independent samples in individual patients in a and c. P values were determined in (a) using two-tailed Student’s t test, in (b) using two-tailed Mann Whitney test, in (c) using one-way ANOVA with Tukey’s multiple comparison test, and in (d) as described in the Methods.
We next sought to detect in vivo T cell responses to high quality neoantigens. We identified 7 very long term PDAC survivors (median OS 10.5 years) that normally account for <2% of all PDAC patients (Extended Data Figure 1g) and pulsed their peripheral blood mononuclear cells with antigens predicted by the quality model. Remarkably, we observed selective CD8+ T cell expansion and degranulation to neopeptides and their homologous infectious disease-derived peptides (deemed the “cross reactive” peptide relative to a neoantigen) but not to their WT peptides. Moreover, in all patients, identical TCR clones were significantly expanded to both the neopeptides and cross reactive peptides (Figure 3c, Extended Data Figure 8a-b, Supplementary Table 3). Strikingly, in 5 of 7 patients, we identified neoantigen and microbial cross reactive peripheral T cell clones that were also present in their respective archival primary tumors. Patient 3, alive and disease free 12 years after primary tumor removal illustrated the most extreme instance – 15 neoantigen and microbial cross reactive T cell clones that persisted in the peripheral blood were found in the primary tumor, including the top T cell clone at an intratumoral rank frequency of 6.2% (Figure 3d). We submit that our quality model identifies bonafide neoantigens targeted by T cells and that tumor-infiltrating T cells can cross reactively recognize both cancer neoantigens and homologous non-cancer microbial antigens.
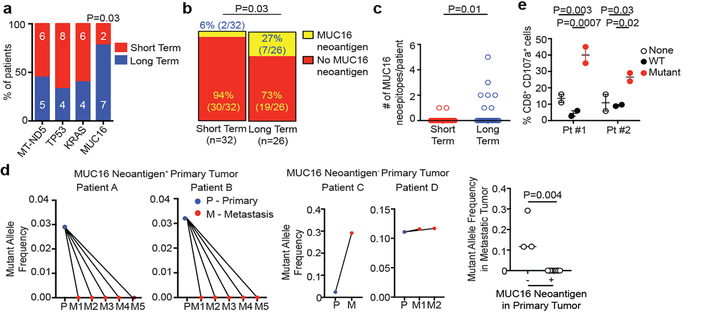
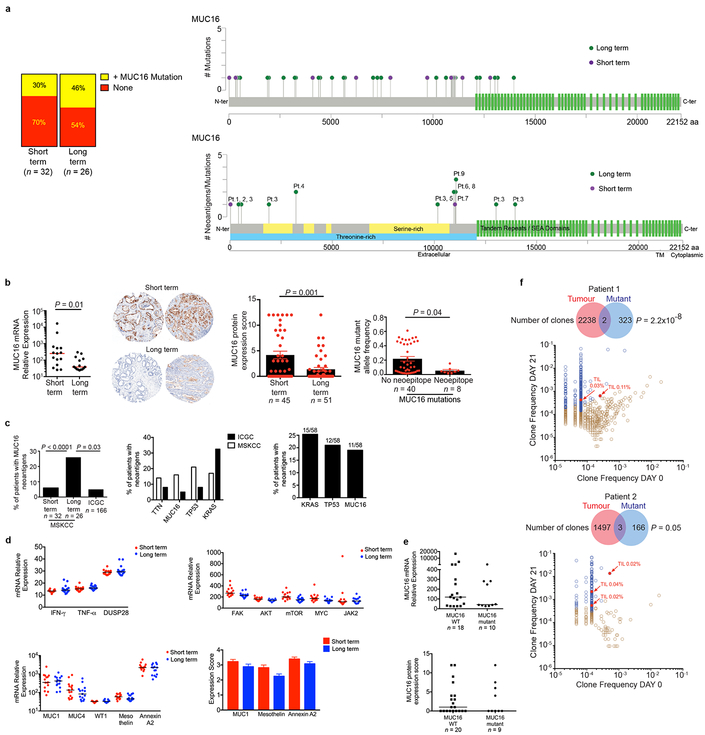
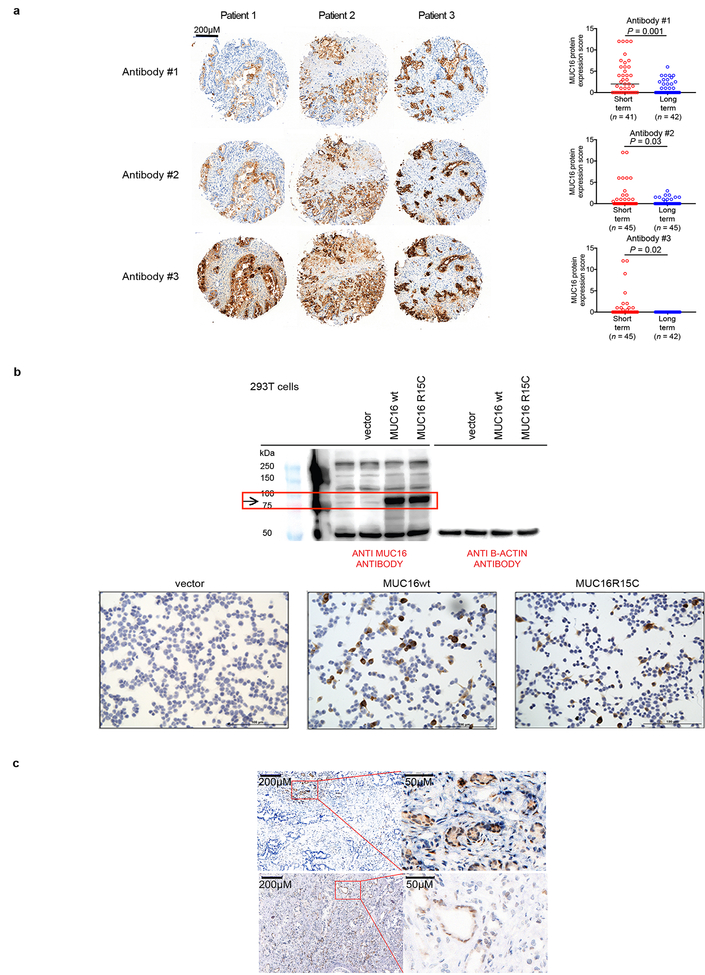
In exploring if select genetic loci or “immunogenic hotspots” were preferentially enriched for neoantigens, we detected 4 loci harboring neoantigens in >15% of all patients, with one locus preferentially enriched in LTSs: the tumor antigen MUC16, a common ovarian cancer biomarker (CA125), and an established T cell immunotherapy target12 (Figure 4a). In tumors of LTSs, we found a 4-fold higher MUC16 neoantigen frequency and multiple MUC16 neoantigens in the same tumor whereas non-antigenic MUC16 mutation frequency was no different (Figures 4b, c; Extended Data Figure 9a). Only one patient with MUC16 neoantigens had a hypermutated phenotype (>500 mutations), and exclusion of this patient did not alter the results (Figure 4c). Supporting possible in vivo anti-MUC16 immunity, tumors in LTSs had lower mRNA (6.6-fold), protein, and mutant allele frequency (MAF, 4-fold) in non-hypermutated tumors compared to STSs (Extended Data Figure 9b). Consistently, the pVAC-Seq pipeline identified MUC16 as the most common locus generating neoantigens, after the frequently mutated oncogenes (KRAS, TP53) (Extended Data Figure 9c) We found no differences between the two cohorts in cell-autonomous regulators of MUC16 expression, mediators of MUC16 dependent effects on tumor progression, other mucin or tumor antigen expression, or evidence of MUC16 mutations altering RNA or protein expression (Extended Data Figure 9d)13–16. One interpretation of these results is that MUC16 neoantigen-specific T cell immunity induces immunoediting of MUC16 expressing clones in primary tumors, and prolong survival, given the cell-autonomous roles of MUC16 in promoting metastases14,16. Notably, MUC16 protein expression was low yet not absent in tumors of LTSs, indicating antigen availability and mutations did not affect cell intrinsic expression (Extended Data Figure 9e, 10a-c). Consistent with possible MUC16 immunoediting, MUC16 neoantigens in primary tumors had complete neoantigenic mutational loss in matched metastases (n = 10) in contrast to MUC16 non-neoantigenic mutations that demonstrated mutation enrichment on metastatic progression (Figure 4d, Extended Data Table 5). MUC16 was also the only locus recurrently harboring neoantigens in both MSKCC and ICGC cohorts, outside of the most frequently mutated genes (oncogenes -KRAS, TP53; largest human gene -TTN) (Extended Data Figure 9c). Although the propensity to generate MUC16 neoantigens may be related to its large size, we did not detect trends towards neoantigen formation based on gene size alone across cohorts or pipelines. Additionally, as the number of patients with MUC16 neoantigens in the LTS cohort was small, validation in a larger LTS dataset is warranted. Hence MUC16 is a candidate immunogenic hotspot in PDAC.
Figure 4: MUC16 is a neoantigenic hotspot in pancreatic cancer survivors.
(a) Genes with neoantigens in >15% of patients. (b) MUC16 neoantigen frequency and (c) number. Short term n=32, long term n=26 in (a), (b), and (c). (d) Metastatic propagation of all clones in the primary tumor stratified by the presence/absence of MUC16 neoantigens. Mutant allele frequencies in matched primary-metastatic tumors (left) and metastatic tumors alone (far right) are shown in biologically independent samples in four patients. (e) CD8+ T cell degranulation in PBMCs pulsed with no peptide (None), MUC16 neopeptide (Mutant), and control WT peptide (WT). Data in (e) are representative of two independent experiments with similar results. n = biologically independent samples in individual patients. Horizontal bars, median values. Error bars, mean ± SEM. P values were determined in (a, b) using two-sided Chi-square test, in (c, d) using two-tailed Mann-Whitney test, and in (e) using two-way ANOVA with Tukey’s multiple comparison test.
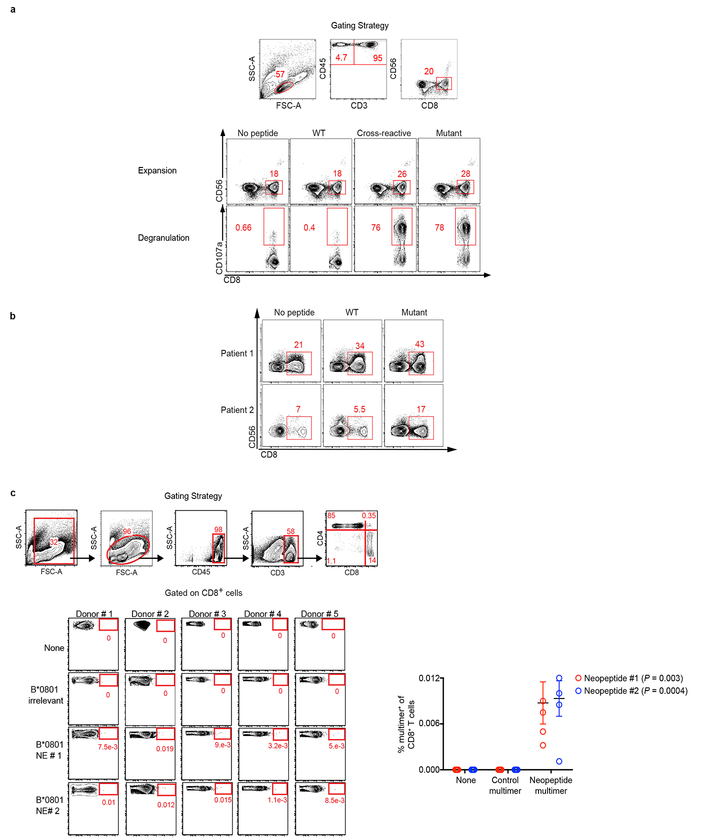
We next stimulated peripheral blood from 2 LTSs (both disease-free 8 years following surgery) with predicted MUC16 neoantigens. In both patients, we observed CD8+ T cell expansion and degranulation, with expanded clones detected in archival surgically resected primary tumors (Figures 4e, Extended Data Figure 9f) We confirmed peripheral blood CD8+ T cell recognition of 2 additional MUC16 neoantigen-MHC complexes using peptide-MHC multimers in HLA-matched healthy donors (Extended Data Figure 8c), consistent with putative MUC16 neoantigen binding by the human TCR repertoire. Hence we present evidence of in vivo T cell reactivity to neoantigens in the tumor antigen MUC16, with lasting MUC16-specific T cell immunity in PDAC survivors.
Our results do not imply causal associations of pre-existing microbial and anti-tumor immunity in LTSs. Instead, our data suggest that embedding microbial homology in the context of our neoantigen quality model can help create an effective surrogate for immunogenic neoantigens. We posit two non-mutually exclusive mechanisms to explain these findings. The first is that although the naïve human TCR repertoire is theoretically vast, the observed TCR recombination products are notably restricted17, possibly representing sculpting of the TCR recombination space under the evolutionary selection pressures of pathogens, thereby skewing the repertoire to recognize their common protein features. The second is that as microbial antigens are by definition non-self sequences, enriched with documented human T cell clones surviving thymic selection, homologous tumor neoantigens are similarly non-self sequences enriched with bonafide human T cell clones. However, given recent evidence of intratumoral bacterial polarization of T cell phenotypes18, and microbial dependence of immunotherapy efficacy9, whether homology to patient-derived microbiomes enhances relevant neoantigen identification remains unknown yet timely. Notably, we identified no associations with survival when neoantigen quality was calculated using alignment to immunogenic allergy/autoimmune-derived IEDB peptides (Extended Data Figure 7c). However, the significant size discrepancy between the number of infectious disease-derived (Supplementary Table 2) and allergy/autoimmune-derived peptides (Supplementary Table 4) would warrant confirmation of these results in larger allergy/autoimmune peptide dataset.
Although viral-specific T cells have been detected in human tumors17, the presence of identical circulating and intratumoral T cell clones reactive to both high quality neoantigens and infectious disease-derived sequences offers proof-of-principle of neoantigenic molecular mimicry in a cancer context. Although patients with high quality neoantigen tumors exhibited prolonged survival, it remains unproven whether these cross reactive T cell clones contribute to this outcome, or whether this reflects the degeneracy of the human TCR repertoire.
Our results shed novel insight into the heterogeneous immunobiology of PDAC, a presumed poorly immunogenic and checkpoint blockade-refractory tumor, demonstrating that neoantigens may be T cell targets in LTSs. We propose that neoantigen quality, and not merely quantity, modulates immunogenicity, clonal fitness, and immunoselection during tumor evolution, with neoantigens in immunogenic residues such as MUC16 emerging as apparent hotspots. Our data suggest that neoantigen-specific immunity gained during primary tumor outgrowth could be associated with decreased relapse and prolonged survival, comparable to classical murine studies of prior tumor exposure protecting against tumor rechallenge18. Our findings support the development of strategies to harness neoantigen-specific immunity to treat checkpoint blockade refractory cancers, and the identification of immunogenic hotspots for directed neoantigen targeting.
Methods
Patient Samples
MSKCC PDAC cohort:
All tissues were collected at MSKCC following study protocol approval by the MSKCC institutional review board. Informed consent was obtained on all patients. The study was in strict compliance with all institutional ethical regulations. All tumor samples were surgically resected primary pancreatic ductal adenocarcinomas. Patients treated with neoadjuvant therapy were excluded. All tumors were subjected to pathologic re-review and histologic confirmation by two expert PDAC pathologists prior to analyses. LTSs were defined as patients with overall survival > 3 years from surgery, STSs as patients with survival >3 months and < 1 year from surgery to exclude perioperative mortalities.
ICGC cohort:
Clinical characteristics of the ICGC cohort have been previously described19.
Rapid Autopsy cohort:
Primary and metastatic tumor samples were collected posthumously from four patients as part of the Gastrointestinal Cancer Rapid Medical Donation program at Johns Hopkins Hospital (JHH)20. Informed consent was obtained from all subjects. This program was deemed in accordance with the Health Insurance Portability and Accountability Act and the study protocol was approved by the JHH institutional review board. The study was in strict compliance with all institutional ethical regulations.
Tissue Microarray
Tissue microarrays (TMAs) were constructed from tumor and adjacent non-tumor cores from formalin-fixed, paraffin embedded tissue blocks in short (n=45 tumors, 5 normal tissue) and long term (n=51 tumors, 5 normal tissue) survivors. Histology sections were reviewed by two expert PDAC pathologists and the most representative areas were selected and marked on H&E slides. 1 mm diameter cores were sampled from three different tumor regions per patient using an automated TMA Grand Master (Perkin Elmer, USA). Five μm sections were prepared from TMA blocks for immunohistochemistry. Patient subsets were randomly selected to undergo tissue microarray construction.
Immunohistochemistry
Human specific antibodies to MUC16 (clone OCT125, dilution 1:130), WT1 (clone CANR9 (IHC)-56–2, dilution 1:30), and Annexin A2 (ab54771, 5 ug/ml) were purchased from Abcam (MA, USA). Antibodies to MUC1 (clone M695, dilution 1:100), and Mesothelin (clone 5B2, dilution 1:50) were purchased from Vector laboratories (CA, USA). Immunohistochemistry was performed using standard techniques. MUC16 expression was scored as described21. For each core, a cumulative MUC16 expression score was calculated as the product of a score for the frequency of tumor cells expressing MUC16 (0–25%=1; 26–50%=2; 51–75%=3; 76–100%=4) and a score for the intensity of staining (0=negative; 1=weak; 2=moderate; 3=strong). The median expression score across triplicate cores is reported as the final score for each patient.
Multiplexed consecutive immunohistochemistry on the same slide was performed as described3. Tissue microarray (TMA) slides were baked overnight at 37°C. Then, paraffin was removed using xylene and tissue rehydrated prior to incubation in antigen retrieval solution at 95°C for 45 minutes (pH 9 Target Retrieval Solution, Dako). After endogenous peroxidase inhibition and FcR blocking, Granzyme B was stained with anti-Granzyme B monoclonal antibody (clone GrB-7, Dako) for 1 hour at room temperature. After signal amplification with an HRP labeled polymer (Dako), the revelation was done using 3-Amino-9-ethylcarbazole (AEC, Vector Laboratories). Then slides were immersed in hematoxylin, rinsed in distilled water and mounted in aqueous-based mounting medium (glycergel, Dako). After imaging using whole slide scanner, the slides were subjected to the Multiplexed Immunohistochemical Consecutive Staining on Single Slide protocol (MICSSS) and stained for T cells (CD3, clone 2GV6, Ventana and CD8, clone C8/144b, Dako), regulatory T cells (FoxP3, clone 236A/E7, Abcam), B cells (CD20, clone L26, Dako), macrophages (CD68, clone KP1, Dako), mature dendritic cells (DC-LAMP, clone 1010E1.01, Novus Biologicals), MHC class-I (HLA-ABC, clone EMR8–5, Abcam) and tumor cells (CK19, clone EP1580Y, Abcam).
Immunofluorescence
For CD4, FoxP3, and CK19 staining, sections first were incubated with anti-CD4 (Ventana, cat#790–4423, 0.5ug/ml) for 5 hours, followed by 60 minutes incubation with biotinylated goat anti- rabbit IgG (Vector Laboratories, cat#PK6101) at 1:200 dilution. The detection was performed with Streptavidin-HRP D (part of DABMap kit, Ventana Medical Systems), followed by incubation with Tyramide Alexa 488 (Invitrogen, cat#T20922) prepared according to manufacturer instruction with predetermined dilutions. Next, slides were incubated with anti-FoxP3 (Abcam, cat#ab20034, 5 ug/ml) for 4 hours, followed by 60 minutes incubation with biotinylated horse anti-mouse IgG (Vector Labs, cat#MKB-22258) at 1:200 dilution. The detection was performed with Streptavidin-HRP D (part of DABMap kit, Ventana Medical Systems), followed by incubation with Tyramide Alexa Fluor 568 (Invitrogen, cat#T20914) prepared according to manufacturer instruction with predetermined dilutions. Finally, sections were incubated with anti-CK19 (Abcam, cat#ab52625, 1ug/ml) for 5 hours, followed by 60 minutes incubation with biotinylated goat anti- rabbit IgG (Vector, cat#PK6101) at 1:200 dilution. The detection was performed with Streptavidin-HRP D (part of DABMap kit, Ventana Medical Systems), followed by incubation with Tyramide Alexa 647 (Invitrogen, cat#T20936) prepared according to manufacturer instruction with predetermined dilutions. After staining slides were counterstained with DAPI (Sigma Aldrich, cat#D9542, 5 ug/ml) for 10 min and coverslipped with Mowiol.
For CD3, CD8, and CK19 staining, slides first were incubated with anti-CD3 (DAKO, cat#A0452, 1.2ug/ml) for 4 hours, followed by 60 minutes incubation with biotinylated goat anti-rabbit IgG (Vector Labs, cat#PK6101) at 1:200 dilution. The detection was performed with Streptavidin-HRP D (part of DABMap kit, Ventana Medical Systems), followed by incubation with Tyramide Alexa 488 (Invitrogen, cat#T20922) prepared according to manufacturer instruction with predetermined dilutions. Next, slides were incubated with anti-CD8 (Ventana, cat#790–4460, 0.35ug/ml) for 5 hours, followed by 60 minutes incubation with biotinylated goat anti- rabbit IgG (Vector, cat#PK6101) at 1:200 dilution. The detection was performed with Streptavidin-HRP D (part of DABMap kit, Ventana Medical Systems), followed by incubation with Tyramide Alexa Fluor 568 (Invitrogen, cat#T20914) prepared according to manufacturer instruction with predetermined dilutions. Finally, sections were incubated with anti-CK19 (Abcam, cat#ab52625, 1ug/ml) for 5 hours, followed by 60 minutes incubation with biotinylated goat anti- rabbit IgG (Vector, cat#PK6101) at 1:200 dilution. The detection was performed with Streptavidin-HRP D (part of DABMap kit, Ventana Medical Systems), followed by incubation with Tyramide Alexa 647 (Invitrogen, cat#T20936) prepared according to manufacturer instruction with predetermined dilutions. After staining slides were counterstained with DAPI (Sigma Aldrich, cat#D9542, 5 ug/ml) for 10 min and coverslipped with Mowiol.
Digital Image Processing and Analysis
Tissue microarrays (TMAs) for each immunohistochemical stain were individually digitally scanned using Pannoramic Flash (3DHistech, Budapest, Hungary) with a 40x/0.95NA objective. Image registration and alignment was performed using Image J (NIH, Bethesda, MD). ROIs were drawn for each core and then transferred to others using CaseViewer (3DHistech). Each region from each scan was exported as tiff images at full resolution (0.243um/pixel). Images of the same core from multiple scans were stacked together and aligned using Linear Stack Alignment with SIFT algorithm from FIJI/ImageJ (NIH, Bethesda, MD). Once aligned, the RGB images were color deconvoluted to separate AEC and hematoxylin stainings and converted into 8-bit pseudo-fluorescent images. Individual immunohistochemical targets were sequentially assigned to fluorescent channels and subsequently merged. Hematoxylin staining was used to segment and count the number of nucleated cells in the core. After processing the images using background subtraction and median filter, staining was thresholded and split using Biovoxxel Watershed Irregular Features plugin. ROIs were drawn around each cell and matched to the signals from all other AEC stainings to count the number of positive cells for each staining. Total tissue area was measured by setting a very low threshold for hematoxylin images. For quantification, all nucleated cells were identified, followed by an intensity-based threshold determination of each target to identify positive cells. Triplicate cores were quantified followed by determination of the median number of cells per square mm of tissue (Image J, NIH, Bethesda MD). Quantification of cells detected using immunofluorescence was performed in a similar fashion. CD8+ T cells were defined as CD3+CD8+ cells, cytolytic CD8+ T cells as CD3+CD8+Granzyme-B+ cells, mature dendritic cells as DC-LAMP+ cells, regulatory T cells as CD3+FoxP3+ cells, macrophages as CD68+ cells, regulatory T cells as CD3+FoxP3+ cells, CD4+ T cells as both CD3+CD8- and CD4+ cells, and B cells as CD20+ cells.
Nucleic Acid Extraction
MSKCC PDAC Cohort:
10μm slides were cut from OCT embedded frozen tumor and matched normal tissues. Sections were brought to containers with 70% ethanol for OCT removal. Following OCT removal, specimens were dissected for subsequent DNA and RNA extraction. For whole exome sequencing, tumor islands of > 70% cellularity were macrodissected based on expert PDAC pathologic review, and DNA was extracted using the DNA Easy kit. Total RNA from Fresh Frozen OCT embedded tissues was extracted using TRIzol RNA Isolation Reagents (cat# 15596–026, Life Technologies).
Rapid Autopsy cohort:
Genomic DNA was extracted using standard phenol-chloroform extraction followed by precipitation in ethanol. Quantification was done by LINE assay. Tissue samples confirmed to be of high quality and sufficient concentration were used for subsequent whole exome sequencing.
Transcriptome Analysis
Extracted RNA was qualified on Agilent BioAnalyzer and quantified by fluorometry (Ribogreen). Preparation of RNA for whole transcriptome expression analysis was done using the WT Pico Reagent Kit (Affymetrix, CA, USA). Reverse transcription was initiated at the poly-A tail as well as throughout the entire length of RNA to capture both coding and multiple forms of non-coding RNA. RNA amplification was achieved using low-cycle PCR followed by linear amplification using T7 in vitro transcription (IVT) technology. The cRNA was then converted to biotinylated sense strand DNA hybridization targets. Prepared target was hybridized to GeneChip® Human Transcriptome Array 2.0 (Affymetrix, CA, USA). Wash and scan was done using the GeneChip® Hybridization, Wash and Stain Kit using a Fluidics Station 450/250. Arrays were scanned using the GeneChip® Scanner 3000. Data analysis for the array was done using Affymetrix Expression Console™ Software (SST-RMA algorithm to summarize the signal from array probesets). A dendritic cell signature was defined as previously described, using the genes CCL13, CCL17, CCL22, PPFIBP2, NPR1, HSD11B1, and CD209/DC-SIGN4. Patient subsets were randomly selected to undergo transcriptomic profiling.
T Cell Receptor Vβ Sequencing
Frozen tumor (short term n=30, long term n=30) and paired non-tumor adjacent pancreas tissue (short term n=30, long term n=30) samples were processed (Adaptive Biotechnologies, Seattle, USA). Genomic DNA was extracted according to the manufacturer’s instructions (QIAsymphony, Qiagen, Germany). The quantity and quality of extracted DNA was verified prior to sequencing. Using a standard quantity of input DNA, the TCR Vβ CDR3 regions were amplified and sequenced using the survey multiplexed PCR ImmunoSeq assay. The ImmunoSeq platform combines multiplex PCR with high throughput sequencing to selectively amplify the rearranged complementarity determining region 3 (CDR3) of the TCR, producing fragments sufficiently long to identify the VDJ region spanning each unique CDR3. 45 forward primers specific for TCR Vβ gene segments and 13 reverse primers specific to TCR Jβ gene segments were used (Adaptive Biotechnologies). Read lengths of 156bp were obtained using the Illumina HiSeq System. The ImmunoSeq assay allows for quantitative assessment of both total and unique TCRs in a sample, as it uses a complete synthetic repertoire of TCRs to establish an amplification baseline and adjust the assay chemistry to correct for primer bias. Barcoded, spiked-in synthetic templates were also used to measure and correct for sequencing coverage and residual PCR bias. Output data were then filtered and clustered using the relative frequency ratio between similar clones and a modified nearest-neighbour algorithm, to merge closely related sequences and remove PCR and sequencing errors. The number of rearranged TCRs per diploid genome in the input material (total number of T cells) was estimated as previously described22. Data were analyzed using the ImmunoSeq analyzer tool. The frequency of T cells was determined as the total number of T cells per total number of sequenced cells in the input material. A T cell clone was defined as a T cell with a unique TCR Vβ CDR3 amino acid sequence. Clonality was defined as (1-normalized entropy). Normalized entropy was calculated as the Shannon entropy divided by the logarithm of the number of unique productive (exonic) TCR sequences. Shannon entropy equals the clonal abundance of all productive TCR sequences in the input material. For in vitro stimulated cells, clones with identical amino acid sequences that expanded > 2 fold on day 21 compared to day 0, and fulfilled the Fisher’s Exact test and Storey’s Q value for false discovery rate were defined as expanded. Data analysis was performed using Adaptive Biotechnologies ImmunoSeq Analyzer (Analyzer 3.0, Seattle, Washington).
Whole Exome Sequencing
For all MSKCC PDAC patients, 500ng of genomic DNA was fragmented to a target size of 150 to 200 bp on the Covaris LE220 system. Barcoded libraries (Kapa Biosystems) were subjected to exon capture by hybridization using the SureSelect Human All Exon 51MB V4 kit (Agilent). DNA libraries were subsequently sequenced on a HiSeq 4000 (Illumina) in a Paired End 100/100, using the TruSeq SBS Kit v3 (Illumina) with a target coverage of 150X for tumor samples and 70X for matched normal (MSKCC Center for Molecular Oncology). Sequence data were demultiplexed using CASAVA, and after removal of adapter sequences using cutadapt (v1.6), reads were aligned to the reference human genome (hg19) using the Burrows-Wheeler Alignment tool (bwa mem v0.7.12). Duplicate-read removal, InDel realignment and Base Quality Score Recalibration were performed using the Genome Analysis Toolkit (GATK) according to GATK best practices, as previously described6. Variants were identified on processed data using Mutect, Mutect rescue (SNPs) and HaplotypeCaller (insertions/deletions) (Supplementary Data 2). A mean unique sequence coverage of 167.45X was achieved for tumor samples and 84.75 for normal samples. All MUC16 mutations were manually reviewed by 3 investigators using the Integrated Genomics Viewer (IGV) v2.3.72. Whole genome and whole exome sequencing for ICGC19 patients has been previously described. For all ICGC and Rapid Autopsy samples, BAM files were re-processed and mutations identified as per the above outlined MSKCC protocol. Depth of sequencing for the rapid autopsy samples ranged from 150X to 250X.
HLA Typing
HLA typing for PDAC patients was performed in silico using the tool Short Oligonucleotide Analysis Package-HLA (SOAP, http://soap.genomics.org.cn/SOAP-HLA.html).
Somatic Mutation Immunogenicity Predictions
MSKCC Pipeline:
Immunogenicity of somatic mutations was estimated using a previously described bioinformatics tool called NASeek6. Briefly, NASeek is a computational algorithm that first translates all mutations in exomes to strings of 17 amino acids, for both the wild type and mutated sequences, with the amino acid resulting from the mutation centrally situated. Secondly, it evaluates putative MHC Class-I binding for both wild type and mutant nonamers using a sliding window method using NetMHC3.4 (http://www.cbs.dtu.dk/services/NetMHC/) for patient-specific HLA types, to generate predicted binding affinities for both peptides. NASeek finally assesses for similarity between nonamers that were predicted to be presented by patient-specific MHC Class-I. All mutations with binding scores below 500 nM are defined as neoantigens. As the MSKCC pipeline was, on average, more stringent with respect to the number of neoantigens identified (in comparison to the pVAC-Seq pipeline below), all neoantigen predictions were performed with the MSKCC pipeline unless otherwise specified.
pVAC-Seq Pipeline:
As an independent algorithm to identify neoantigens, we used the pVAC-Seq pipeline7 with the NetMHCpan binding strength predictor(< 500nM binding strength). As recommended, we used the variant effect predictor from Ensembl23 to annotate variants for downstream processing by pVAC-Seq.
Neoantigen Fitness Modeling
The fitness of a clone is defined as
where Nα is the effective population size of tumor clone α and Fα is the fitness of clone α. We assume that the fitness effects due to the immune system are separable from other tumor fitness effects, that is, , where denotes the contribution to fitness due to selection on neoantigens and denotes contributions from other factors, such as classical tumor driver mutations. our model assumes the two components are separable, which is essentially equivalent to assuming targeting of neoantigens is largely emanating from passenger mutations. We test the hypothesis that due to T-cell mediated immune recognition, for some tumors, the deleterious effects of immune pressure due to mutation derived neoantigens can become a dominant fitness effect, either counteracting or substantially slowing the tumor’s growth rate.
In general, the predicted effective total tumor population size at time τ , denoted as n(τ), is
where N(0) = Σα Nα (0) is the initial total effective population size of all clones within the tumor, and 𝑋α (0) = Nα(0)/N(0) is frequency of clone 𝛼. . The initial frequency of clone 𝛼 is the size of a clone estimated from a tumors phylogenetic tree, using the PhyloWGS software (https://github.com/morrislab/phylowgs) 24. For the tumors in our cohort there was not a discernable difference in the distributions of pancreatic cancer driver mutations across clones. As a result we assume Therefore,
We rank samples according to the value of (τ), based only on their neoantigen-immune interactions. This is equivalent to the assumption that 𝑒F0τ also does not vary as considerably across samples when compared with As a result
when considered across our cohort, we use the immune component as a basis for ranking. Our hypothesis is that there are tumors where typically and the deleterious effects of neoantigen recognition sufficiently counterbalance the tumor’s growth. By ranking tumors according to (τ) we therefore test whether tumors with the strongest deleterious effects due to neoantigen fitness have better survival.
For a given neoantigen with sequence s we calculate R as the probability that neoantigen s is recognizable by the T cell receptor repertoire. We do so by calculating the probability a neoantigen sufficiently aligns to an epitope e from the IEDB via a thermodynamic model utilizing the alignment score between the two peptides, |s,e |:
where a represents the horizontal displacement of the binding curve and k sets the slope of the curve at a. The partition function then becomes
The set of known positive epitopes were derived from the Immune Epitope Database, restricting the search to all human infectious disease, class-I restricted targets with positive immune assays (http://www.iedb.org/). As the peptides in IEDB can change over time, the version of IEDB utilized in our study is included (Supplementary Data 2). The alignments between all neoantigens and IEDB epitope sequences are found with blastp algorithm using BLOSUM62 matrix (gap opening penalty=−11, gap extention penalty=−1). For the identified alignments the alignment scores are then computed with Biopython Bio.pairwise2 package (http://biopython.org).
The amplitude due to relative MHC dissociation constants between a neoantigen and its wildtype counterpart is approximated here by the ratio of their inferred MHC binding affinities, which are inferred for neoantigens and their wildtype counterpart using NetMHC3.4 (http://www.cbs.dtu.dk/services/NetMHC/) as described above. We use the standard cutoff for Kd MT, the mutant dissociation constant, used in the literature, that is Kd MT < 500 nM. For a given neoantigen, the quantity 𝐴×𝑅 is referred to as a neoantigen’s recognition potential, and is a measure of neoantigen quality in regard to T cell receptor recognition. Fitness due to T cell mediated neoantigen recognition within a clone is defined as
where i is an index running over neoantigens within a clone. That is, within a clone the maximal product of the amplitude Ai and the recognition probability fitness Ri for a neoantigen. As alternative hypothesis, fitness in the neoantigen load hypothesis defined as where Lα is the simple number of neoantigens in clone α. For all cases, we computed the neoantigen load without clonal phylogeny, which was the standard benchmark, and the neoantigen load with clonal phylogeny, by taking into account the effective size of clones in which neoantigens were contained. We also compared our results to using the wild type recognition potential alone, in which case our MHC amplitude was one, and the fitness model without clonality, which essentially just scores the best neoantigen across the tumor.
We split samples by the median value of the cohort, with samples below this value designated as a low fitness group (Neoantigen QualityHigh group), and those above as a high fitness group (Neoantigen QualityLow group). We then compared survival for high versus low quality groups, expecting high quality tumors to be related to longer patient survival times. Our model has three parameters: 𝑎, 𝑘 and τ. We observe significant separation of patients at a sufficiently probability binding function - we therefore set the slope parameter 𝑘=1. We report values for the shift and time parameters, a and τ, which optimized survival, as quantified by the log-rank test score using the lifelines software package (https://lifelines.readthedocs.io/en/latest/). To test the stability of this choice, we derived the optimal value for subsampled datasets, with subsampling frequencies of 0.5, 0.7, and 0.9. The optimal parameters obtained on the full dataset, 𝑎 = 26 and τ ∈ [0.02,0.04] were the most frequent choice for all subsampling frequencies (as shown on the distribution of optimal parameters in Extended Data Figure 7).
We repeated the same analysis on the larger ICGC cohort with 166 patients. The optimal parameters obtained on the full dataset were a = 23 and τ ∈ [0.19,0.21]; however the optimum depended only marginally on τ, raising significant patient segregation for a very broad interval of values (in particular at τ ∈ [0.02,0.04] , optimal for the MSKCC cohort, we obtain P<0.01, see Extended Data Figure 7)We observe that the horizontal displacement parameter a is lower than in the MSKCC cohort. We attribute this trend to the difference in the survival time distribution in the two cohorts and the MSKCC cohort containing extreme LTSs, with likely “higher quality” neoantigens.
In Vitro T Cell Assays
Fresh blood was collected from seven PDAC LTSs whose tumors were identified based on whole exome sequencing and in silico predictions to harbor neoantigens. Peripheral-blood mononuclear cells were isolated by density centrifugation over Ficoll-Paque Plus (GE Healthcare). Peptides were generated for immunodominant neoantigens as predicted by the neoantigen quality algorithm (the neoantigen with the maximum quality score within a tumor, driven by maximal TCR recognition probability was defined as the immunodominant neoantigen), MUC16 neoantigens, and the corresponding WT nonamers (Peptide 2.0, VA, USA, Supplementary Table 2). In vitro peptide stimulation was performed as described with minor modifications6. Briefly, 1 × 10⁶ PBMCs were cultured with mutant or WT peptides (10ug/ml) on day 1. IL-2 (50U/ml) and IL-15 (10ng/ml) were added on day 2 and every subsequent 2–3 days. Mutant and WT peptides were added to respective cultures on days 7, and day 14 for second and third rounds of restimulation. On day 21, cells were restimulated in the presence of peptide for 5 hours and cells were subsequently stained as per manufacturer’s instructions or subject to sequencing. A peptide pool of 23 class-I-restricted viral peptides from human CMV and influenza virus (CEF, Cellular Technology Limited) served as a positive control (data not shown). Normalized expansion on day 21 of culture was defined as (absolute CD8+ T cell expansion Day 21 - absolute CD8+ T cell expansion Day 0)/(absolute CD8+ T cell expansion Day 0).
Flow Cytometry
Fresh blood and tumor samples from 6 individual patients undergoing elective surgery at Memorial Hospital were collected. Informed consent was obtained according to a Memorial Hospital Institutional Review Board approved protocol. Blood was drawn at the time of surgery, and peripheral-blood mononuclear cells were isolated by density centrifugation over Ficoll-Paque Plus (GE Healthcare). Tumor and draining lymph node tissues were processed immediately after removal from the patient and single-cell suspensions were prepared. To assess if T cells bind in silico predicted neoantigen-HLA complexes, T cells of peripheral blood mononuclear cells (PBMCs) from HLA-specific healthy donors (Precision For Medicine, Frederick, MD) were assessed for binding to MUC16-neoantigen-MHC multimers. MUC16-MHC-FITC multimers were designed to HLA-B0801 (Immudex, Copenhagen, Denmark) with nonamer peptide sequences derived based on mutated MUC16 sequences identified on whole exome sequencing that were in-silico predicted to be immunogenic. Single cell PBMC suspensions were surface stained for anti-human CD45, CD3, CD56, CD8, CD4, CD107a, and MHC-multimers according to manufacturer’s instructions. Human-specific antibodies used in all flow cytometric phenotyping included CD45 (clone HI30, BioLegend), CD3 (clone OKT3, BioLegend), CD4 (clone SK3, BD Biosciences), CD8 (clone SK1, BioLegend), CD56 (clone B159, BD Biosciences), CD69 (clone FN50, BD Biosciences), CD19 (clone SJ25C1, BD Biosciences), PD1 (clone MIH4, BD Biosciences), CD45RA (clone HI100, BD Biosciences), CD45 RO (clone UCHL1, BD Biosciences), CD56 (clone B159, BD Biosciences) and CD107a (clone H4A3, BD Biosciences). Flow cytometry was performed on an LSRFortessa (BD Biosciences) and data were analyzed using FlowJo Software (Tree Star).
Plasmids and Transfection
PhrGFP II-C vector (Stratagene, LaJolla, CA) expressing human wtMUC16c354N206-GFP fragment a kind gift of the Spriggs lab. A point mutation at position R15C in C-terminal portion of wtMUC16 was introduced using QuikChange II XL Site-Directed Mutagenesis Kit (Agilent Technologies) and validated by sequencing. HEK293T were transiently transfected with PhrGFP II-C vector (empty vector), wtMUC16c354N206-GFP, mtMUC16R16C-GFP using Lipofectamine 3000 (Invitrogen) according to the manufacturer’s instructions. Protein extracts from transiently transfected cells were analyzed by western blot (clone 4H11, anti-MUC16-carboxy-terminal monoclonal antibody25) and beta-actin-HRP antibody (Sigma Aldrich). Transfected cells were also analyzed by immunocytochemistry (clone 4H11).
Statistics
Comparisons between two groups were performed using unpaired two-tailed Mann-Whitney test (unpaired samples), paired two-tailed Mann Whitney test (paired samples), and two-tailed students t-test (normally distributed parameters). Multiple samples were compared using Kruskal-Wallis test (non-grouped) and ANOVA with Tukey’s post-test for multiple comparisons (grouped). Survival curves were compared using log-rank test (Mantel-Cox). Categorical variables were compared using chi-square test. All comparison groups had equivalent variances. Specific clonal expansion on day 21 compared to day 0 (> 2 fold expansion by Fisher’s Exact test and Storey’s Q value for false discovery rate) was assessed by TCRVβ sequencing. In Figure 3D, we tested whether the number of clones expanding under more than one condition (mutant, cross reactive, tumor) is significantly different than that would be observed by chance using Poisson family saturated log-linear models with the canonical link function and the corresponding p-values for the third-degree term in these models. We used a hypothetical value of 107 for total number of clones in the blood for this calculation. The glm function in R version 3.4 was used for fitting these models. P<0.05 was considered to be statistically significant. Data analysis was performed using statistical software (Prism 7.0, GraphPad Software; Cox regression using STATA 13.1).
Data Availability
Data presented in this study can be downloaded from https://dcc.icgc.org/repositories under the identifier PACA-AU. Transcriptomic data is available under Gene Expression Omnibus accession number 89997. Source data are provided for all experiments, which includes figures 1b, 1c, 1e, 2d, 3a-d, 4a-e, and Extended Data Figures 2a-c, 3a, 3c, 3e, 4c, 6b, 8e, 9a-f, 10a. All other data are available from the authors on reasonable request.
Code Availability
The data (Supplementary Table 1), the computational algorithm and softwares used, (Extended Data Figure 7), and the source code (Supplementary Data 2) allowing for reproduction of the neoantigen quality evaluation in this manuscript are included as indicated above.
Extended Data
Extended Data Figure 1|. Clinicopathologic characteristics of the MSKCC cohort.
a, Overall survival and patient overlap of short and long term survivors in tissue microarray, whole exome sequencing, TCRVβ sequencing, and bulk tumor transcriptomic profiling cohorts. b-g, Clinicopathologic characteristics of patients in tissue microarray, transcriptome, TCR sequencing, whole exome sequencing, matched primary-metastatic, and very long term survivor cohorts. In b-e, *= three patients with metastases noted on final pathology (one liver metastasis, one metastasis to small bowel/mesentery, one splenic metastasis). n=biologically independent samples in individual patients. P values were determined using log-rank test (a), and two-sided Fisher’s exact test (gender, tumor location, pN, pM, margin, chemotherapy), two-sided Chi-square test (procedure, pathological stage, pT, adjuvant treatment) and unpaired, two-tailed student’s t test (age) (b-g).
Extended Data Figure 2|. Long term PDAC survivors display enhanced intratumoral T cell immunity.
a, Representative sequential immunohistochemical staining of a single short term and a single long term core tumor section (left). Sections bounded by black rectangles (100X) are magnified to 275X (right) for each core section. (top right) Representative merged images of multiplexed immunohistochemistry are shown. Red rectangular sections are enlarged to 50X. CK19 stains tumor cells. Arrows indicate CD3+CD8+Granzyme-B+ T cells. (middle right) Immunofluorescent quantification of CD8+ and CD4+cells in tumor tissue microarrays of short and long term survivors. Slides used were cut from separate sections of the block as those used for sequential immunohistochemistry (Figure 1b, Extended Data Figure 2a). (bottom right) Quantification of multiplexed immunophenotyping as shown in Extended Figure 2a (left, and top right). All immunofluorescent and immunohistochemical staining was repeated independently in triplicates for each patient. In (a), short term n=45, long term n=51. b, Bulk tumor transcriptomic immune profiling in short and long term survivors. DC signature genes include CCL13, 17, 22, PPFIBP2, NPR1, HSD11B1, CD209/DC-SIGN103. c, Flow cytometric gating strategy to phenotype human T cells (n=7). First plot is pre-gated on live cells, followed by CD45+, and CD3+CD56- cells. Values indicate percentage of cells within the red boxes, and are gated based on isotype controls. d, Top: Overall survival of patients who did or did not receive adjuvant chemotherapy (adjuvant chemotherapy+/− respectively, top left), and of patients with tumors harboring greater or less than the median number of CD3-CD8-GranzymeB triple positive cells (CD3-CD8-GranzymeBHi/Low respectively, top right). Overall survival of all four groups shown in bottom. Table shows univariate and multivariate Cox regression analysis of clinicopathologic features, adjuvant chemotherapy, and CD3-CD8-GranzymeB density associations with overall survival. Horizontal bars, median values; error bars, mean ± SEM. n=biologically independent samples in individual patients. P values were determined two-tailed Mann Whitney test (a, b), one-way ANOVA (c), and log-rank test (d).
Extended Data Figure 3|. Neoantigen quantity and CD8+ T cell infiltrate identify long term pancreatic cancer survivors.
a, (left) Number of nonsynonymous, missense, and neoantigenic mutations per patient in the MSKCC cohort. Tick marks on the x-axis correspond to individual tumors. (right) Oncoprint demonstrating the frequency of oncogenic driver gene mutations in the MSKCC cohort. b, Overall survival of patients with tumors harboring greater than the median number of neoantigens (NeoantigenHi), and greater than the median intratumoral T cell repertoire polyclonality (PolyclonalHi), compared to all other patients (Rest). Neoantigens were determined using the MSKCC (top) and the pVAC-Seq (bottom) neoantigen prediction pipelines. c. Number of neoantigens per tumor as determined by the MSKCC and pVAC-Seq neoantigen calling pipelines (left). Tick marks on the x-axis correspond to individual tumors. Correlation matrix of neoantigens as determined by the MSKCC and pVAC-Seq neoantigen calling pipelines (right).Solid red line indicates line of best fit, dotted lines indicate 95% confidence intervals. d, Top: Overall survival of patients with tumors harboring greater or lesser than the median number of neoantigens (NeoantigenHi/Low) and CD3-CD8 double positive cells (CD3-CD8Hi/Low), compared to all other patients (Rest) (top left). Patients who did or did not receive adjuvant chemotherapy (adjuvant chemotherapy+/−, respectively) (top right), and all four groups (bottom) are also shown. Table shows univariate and multivariate Cox regression analysis of the associations of clinicopathologic features, adjuvant chemotherapy, and neoantigen-CD3-CD8 number with overall survival. e Distribution of tumors with high and low quality neoantigens in NeoantigenHi CD3-CD8Hi long term pancreatic cancer survivors compared to all other patients (Rest). n = biologically independent samples in individual patients. P-values were determined using log-rank (b, d), and Chi-square (e) tests.
Extended Data Figure 4|. Unique genomic features alone do not identify long term survivors.
a, Overall survival of patients with tumors harboring greater or lesser than the median number of neoantigens (NeoantigenHi/Low), CD3-CD8 double positive cells (CD3-CD8Hi/Low), polyclonality (PolyclonalHi/Low), mutations (MutationHi/Low), and CD4 single positive cells (CD4Hi/Low). b, Oncoprint demonstrating no difference in the frequency of oncogenic driver mutations in short and long term tumors. c, No difference in the number of nonsynonymous, missense, and immunogenic mutations (neoantigens) in short and long term PDAC tumors. d, Overall survival stratified by mutations in ARID1A, KRASQ61H, RBM10, and MLL-related genes (MLL, MLL2, MLL3, MLL5). Horizontal bars, median values. n = biologically independent samples in individual patients. P-values were determined using log-rank test (a, d).
Extended Data Figure 5|. Neoantigen immune fitness models.
a, Comprehensive flowchart of neoantigen quality identification pipeline. Software programs utilized for each step are indicated in bold, colored text. Mathematical formulae for calculation of individual components of neoantigen quality are defined in Methods. All software components of the pipeline are published and/or publically available as indicated in italics above. b, (top) Schematic of neoantigen immune fitness models. Each circle represents a tumor clone in an evolutionary tree. Clones in both models are identical with respect to the number of mutations and neoantigens. Numbers represent hypothetical neoantigens gained in a successive tumor clone. Shades of red indicate immunogenicity of each clone, as ascribed by the two models, namely neoantigen quality or neoantigen quantity. (bottom) Parameters defining the quality score in the quality model (1–3). In (1), amino acid sequences of a hypothetical wild type (WT) epitope, tumor neoepitope, and a homologous microbial epitope are shown. Yellow highlights the changing amino acid between the WT and tumor sequence as a consequence of a tumor specific mutation. The amino acids in red indicate homology between the tumor neoepitope and the microbial epitope.
Extended Data Figure 6|. Neoantigen quality is independently prognostic of survival.
a, Overall survival of patients whose tumors displayed high compared to low neoantigen quality (Neoantigen QualityHi/Low) (top left). Overall survival of patient who did or did not receive adjuvant chemotherapy (top right). Overall survival of all four groups is shown at the bottom. Neoantigen quality defined by pipeline and schema as defined in Extended Data Figure 5a, b. Table shows univariate and multivariate Cox regression analysis of the associations of clinicopathologic features, adjuvant chemotherapy, and neoantigen quality with overall survival. Data include all patients in the whole exome sequencing MSKCC cohort. b, Number of nonsynonymous, missense, and neoantigenic mutations per patient in the ICGC cohort (n=166). c, Overall survival of patients in the ICGC cohort whose tumors displayed high compared to low neoantigen quality (Neoantigen QualityHi/Low) (top left). Overall survival of patients in the ICGC cohort stratified by adjuvant chemotherapy administration (top right). Overall survival of all four groups shown in bottom. Neoantigen quality defined by pipeline and schema as defined in Extended Data Figure 5a, b. Table shows univariate and multivariate Cox regression analysis of the associations of clinicopathologic features, adjuvant chemotherapy, and neoantigen quality with overall survival in the ICGC cohort. n = biologically independent samples in individual patients. P-values were determined using log-rank test (a, c).
Extended Data Figure 7|. Stability of neoantigen quality model parameters on subsampled cohorts and prognostic dependence of neoantigen quality on infectious disease derived peptides.
Parameters of the neoantigen fitness quality model for a, the MSKCC cohort b, and the ICGC cohort (left). Log-rank test score landscape as a function of the model parameters, the horizontal alignment score displacement a, and the characteristic time τ, the significance of the score is denoted in the legend (right). Two dimensional histograms showing distributions of optimal parameters obtained on subsampled datasets with 50, 70, and 90% of patients left, over 500 iterations of subsampling at each frequency. c, Overall survival of patients in the MSKCC and ICGC cohort whole tumors displayed high compared to low neoantigen quality (Neoantigen QualityHi/Low) Neoantigen quality was calculated using alignment to immunogenic infectious disease-derived IEDB peptides (microbial peptides) or using alignment to immunogenic non-infectious disease-derived allergy/autoimmune peptides in the IEDB database (non-microbial peptides). n = biologically independent samples in individual patients. P-values were determined using log-rank test (c).
Extended Data Figure 8|. Predicted MUC16 neoantigens are recognized by the human TCR repertoire.
a, PBMCs pulsed with no peptide, control WT control peptide (WT), cross-reactive peptide (Cross Reactive), or high quality neopeptide (Mutant). Representative gating strategies for CD8+ T cell expansion, and degranulation are shown. b, PBMCs pulsed with no peptide, MUC16 neopeptides (Mutant), and control WT control peptide (WT). Representative gating strategies for CD8+ T cell expansion are shown. c, Representative gating strategy to identify CD8+ T cells in peripheral blood of healthy donors (top panel). Identification of CD8+ T cells in healthy donors reactive to unique MUC16 neoepitopes predicted to bind to the B∗0801 HLA-allele, using MUC16-neoepitope-HLA multimers. Quantification of all healthy donors (Neoepitope #1, 2 - n=5) is shown (right). Multimer staining is shown on the x-axis, CD8 is shown on the y-axis. Peptide information is provided in Supplementary Table 2. n = biologically independent samples in individual patients. Horizontal bars, median values; error bars, mean ± SEM. P-values were determined using one-way ANOVA (c).
Extended Data Figure 9|. Long term survivors do not display differences in MUC16 mutations, transcriptional regulators or downstream targets of MUC16, or differences in other mucins and tissue expression antigens.
a, The frequency of MUC16 mutations in short and long term PDAC tumors. Lollipop plot showing location of MUC16 mutations and neoantigens in short and long term pancreatic cancer survivors. b, (left) Bulk tumor MUC16 mRNA, and (middle) protein expression by immunohistochemistry. Immunohistochemical staining was repeated independently in triplicates for each patient. (right) MUC16 mutant allele frequency in non-hypermutated tumors with MUC16 mutations. c, (left) Frequency of patients with MUC16 neoantigens in MSKCC and ICGC cohorts. (middle) Frequency of patients with neoantigens in genes recurrently harboring neoantigens in >5% of patients in both MSKCC and ICGC cohorts. (right) Genes most frequently harboring neoantigens in the MSKCC cohort as determined by pVACSeq. Frequency of patients (y-axis) and raw numbers (above bar graphs) are indicated. d, mRNA expression of transcriptional activators of MUC16 (top left), mediators implicated in MUC16 dependent tumor progression (top right), and mRNA (bottom left) and protein (bottom right) of tissue expression antigens MUC1, MUC4, WT1, mesothelin, and Annexin A2 in short and long term tumors. WT1 protein was undetectable in both short and long term survivors. n=15 per group in top left, top right, and bottom left; short term n=45, long term n=51 in bottom right. e, MUC16 mRNA and protein expression in MUC16 non-mutated (WT; n=18 (top), n=20 (bottom)) and mutated (mutant; n=10 (top), n=9 (bottom)) tumors. f, TCRVβ sequencing of T cell product following peripheral blood T cells pulse with MUC16 neopeptides as in Figure 4e. Brown open circles – stable/contracted clones with mutant neopeptide; blue open circles – expanded clones with mutant neopeptide; red solid circles - expanded clones with mutant neopeptide detected in archival primary tumors. Arrows = clones in archival primary tumors with rank frequencies. Venn diagrams = clonal overlap in respective compartments. Horizontal bars, median values; error bars, mean ± SEM. n = biologically independent samples in individual patients. P-values were determined using two-tailed Mann Whitney and Students t-tests (b), Chi-square tests (c), and as described in the methods (f).
Extended Data Figure 10|. MUC16 mutations do not alter tumor cell-intrinsic MUC16 protein expression.
a, Representative immunohistochemical staining (left) and quantification (right) of MUC16 expression in tissue microarrays of short and long term pancreatic cancer survivors as assessed using three independent anti-MUC16 antibodies. Ab#1– clone EPSISR23, purchased from Abcam; Ab# 2 – polyclonal, purchased from Abcam ab133419; Ab#3 – clone 4H1125. Each open circle represents the median expression of independent immunohistochemical staining performed in triplicates for each patient. b, Western blot (top) and immunocytochemistry (bottom) of untransfected (−), empty vector (vector), MUC16 wild type (MUC16 WT), and MUC16 mutant (MUC16 R15C) HEK293T cells. The top left blot was probed with anti MUC16 specific antibody (clone 4H1125) and the right blot with anti b-actin. Red rectangle indicates MUC16 specific band. All bottom cells were probed with anti MUC16 antibody (clone 4H1125). The inserted mutation was identical to a neoantigenic MUC16 mutation (Extended Data Figure 9a, Pt. 1). Data representative of two independent experiments with similar results. c, MUC16 immunohistochemistry on two long term pancreatic cancer survivors with MUC16 neoepitopes in primary resected tumors. Areas in rectangular low power fields are magnified on the right. Immunohistochemical staining was performed independently in triplicates for each patient in tissue microarrays, and confirmed with immunohistochemical staining on whole tumor sections (shown). Horizontal bars, median values; error bars, mean ± SEM. n = biologically independent samples in individual patients. P-values were determined using two-tailed Students t-tests (a).
Supplementary Material
Acknowledgments
We thank Alexander Rudensky, Alexandra Snyder-Charan, Curtis Callan, Yuval Elhanati, Zachary Sethna, Christine Crabtree, Paula Garcia, Maria Singh, Anjuli McNeil, Dana Haviland, Jerry Melchor, and Joyce Tsoi for insightful discussions, technical, and editorial assistance. This work was supported by NIH R01DK097087–01 Pancreatic Cancer Action Network-AACR Research Acceleration Network Grant (S.D.L), P30 CA008748–50S4 administrative supplement (S.D.L, V.P.B), Suzanne Cohn Simon Pancreatic Cancer Research Fund (S.D.L.), NCI K12CA184746–01A1 (V.P.B), Damon Runyon Clinical Investigator Award (V.P.B), Stand Up to Cancer, Lustgarden Foundation, and the National Science Foundation (M.Ł, J.D.W, B.D.G), the V Foundation (V.P.B, M.Ł, J.A.M, J.D.W, B.D.G), the Phil A. Sharp Innovation Award (B.D.G, J.D.W), and the Parker Institute for Cancer Immunotherapy (D.K.W and C.I.O.C). Services by the Integrated Genomics Core were funded by the NCI Cancer Center Support Grant (P30 CA08748), Cycle for Survival, and the Marie-Josée and Henry R. Kravis Center for Molecular Oncology.
Author information
References
- 1.Ino Y et al. Immune cell infiltration as an indicator of the immune microenvironment of pancreatic cancer. Br J Cancer 108, 914–923 (2013). [DOI] [PMC free article] [PubMed] [Google Scholar]
- 2.Hiraoka N et al. Intratumoral tertiary lymphoid organ is a favourable prognosticator in patients with pancreatic cancer. Br J Cancer 112, 1782–1790 (2015). [DOI] [PMC free article] [PubMed] [Google Scholar]
- 3.Remark R, Merghoub T & Grabe N In-depth tissue profiling using multiplexed immunohistochemical consecutive staining on single slide. Science 1, aaf6925–aaf6925 (2016). [DOI] [PMC free article] [PubMed] [Google Scholar]
- 4.Bindea G et al. Spatiotemporal Dynamics of Intratumoral Immune Cells Reveal the Immune Landscape in Human Cancer. Immunity 39, 782–795 (2013). [DOI] [PubMed] [Google Scholar]
- 5.Gros A et al. Prospective identification of neoantigen-specific lymphocytes in the peripheral blood of melanoma patients. Nat Med 22, 433–438 (2016). [DOI] [PMC free article] [PubMed] [Google Scholar]
- 6.Rizvi NA et al. Cancer immunology. Mutational landscape determines sensitivity to PD-1 blockade in non-small cell lung cancer. Science 348, 124–128 (2015). [DOI] [PMC free article] [PubMed] [Google Scholar]
- 7.Hundal J et al. pVAC-Seq: A genome-guided in silico approach to identifying tumor neoantigens. Genome Med 8, 11 (2016). [DOI] [PMC free article] [PubMed] [Google Scholar]
- 8.Witkiewicz AK et al. Whole-exome sequencing of pancreatic cancer defines genetic diversity and therapeutic targets. Nat Commun 6, 6744 (2015). [DOI] [PMC free article] [PubMed] [Google Scholar]
- 9.Zitvogel L, Ayyoub M, Routy B & Kroemer G Microbiome and Anticancer Immunosurveillance. Cell 165, 276–287 (2016). [DOI] [PubMed] [Google Scholar]
- 10.Luksza M & Lässig M A predictive fitness model for influenza. Nature 507, 57– 61 (2014). [DOI] [PubMed] [Google Scholar]
- 11.Verdegaal EME et al. Neoantigen landscape dynamics during human melanoma-T cell interactions. Nature 536, 91–95 (2016). [DOI] [PubMed] [Google Scholar]
- 12.Chekmasova AA et al. Successful eradication of established peritoneal ovarian tumors in SCID-Beige mice following adoptive transfer of T cells genetically targeted to the MUC16 antigen. Clin Cancer Res 16, 3594–3606 (2010). [DOI] [PMC free article] [PubMed] [Google Scholar]
- 13.Morgado M et al. Tumor necrosis factor-α and interferon-γ stimulate MUC16 (CA125) expression in breast, endometrial and ovarian cancers through NFκB. Oncotarget 7, 14871–14884 (2016). [DOI] [PMC free article] [PubMed] [Google Scholar]
- 14.Das S et al. Carboxyl-terminal domain of MUC16 imparts tumorigenic and metastatic functions through nuclear translocation of JAK2 to pancreatic cancer cells. Oncotarget 6, 5772–5787 (2015). [DOI] [PMC free article] [PubMed] [Google Scholar]
- 15.Shukla SK et al. MUC16-mediated activation of mTOR and c-Myc reprograms pancreatic cancer metabolism. Oncotarget 6, 19118–19131 (2015). [DOI] [PMC free article] [PubMed] [Google Scholar]
- 16.Muniyan S et al. MUC16 contributes to the metastasis of pancreatic ductal adenocarcinoma through focal adhesion mediated signaling mechanism. Genes Cancer 7, 110–124 (2016). [DOI] [PMC free article] [PubMed] [Google Scholar]
- 17.Andersen RS et al. Dissection of T-cell antigen specificity in human melanoma. Cancer Res. 72, 1642–1650 (2012). [DOI] [PubMed] [Google Scholar]
- 18.Gross L Intradermal Immunization of C3H Mice against a Sarcoma That Originated in an Animal of the Same Line. Cancer Res 3, 326–333 (1943). [Google Scholar]
- 19.Bailey P et al. Genomic analyses identify molecular subtypes of pancreatic cancer. Nature 531, 47–52 (2016). [DOI] [PubMed] [Google Scholar]
- 20.Embuscado EE et al. Immortalizing the complexity of cancer metastasis: genetic features of lethal metastatic pancreatic cancer obtained from rapid autopsy. Cancer Biol. Ther. 4, 548–554 (2005). [DOI] [PMC free article] [PubMed] [Google Scholar]
- 21.Haridas D et al. Pathobiological implications of MUC16 expression in pancreatic cancer. PLOS ONE 6, e26839 (2011). [DOI] [PMC free article] [PubMed] [Google Scholar]
- 22.Tumeh PC et al. PD-1 blockade induces responses by inhibiting adaptive immune resistance. Nature 515, 568–571 (2014). [DOI] [PMC free article] [PubMed] [Google Scholar]
- 23.McLaren W et al. The Ensembl Variant Effect Predictor. Genome Biol. 17, 122 (2016). [DOI] [PMC free article] [PubMed] [Google Scholar]
- 24.Deshwar AG et al. PhyloWGS: reconstructing subclonal composition and evolution from whole-genome sequencing of tumors. Genome Biol. 16, 35 (2015). [DOI] [PMC free article] [PubMed] [Google Scholar]
- 25.Dharma Rao T et al. Novel monoclonal antibodies against the proximal (carboxy-terminal) portions of MUC16. Appl. Immunohistochem. Mol. Morphol. 18, 462–472 (2010). [DOI] [PMC free article] [PubMed] [Google Scholar]
Associated Data
This section collects any data citations, data availability statements, or supplementary materials included in this article.
Supplementary Materials
Data Availability Statement
Data presented in this study can be downloaded from https://dcc.icgc.org/repositories under the identifier PACA-AU. Transcriptomic data is available under Gene Expression Omnibus accession number 89997. Source data are provided for all experiments, which includes figures 1b, 1c, 1e, 2d, 3a-d, 4a-e, and Extended Data Figures 2a-c, 3a, 3c, 3e, 4c, 6b, 8e, 9a-f, 10a. All other data are available from the authors on reasonable request.


