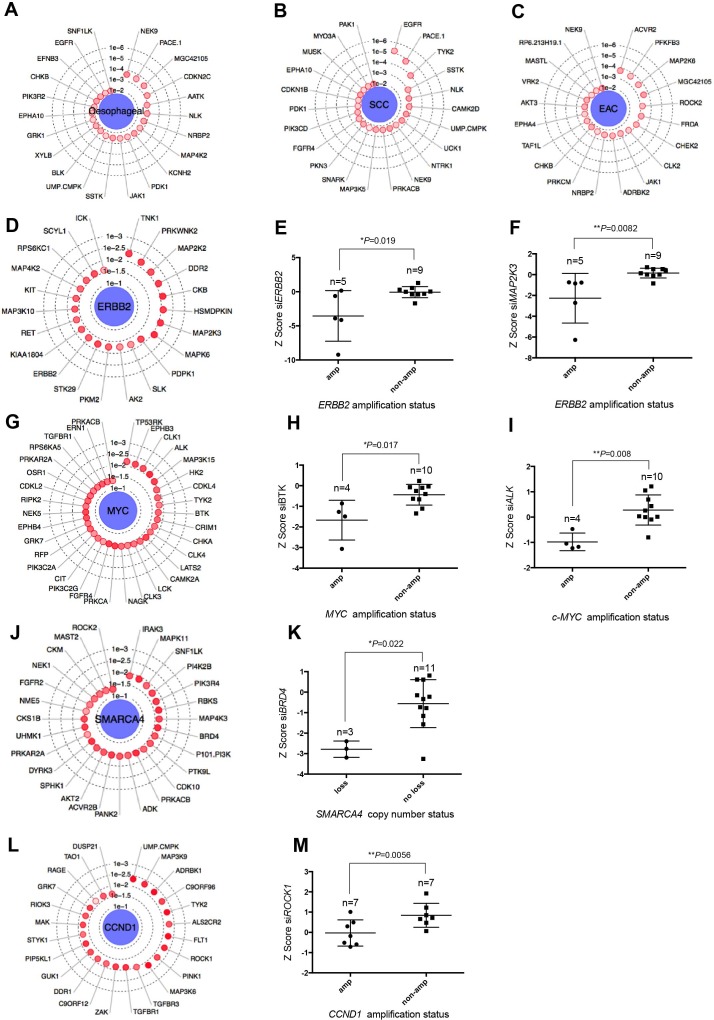
Figure 3.
Integration of genomic profiles with siRNA data. (A) Radar plot showing key genetic dependencies associated with oesophageal tumour cell lines compared with tumour cell lines from other histologies.26 The concentric circles indicate the degree of statistical significance and depth of colour indicates separation of Z scores. Radar plots showing key genetic dependencies associated with (B) oesophageal SCC histology and (C) EAC histology. (D) Radar plot showing key genetic dependencies associated with ERBB2 amplification. Box and whisker plots of Z score values showing that targeting of (E) ERBB2 (p=0.019, MP test) and (F) MAP2K3 (p=0.0082, MP test) is selectively lethal in ERBB2 amplified oesophageal cancer cell lines. (G) Radar plot showing key genetic dependencies associated with MYC amplification. (H) Box and whisker plots of Z score values showing that targeting of BTK (p=0.017, MP test) and (I) ALK (p=0.008, MP test) is selectively lethal in MYC amplified oesophageal cell lines. (J) Radar plot showing key genetic dependencies associated with copy number deletions in SMARCA4 in oesophageal cancer cell lines. (K) Box and whisker plots of Z score values showing that targeting BRD4 (p=0.022, MP test) is selectively lethal in oesophageal tumour cell lines harbouring SMARCA4 copy number loss. (L) Radar plot showing key genetic dependencies associated with CCND1 amplification. (M) Box and whisker plots of Z score values showing that targeting ROCK1 (p=0.0056, MP test) is selectively lethal in CCND1 amplified oesophageal cancer cell lines. EAC, oesophageal adenocarcinoma; MP, median permutation; SCC, squamous cell carcinoma.

