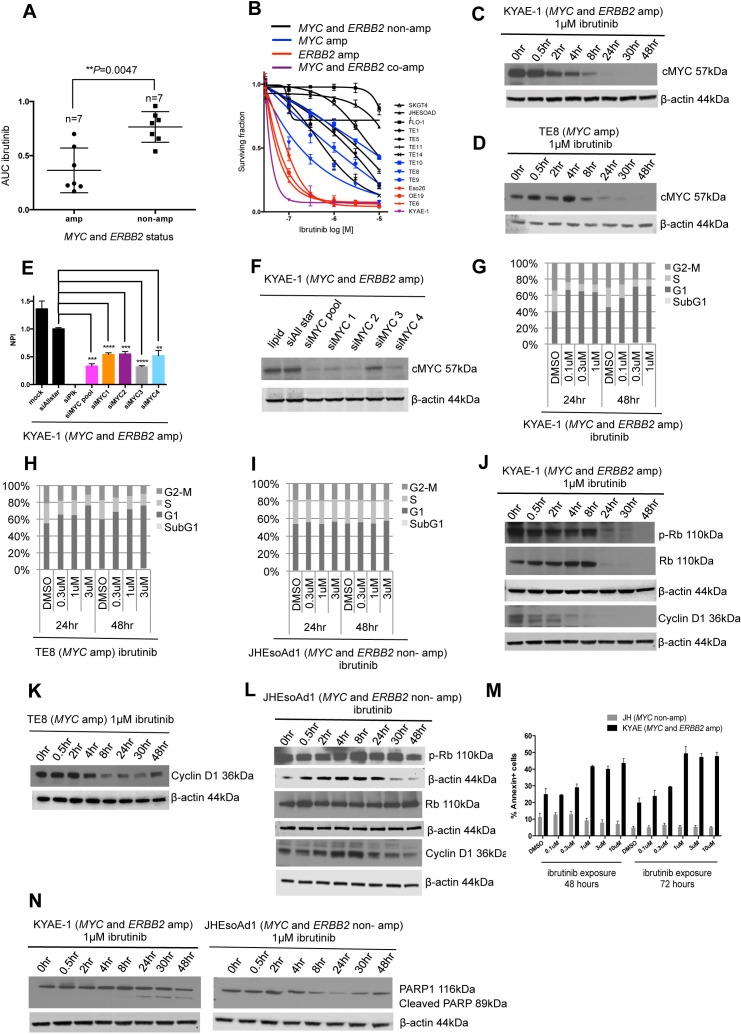
Figure 5.
Ibrutinib sensitivity in MYC and/or HER2 amplified oesophageal tumour cell lines. (A) Box plot depicting area under the curve values for ibrutinib. Preferential sensitivity to ibrutinib is observed in oesophageal cancer cell lines harbouring MYC and/or ERBB2 amplification. (B) Ibrutinib drug sensitivity curves across the panel of oesophageal tumour cell lines. Cell lines that are not MYC or ERBB2 amplified are depicted in black, MYC and ERBB2 amplified in purple, MYC amplified alone in blue and ERBB2 amplified alone in red. (C) Western blots showing decreased expression of cMYC in MYC amplified KYAE-1 tumour cell line after exposure to 1 µM ibrutinib. (D) Western blot showing decreased expression of cMYC in MYC amplified TE8 tumour cell line after exposure to 1 µM ibrutinib. (E) Bar chart showing decreased cell viability in KYAE-1 (MYC and ERBB2 amplified) following transfection with siMYC oligonucleotides. (F) Western blot showing decreased protein expression of cMYC following transfection of siMYC oligonucleotides in KYAE-1 (MYC and ERBB2 amplified). (G) Cell cycle analysis after 24 and 48 hours of ibrutinib exposure in KYAE-1 (MYC and ERBB2 amplified), (H) TE8 (MYC amplified) and (I) JHEsoAd1 (MYC and ERBB2 non-amplified) tumour cell lines. Prolongation of the G1 phase is observed with increasing doses of ibrutinib in cell line harbouring MYC amplification. G1 arrest was not observed in JHEsoAd1 (MYC and ERBB2 non-amplified) cell line. (J) Western blot showing decreased expression of p-Rb, Rb and cyclin D1 following ibrutinib exposure in KYAE-1 (MYC and ERBB2 amplified). (K) Western blot showing decreased expression of cyclin D1 following ibrutinib exposure in TE8 (MYC amplified). (L) Western blot showing no change in protein expression of p-Rb, Rb and cyclin D1 following ibrutinib exposure in JHEsoAd1 (MYC and ERBB2 non amplified). (M) Bar chart showing the apoptotic cell fraction (percentage of annexin-positive cells) after exposure to increasing doses of ibrutinib (24 and 48 hours). An increase in apoptosis is observed in KYAE-1 (MYC and ERBB2 amplified) that is not seen in JHEsoAd1 (MYC and ERBB2 non-amplified). (N) Western blot showing expression of cleaved PARP1 after ibrutinib exposure in the KYAE-1 (MYC and ERBB2 amplified). Cleaved PARP1 is not seen in JHEsoAd1 after ibrutinib exposure (MYC and ERBB2 non-amplified).

