Abstract
The San Joaquin Valley (SJV) of California experiences high concentrations of particulate matter NH4NO3 during episodes of meteorological stagnation in winter. A rich data set of observations related to NH4NO3 formation was acquired during multiple periods of elevated NH4NO3 during the Deriving Information on Surface Conditions from Column and Vertically Resolved Observations Relevant to Air Quality (DISCOVER-AQ) field campaign in SJV in January and February 2013. Here NH4NO3 is simulated during the SJV DISCOVER-AQ study period with the Community Multiscale Air Quality (CMAQ) model, diagnostic model evaluation is performed using the DISCOVER-AQ data set, and integrated reaction rate analysis is used to quantify HNO3 production rates. Simulated NO3− generally agrees well with routine monitoring of 24-hr average NO3−, but comparisons with hourly average NO3− measurements in Fresno revealed differences at higher time resolution. Predictions of gas-particle partitioning of total nitrate (HNO3 + NO3−) and NHx (NH3 + NH4+) generally agree well with measurements in Fresno, although partitioning of total nitrate to HNO3 is sometimes overestimated at low relative humidity in afternoon. Gas-particle partitioning results indicate that NH4NO3 formation is limited by HNO3 availability in both the model and ambient. NH3 mixing ratios are underestimated, particularly in areas with large agricultural activity, and additional work on the spatial allocation of NH3 emissions is warranted. During a period of elevated NH4NO3, the model predicted that the OH + NO2 pathway contributed 46% to total HNO3production in SJV and the N2O5 heterogeneous hydrolysis pathway contributed 54%. The relative importance of the OH + NO2 pathway for HNO3 production is predicted to increase as NOx emissions decrease.
1. Introduction
The San Joaquin Valley (SJV or Valley) makes up the southern portion of California’s Central Valley and is formed by the coastal mountain ranges in the west, the Sierra Nevada mountains in the east, and the convergence of mountain ranges in the south at the Tehachapi mountains. SJV is about 400 km long and 60–100 km wide and includes parts or all of eight counties having a combined population of about 4.2 million (Calfornia Department of Finance, 2017). The Valley population is projected to increase rapidly in coming decades, by ~60% from 2016 to 2060 (Calfornia Department of Finance, 2017), which has implications for air quality planning (Hixson et al., 2012). SJV contains major cities such as Fresno (population ~520,000) and Bakersfield (population ~380,000), important oil and gas fields (CDOC, 2015; Gentner et al., 2014), and an extremely productive agricultural region (California Department of Food and Agriculture, 2016a). For instance, SJV had about 1.5 million dairy cows and produced about 36 billion pounds of milk (90% of CA total) in 2016 (California Department of Food and Agriculture, 2016b). The Valley is also a major north-south corridor for goods transport along Highway 99 in the east and Interstate 5 in the west. SJV’s terrain combined with pollutant emissions from the large population and economic activity leads to high concentrations of PM2.5 (particulate matter with aerodynamic diameter ≤ 2.5 μm), particularly during periods of stagnant meteorology in winter months. SJV is in nonattainment of U.S. EPA’s primary national ambient air quality standards for PM2.5 that are set to protect public health.
Air pollution in SJV has been studied for decades, and conceptual models of wintertime PM2.5 formation in SJV have been developed, largely based on the 1995 Integrated Monitoring Study and the 2000/2001 California Regional PM10/PM2.5 Air Quality Study (CRPAQS; Herner et al., 2005, 2006; Pun & Seigneur, 1999; Watson et al., 1998; Watson & Chow, 2002). Briefly, high pressure systems over the Great Basin lead to subsidence temperature inversions over the Valley that limit daytime mixing heights from less than 400 to ~800 m for periods of days to more than a week. Radiation temperature inversions also form overnight and limit mixing of surface emissions to a ~30–50 m layer that is decoupled from the residual layer above. Primary carbonaceous particles are concentrated in the shallow nighttime surface layer. Between the radiation inversion and the subsidence inversion, air masses rich in oxides of nitrogen, largely from urban areas and major highways, mix with air masses rich in NH3, largely from rural agricultural areas, in a valley-wide layer overnight. Ammonium nitrate (NH4NO3) forms in this layer and mixes to the surface in the morning when the radiation inversion breaks. Morning increases in NH4NO3at the surface therefore tend to coincide with decreases in carbonaceous PM2.5 (Herner et al., 2006; Lurmann et al., 2006; Young et al., 2016). NH4NO3 makes up a large fraction of fine particle mass during major PM2.5 episodes (e.g., L. W. A. Chen et al., 2007; Chow et al., 2006; Ge, Setyan, et al., 2012; Herner et al., 2005; San Joaquin Valley Air Pollution Control District [SJVAPCD], 2012). Persistent radiation fog also occurs in SJV in wintertime, and the chemistry of fine particles can be influenced by aqueous-phase processes (e.g., Collett, Hoag, & Rao, 1999; Collett, Hoag, Sherman, et al., 1999; Ge, Zhang, et al., 2012; Herckes et al., 2015; Jacob et al., 1986).
Air quality models have been used in combination with the CRPAQS data set to better understand air pollution processes in SJV. Overall, models did a reasonable job of predicting PM during CRPAQS (Kelly et al., 2011; Pun, Balmori, & Seigneur, 2009; Ying, Lu, Allen, et al., 2008; Y. Zhang et al., 2010) and were used to provide information on process rates, visibility impairment, and source apportionment and regional contributions to primary and secondary PM (J. Chen, Ying, & Kleeman, 2009, 2010; Ying, 2011; Ying & Kleeman, 2009; Ying, Lu, Kaduwela, et al., 2008; Ying, Lu, & Kleeman, 2009). Air quality models have also been used to understand the impact of precursor emissions on NH4NO3 (Blanchard et al., 2000; J. Chen et al., 2014; Kleeman et al., 2005; Livingstone et al., 2009; Pun, Balmori, & Seigneur, 2009; Pun & Seigneur, 2001; Stockwell et al., 2000). Generally, these studies found that NOx (NO + NO2) emission reductions would be the most effective emission control for reducing NH4NO3 in SJV. Air quality management strategies based in part on NOx emission reductions, which are also important for reducing ozone in the Valley, have been implemented (e.g., SJVAPCD, 2012; SJVAPCD, 2016).
The studies discussed above were largely based on PM2.5 episodes that occurred one to two decades ago. Although these studies are still relevant, air quality has improved over time in SJV due to reductions in NOx and other emissions (e.g., McDonald et al., 2012; Pusede et al., 2014, 2016; Pusede & Cohen, 2012; Russell et al., 2012). The DISCOVER-AQ (Deriving Information on Surface Conditions from Column and Vertically Resolved Observations Relevant to Air Quality) campaign in January and February 2013 provides a rich data set for analysis of more recent wintertime PM2.5 episodes in SJV. Peak PM2.5 concentrations were lower during DISCOVER-AQ than CRPAQS, but NH4NO3 still made up a large fraction of fine particle mass consistent with the earlier study. The DISCOVER-AQ data set has recently been used to investigate PM2.5 precursor emissions and formation processes in SJV (e.g., Miller et al., 2015; Parworth et al., 2017; Prabhakar et al., 2017; Pusede et al., 2016; Shephard & Cady-Pereira, 2015; Sun et al., 2015; Young et al., 2016; X. L. Zhang et al., 2016). In particular, Pusede et al. (2016) used the DISCOVER-AQ data set in combination with the historical monitoring record to interpret past trends and predict future trends in NH4NO3 in SJV. They found that NH4NO3 formation is limited by NOx emissions, both daytime and nighttime formation pathways are important, and the daytime pathway will become the dominant source of wintertime NH4NO3 if future NOx emission reductions of 75% are achieved.
Previous studies using the 2013 SJV DISCOVER-AQ data set were generally based on conceptual, analytical, and box modeling in combination with the measurements. Compared with earlier field campaigns, limited regional photochemical modeling has been done for SJV DISCOVER-AQ. Regional photochemical modeling is valuable because it provides comprehensive information on key processes in three dimensions across the entire region for the entire period and is constrained by relatively few assumptions. The lack of constraints in air quality modeling is advantageous for exploring alternative scenarios but requires that models be thoroughly evaluated to insure they adequately reflect ambient processes. Modeling PM2.5 episodes in SJV is particularly challenging because it involves simulating meteorology in complex terrain under low wind speed and vertically stratified conditions, representing complex pollutant emissions distributions, and simulating daytime and nighttime chemistry that can be influenced by the mixing of urban and rural air masses. Reliable modeling of PM2.5 in SJV is important, however, to help inform air quality management for the highly populated nonattainment area. Here a diagnostic model evaluation is performed for regional photochemical modeling of NH4NO3 in the Valley during January and February 2013 using the DISCOVER-AQ data set. Integrated reaction rate (IRR) and process analysis modeling is also used to quantify HNO3 production rates, interpret model predictions, and contribute to the understanding of air pollution in the Valley.
2. Methods
2.1. Modeling
Photochemical grid modeling was performed with the Community Multiscale Air Quality (CMAQ; www.epa.gov/cmaq) model version 5.1 (Appel et al., 2017) on a domain covering SJV from south of the Tehachapi mountains to north of Sacramento and parts of the Sierra Nevada mountains in the east and Pacific Ocean in the west (Figure S1). The CMAQv5.1 simulations were configured with IRR and process analysis (Jang et al., 1995; Jeffries & Tonnesen, 1994; Kim et al., 2014) and covered the 10 January to 10 February 2013 period after six days of spin-up from a separate simulation initialized on 22 December 2012. Horizontal grid resolution of 4 km was used with 35 vertical layers that matched the vertical structure of the meteorological model. Chemical boundary conditions were developed from a CMAQv5.1 simulation that covered the contiguous U.S. and surrounding areas with 12-km horizontal resolution. NH3 surface exchange was simulated with CMAQ’s bidirectional exchange parameterization (Bash et al., 2013; Pleim et al., 2013), and gas-phase chemistry was parameterized with the CB05e51 mechanism (Appel et al., 2017). Inorganic aerosol thermodynamics were simulated with ISORROPIA II (Fountoukis & Nenes, 2007) in metastable mode, where crystallization does not occur. Semivolatile inorganic particle components (i.e., NO3−, NH4+, and Cl−) in the Aitken and accumulation modes are assumed to be in bulk equilibrium with their gas-phase counterparts (i.e., HNO3, NH3, and HCl) in CMAQ, whereas diffusive mass transfer is explicitly simulated for semivolatile coarse-mode particle components (Kelly et al., 2010). Heterogeneous hydrolysis of N2O5 on Aitken- and accumulation-mode particles is based on Davis et al. (2008), and N2O5 hydrolysis on coarse-mode particles is based on Bertram and Thornton (2009) as described by Sarwar et al. (2012).
Gridded emission fields for CMAQ modeling were developed with the Sparse Matrix Operator Kernel Emissions (SMOKE) model (Houyoux et al., 2000) version 3.7. The emission modeling procedures used here are similar to those described in detail previously for national 12-km resolution modeling (U.S. Environmental Protection Agency [USEPA], 2017c). Point source emissions were based on 2013 continuous emissions monitoring data when available and state submitted data otherwise. Anthropogenic nonpoint source emissions were based on version 2 of the 2011 National Emission Inventory (NEI11v2; USEPA, 2016). Onroad mobile source emission totals by county were estimated by interpolating totals from 2011 and 2014 based on EMFAC2014 (www.arb.ca.gov/emfac/) modeling by the California Air Resources Board (CARB). The interpolated onroad emission totals were then temporally and spatially allocated using results of a MOVES2014a (Motor Vehicle Emission Simulator; www.epa.gov/moves) simulation according to a hybrid procedure described previously (USEPA, 2012b, 2017c). Offroad mobile source emission totals were also based on information provided by CARB. The Biogenic Emission Inventory System version 3.6.1 was used with the Biogenic Emissions Landuse Database version 4.1 to estimate biogenic NO and speciated volatile organic carbon emissions (Bash, Baker, & Beaver, 2016). NH3emissions from livestock were based on NEI11v2 annual county totals allocated to hour of day according to Zhu et al. (2015) using 2013 meteorological data as described by USEPA (2017b). Fertilizer application used in CMAQ’s bidirectional exchange parameterization was based on a simulation with the Environmental Policy Integrated Climate (EPIC) model (Cooter et al., 2012). Spatial allocation of livestock emissions and fertilizer application was based on agricultural land use classes of the 2011 National Land Cover Database.
The Weather Research and Forecasting (WRF) model (Skamarock et al., 2008) version 3.7 was used to generate gridded meteorological fields for CMAQ and SMOKE. WRFv3.7 was applied with 35 vertical layers from the surface to 50 mb with higher resolution near the surface to better resolve the planetary boundary layer (PBL). The model was run from 10 January to 10 February 2013 with 19 days of spin-up and no reinitialization. Boundary conditions were developed from a 12-km simulation that covered the contiguous U.S. (USEPA, 2017c). Four-dimensional data assimilation of wind speed, temperature, and moisture was used to nudge the atmosphere above the PBL according to the iterative approach described by Appel et al. (2014). Key physics options used in the WRF simulation include the Pleim-Xiu land surface model (Pleim & Xiu, 2003), asymmetric convective mixing model version 2 (ACM2; Pleim, 2007), RRTMG short and longwave radiation parameterization (Mlawer et al., 1997), and Morrison two-moment microphysics scheme (Morrison et al., 2009).
2.2. Measurements
Measurements of NH3, TNO3 (HNO3 + fine particle NO3−), NO, NO2, NOy (oxides of nitrogen including NOx, HNO3, HNO4, HONO, NO3 radical, organic nitrates, and N2O5), O3, and HCHO made from the National Aeronautics and Space Administration (NASA) P-3B aircraft during daytime flights on 16, 18, 20–22, and 30–31 January and 1, 4, and 6 February 2013 are used to examine model performance. The aircraft flew 2–3 repeated circuits per day over SJV including vertical spiral trajectories with ~5-km diameters over six sites (i.e., Bakersfield, Hanford, Tranquility, Fresno, Huron, and Porterville). Flights did not occur at night, and N2O5was not measured during SJV DISCOVER-AQ. NH3 was measured with a cavity ring down spectrometer (CRDS; G2103, Picarro Inc.) and a proton-transfer-reaction time-of-flight mass spectrometer (PTR-ToF-MS). Measurements from these instruments have been compared previously and were found to provide complementary information (Sun et al., 2015). Therefore, both the CRDS and PTR-ToF-MS measurements are used here. TNO3 was measured on the P-3B aircraft by thermal dissociation of ambient NOy species followed by laser-induced fluorescence of NO2. Specifically, TNO3 was calculated as NO2 measured in the 600°C channel minus that measured in the 400°C channel with correction for slight conversion of HNO3 in the alkyl nitrate channel (Pusede et al., 2016; Womack et al., 2017). NO, NO2, O3, and NOy were measured with the National Center for Atmospheric Research four-channel chemiluminescence instrument. The NOy measurement likely includes some contribution from NO3− in sub-1-μm particles, although the amount of contribution is uncertain. Airborne size distributions of particles with diameters between 90 and 7,500 nm were measured with a laser aerosol spectrometer (TSI Inc.) calibrated with polystyrene latex spheres. Airborne measurements of aerosol composition by a particle-into-liquid sampler (PILS) and off-line ion chromatography (IC) analysis showed that nitrate constituted 53% of the water-soluble aerosol mass. HCHO was measured with difference frequency generation absorption spectroscopy (Weibring et al., 2006). P-3B measurements were acquired from Revision 4 merged files available in the NASA online database (NASA, 2017).
NH3 was also measured from a mobile ground laboratory that sampled conditions across the Valley during transects on 21–22 and 25–31 January and 1, 3–5, and 7 February 2013. Mobile measurements were performed with an open-path, quantum-cascade laser-based sensor mounted on the roof rack of a sedan passenger car (Miller et al., 2014; Sun et al., 2014) as described previously (Miller et al., 2015; Sun et al., 2015). Mobile laboratory data were acquired from Revision 0 files available online (NASA, 2017). At the CARB Fresno-Garland site, water soluble inorganic ions including NO3−, NH4+, SO42−, and K+ from particles with diameters of 3.0 μm or less were measured with subhourly resolution during 19 January to 10 February using a PILS-IC instrument, and water soluble gases including HNO3and NH3 were collected with ~5–7 hr resolution using annular denuders and analyzed off-line by IC (Parworth et al., 2017). These data were acquired directly from the authors Parworth et al., (2017), although the data are also available online (NASA, 2017). Meteorology measurements collected by CARB were acquired from NASA, (2017), radar profiler measurements at Visalia were obtained from NOAA (2017), and 24-hr average PM2.5 NO3−concentrations at SJV monitoring sites were obtained directly from CARB, although routine monitoring data are also available online (USEPA, 2017a).
2.3. Model-Measurement Pairing
Model predictions were generally paired with measurements according to standard practice by extracting predictions from the grid cell containing the measurement and then averaging the hourly mean model output to the sampling period of the measurement. To match model predictions with P-3B and mobile laboratory measurements, the grid cell containing the measurement at each second was identified, and instantaneous hourly predictions from that cell were linearly interpolated to the time of the measurement. The paired 1-s data were then averaged to 10-s resolution for the boxplot comparisons below. For spatial comparisons of CMAQ predictions with mobile laboratory NH3 measurements, medians of subcell median mixing ratios were used to ensure adequate grid cell coverage of the measurements and reduce the influence of near-source sampling as follows. First, the 4-km CMAQ grid cells were decomposed into 1-km subcells, and grid cells with measurements in at least four subcells were selected. Second, median NH3 mixing ratios in each subcell were calculated from the 1-s paired model-measurement data. Finally, the median mixing ratio for a 4-km grid cell was calculated as the median of the subcell median values. For spatial comparisons of CMAQ predictions and P-3B measurements, mean or median mixing ratios were calculated from the 1-s paired model-measurement data over samples within the modeled PBL during 11–15 PST for grid columns with measurements on at least four days. Modeled PBL heights were well correlated with PBL heights estimated from measurements during P-3B spirals, but predicted values were moderately biased low (12–34%; Figure S2).
3. Results and Discussion
NH4NO3 in fine particles is generally considered to be in thermodynamic equilibrium with NH3 and HNO3 for time scales of relevance to regional air quality modeling (e.g., Fountoukis et al., 2009; Meng & Seinfeld, 1996). Evaluations of model predictions of NH3, HNO3, NOx, and NOy are therefore relevant for understanding the model’s ability to simulate NH4NO3. In section 3.1, NH3 predictions are compared with measurements from the mobile ground laboratory and the P-3B aircraft. In section 3.2, predictions of NOx, NOx/NOy, and TNO3 are compared with measurements from the P-3B aircraft. Routine network observations of NO3−are also used to understand the model’s ability to simulate NO3− across the Valley. In section 3.3, the NH4NO3 system is considered at the Fresno site where a comprehensive data set allows for detailed investigation. Finally, in section 3.4, model predictions of HNO3production rates are presented to contribute to understanding of the spatial and temporal patterns of nitrate production in the Valley. The term NH4NO3 is used here for convenience and is not meant to imply a solid phase state. For supersaturated conditions and for stable equilibrium conditions at relative humidities (RHs) greater than the mutual deliquescence RH (MDRH) of the inorganic system, NH4NO3 would partially or completely dissociate into NH4+ and NO3− ions in aqueous solution (e.g., Kelly et al., 2008; Nenes et al., 1998; Wexler & Seinfeld, 1991). Since RH is often high in winter in SJV, CMAQ’s assumption that NH4NO3completely dissociates into aqueous solution at all RHs is generally a good one, except possibly during afternoon hours as discussed below.
3.1. Examining NH3 Mixing Ratios
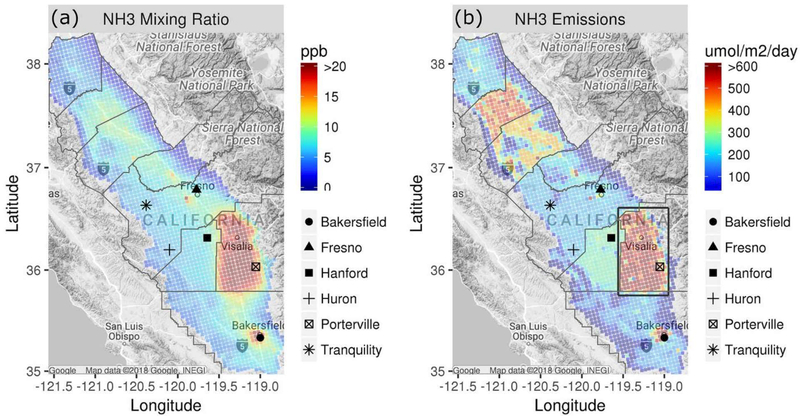
Average modeled NH3 mixing ratios over SJV during 15 January to 5 February 2013 are shown in Figure 1a. Mixing ratios greater than about 7 ppb are predicted throughout SJV, and mixing ratios greater than 20 ppb occur in regions just west of Fresno, around Bakersfield, and a large portion of the eastern side of the Valley between Bakersfield and Fresno. The spatial patterns of elevated NH3 mixing ratios follow the spatial patterns of NH3emissions (Figure 1b) closely. NH3 emissions occur primarily during daytime (Figure S3a) due to the combination of increased emission-related activity and conducive meteorology (e.g., Lonsdale et al., 2017; Zhu et al., 2015). On average, NH3 deposition fluxes in the boxed region of Figure 1b were 43% of the emission fluxes during 10–16 PST, and vertical transport of NH3 from model layer 1 was 55% of the emission fluxes (Figure S3b). This behavior is consistent with a previous study for the eastern U.S. (Dennis et al., 2010) and explains the correspondence in spatial patterns of NH3 emissions and model surface layer concentrations in Figure 1.
Figure 1.
Average NH3 (a) surface layer mixing ratios predicted by CMAQ and (b) gridded emissions with box defining region for discussion (see text) during 15 January to 5 February 2013. Markers for P-3B spiral locations are also shown.
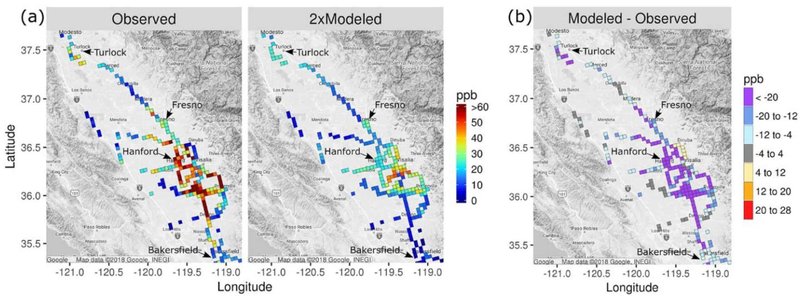
Model predictions of NH3 are compared with measurements from the mobile ground laboratory in Figure 2. These comparisons were done by matching CMAQ predictions in space and time with the measurements for all transects and then calculating the median modeled and measured mixing ratio by CMAQ grid cell from median values in 1-km subcells as described above. Model predictions are scaled by two in Figure 2a to better illustrate spatial patterns. The model underestimates mixing ratios considerably in regions where elevated values (> ~20 ppb) were measured (Figure 2b). Yet the model correctly estimates that NH3 mixing ratios are elevated just southwest of Turlock, near Fresno, and in a region to the southeast of Hanford and that NH3 mixing ratios are relatively low on the western side of the Valley. The model-measurement comparison is complicated by the nonuniform sampling and wide range of scales represented by the high-resolution ground measurements compared with the 4-km horizontal resolution of the air quality model. The qualitative conclusion of underestimated NH3 in high emission regions based on the aggregated results in Figure 2 appears to be robust though based on additional NH3evaluation discussed below. Also, previous comparisons of CMAQ and GEOS-Chem predictions with NH3 measurements in SJV yielded similar conclusions as here for the May–June 2010 CalNex period (Kelly et al., 2014; Schiferl et al., 2014) and earlier periods (Heald et al., 2012; Walker et al., 2012). Model predictions of NO3− appear to be insensitive to the NH3underpredictions in the high emission regions though. For instance, in a simulation with NH3emissions doubled in the boxed region of Figure 1b, average NO3− concentrations changed by <5% in 93% of SJV grid cells having NO3− concentrations >5 μg/m3 and the maximum change was 13%.
Figure 2.
Median observed and 2× median modeled NH3 mixing ratio by CMAQ grid cell over all mobile ground laboratory sampling transects and (b) difference in median values. See text for description of grid cell median calculations.
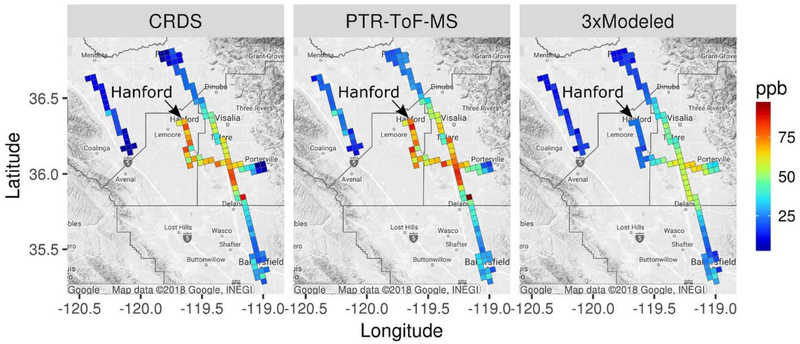
Median modeled NH3 mixing ratios are compared with CRDS and PTR-ToF-MS measurements from the P-3B aircraft in Figure 3. Model results are scaled by three in the figure to better illustrate spatial patterns. Similar to results of the mobile ground laboratory comparison, the spatial patterns of model predictions are in general agreement with P-3B NH3 measurements, but model predictions are too low in areas where elevated mixing ratios were observed. One location where relatively large underpredictions are evident is Hanford, which is located just outside of the high emission and concentration region in the model (Figure 1). NH3 measurements from the CRDS and PTR-ToF-MS are in good agreement near the surface during morning and afternoon P-3B aircraft spirals over Hanford (Figure S4) and indicate that median modeled mixing ratios were underpredicted by a factor of 7–9 in the 0–900 m altitude range. For the mobile laboratory comparison in Figure 2, median NH3 mixing ratios over Hanford were underpredicted by a factor of 5. Considering that Hanford is located just outside of a high emission region in the model, further examination of the spatial allocation of NH3 emissions in this area is warranted. Modeled PBL heights were in reasonable agreement with empirical estimates at the Hanford site (normalized mean bias: −12%; Figure S2), and so errors in mixing height predictions are unlikely to explain the model-measurement differences.
Figure 3.
Median modeled and measured NH3 within the modeled PBL during 11–15 PST by model grid cell for P-3B flights in January and February 2013.
3.2. Examining NOx, NOx/NOy, and NO3− Concentrations
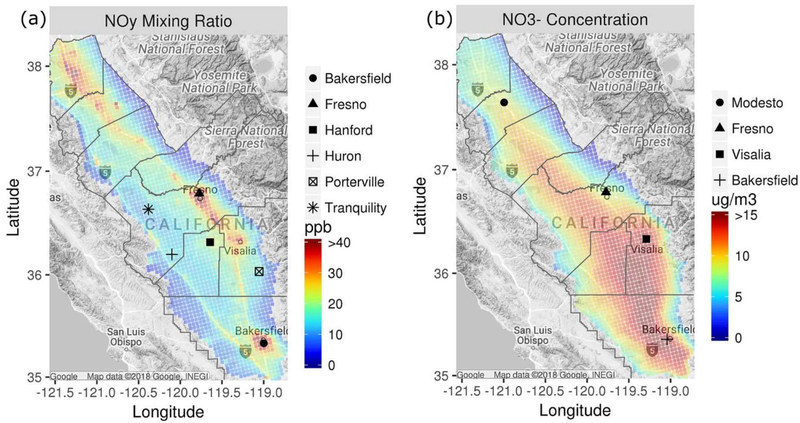
Average model predictions of NOy during 15 January to 5 February are shown in Figure 4a. Relatively high mixing ratios are predicted over Fresno, Bakersfield, and northern SJV cities (e.g., Modesto and Stockton) and along Highway 99 between these cities. Average concentrations of fine particle NO3− (Figure 4b) are more uniformly distributed across the Valley than are mixing ratios of NOy, which are elevated in areas with high NOx emissions. The formation of NO3− requires the oxidation of NOx to HNO3 and is promoted by the mixing of urban air masses with air rich in NH3 from surrounding areas. These dependencies help explain the broader average spatial distributions of NO3− than NOy and NH3 (cf., Figure 1a). Also, dry deposition velocities of HNO3 and NH3 are generally high compared with those of fine particle NO3− and contribute to sharper spatial gradients in NOy and NH3.
Figure 4.
Average modeled (a) NOy (including fine particle NO3−) mixing ratios in SJV with markers for P-3B spiral locations and (b) fine particle NO3− concentrations with markers for PM2.5monitoring locations during 15 January to 5 February 2013.
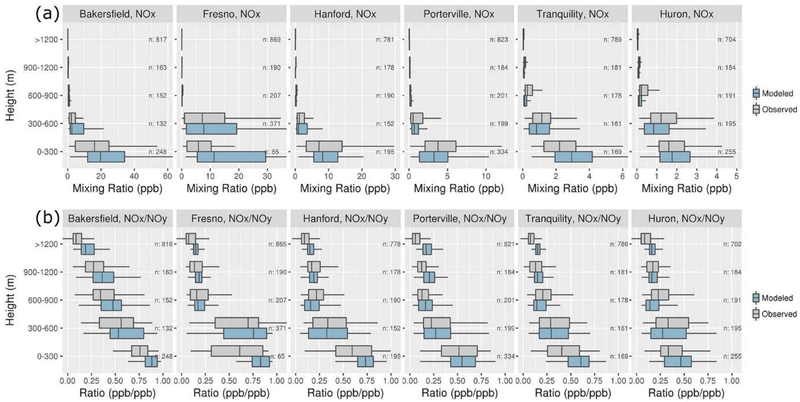
NOx and NOy were measured during a series of P-3B spirals over sites including major cities in the north (Fresno) and south (Bakersfield), rural locations in the west (Tranquility and Huron), and the Hanford site discussed above. In Figure 5a, model predictions of NOx are compared with measurements during the aircraft spirals. The model correctly predicted that the highest mixing ratios occurred in Bakersfield and Fresno, relatively low mixing ratios occurred in Tranquility and Huron, and mixing ratios generally decreased with altitude. Yet NOx predictions were biased high in the 0–300 m bin at Bakersfield, Fresno, and Tranquility. The ratios of NOx-to-NOy are shown in Figure 5b, where modeled NOy was calculated by summing gas-phase NOy components and 20% of fine particle NO3−. Size distribution measurements during the flights indicate that the majority of fine particle NO3− existed in particles with diameters less than 500 nm (Figure S5) and suggest that a significant, although unknown, fraction of fine particle NO3− was measured by the NOy instrument. NOx-to-NOy ratio comparisons based on modeled NOy with 0% and 100% of modeled NO3− included in the NOy calculation are provided in Figure S6. The model captured the general pattern of relatively high NOx-to-NOy ratios in urban areas (e.g., Bakersfield), where fresh NOx emissions comprise a large fraction of NOy, and relatively low NOx-to-NOy ratios in remote areas (e.g., Huron), where NOx oxidation products comprise a large fraction of NOy (Figure 5b). The model also captured the generally decreasing trends of NOx-to-NOy ratios with altitude. The overestimates of the NOx-to-NOy ratios in Fresno, Bakersfield, and Tranquility in Figure 5b suggest that the overpredictions of NOx in Figure 5a could be due in part to too-low modeled oxidation rates. However, the NOx-to-NOy evaluation is limited by uncertainty in the fraction of particle NO3− measured by the NOy instrument. Underpredictions of HCHO and O3 during the aircraft spirals suggest that modeled oxidation rates may have been too low over the sites (Figure S7).
Figure 5.
Comparison of modeled and measured (a) NOy and (b) NOx/NOy mixing ratio distributions for 300-m altitude ranges for P-3B aircraft spirals (see Figure 4a for site locations). Boxes bracket the interquartile range (IQR), lines within the boxes represent the median, and whiskers represent 1.5 times the IQR from either end of the box.
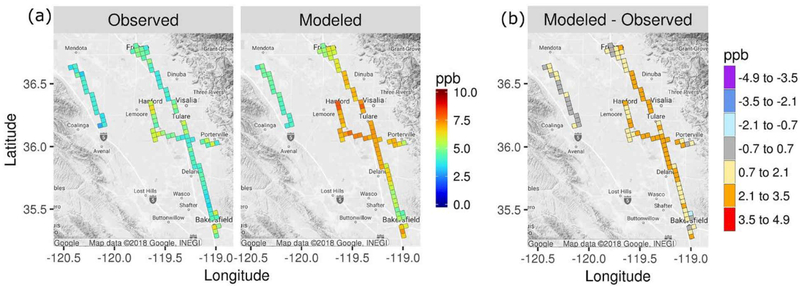
In Figure 6, average TNO3 mixing ratios are shown for P-3B measurements at altitudes within the modeled PBL during 11–15 PST by model grid cell for cells with measurements on at least four days. Modeled TNO3 mixing ratios were generally biased high compared with the measurements, especially along Highway 99 between Fresno and Bakersfield. The relatively large TNO3 overpredictions between Bakersfield and Fresno resulted in weaker daytime gradients between the cities and surrounding areas for the model than were identified by Pusede et al. (2016). Modeled TNO3 was biased low relative to the ground site measurements in Fresno (see section 3.3).
Figure 6.
Average modeled and measured TNO3 within the modeled PBL by model grid cell over P-3B flights in January and February 2013 and (b) difference between modeled and measured TNO3.
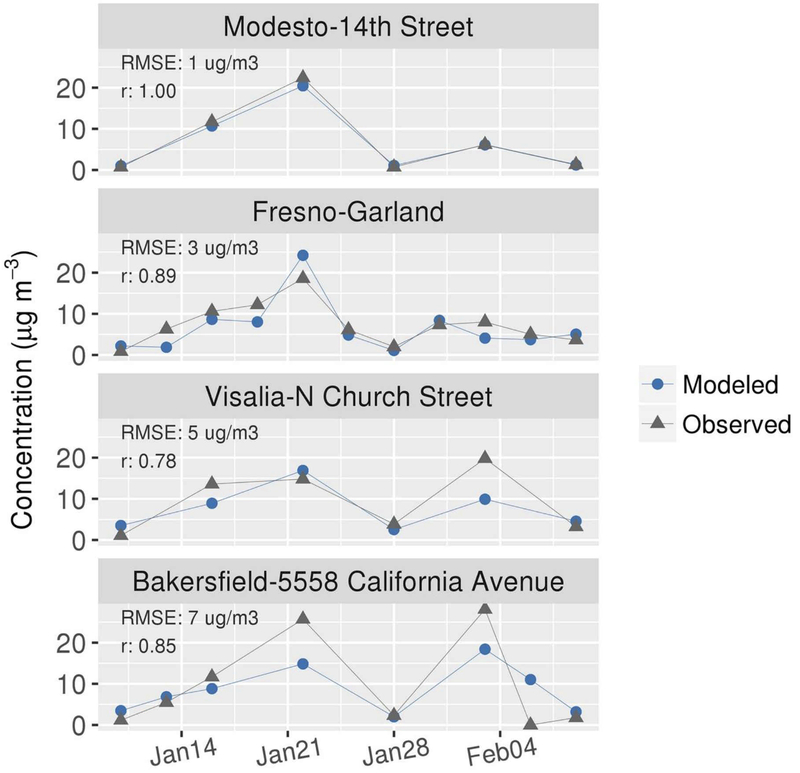
In Figure 7, model predictions are compared with routine observations of 24-hr average fine particle NO3− at four sites spanning SJV from north (Modesto) to south (Bakersfield; see Figure 4b for site locations). A peak in the NO3− time series was observed at all sites on 22 January. The model performed well on this day for all sites except Bakersfield for which observations were underpredicted. On 3 February, high NO3− concentrations (>20 μg/m3) were observed in the south (Bakersfield and Visalia) and lower concentrations (<10 μg/m3) were observed in the north (Modesto and Fresno). The model underpredicted the NO3−peaks on 3 February at Bakersfield and Visalia. The root-mean-square error (RMSE) for predictions increased in magnitude from north (1 μg/m3) to south (7 μg/m3), whereas correlation coefficients were high (r ≥ 0.78) at all sites. Additional model performance statistics are provided in Table S1. Model performance generally met benchmarks proposed by Emery et al. (2017).
Figure 7.
Comparison of 24-hr average PM2.5 NO3− predictions of CMAQ with routine monitoring measurements at sites shown in Figure 4b.
The mean modeled PBL height at 15 PST was 320 m during the 18–22 January period when elevated NO3− was simulated in Modesto and Fresno and was 490 m during the 1–5 February period when the model predicted lower NO3− concentrations (Figure S8). Wind speeds were also lower during the January period (mean: 1.4 m/s) than the February period (mean: 1.9 m/s). Compared with profiler measurements at Visalia, wind speeds were biased low in mid-January and were biased high near the surface in early February (Table S3). Considering that meteorological stagnation is central to the conceptual model of NO3−formation and build-up in SJV, the relatively low NO3− concentrations simulated during the early February period are probably related to the greater transport and mixing in the model. The relatively large NO3− underpredictions at Bakersfield, where meteorology is more influenced by the convergence of mountain ranges to the south, may be attributed to challenges in simulating meteorology in complex terrain. Model performance statistics for meteorological variables are provided in Table S2. Model bias and error for temperature and wind speed met benchmarks proposed by Emery et al. (2001) at the Fresno site supporting examination of the NH4NO3 system in Fresno.
3.3. Examining the NH4NO3 System in Fresno
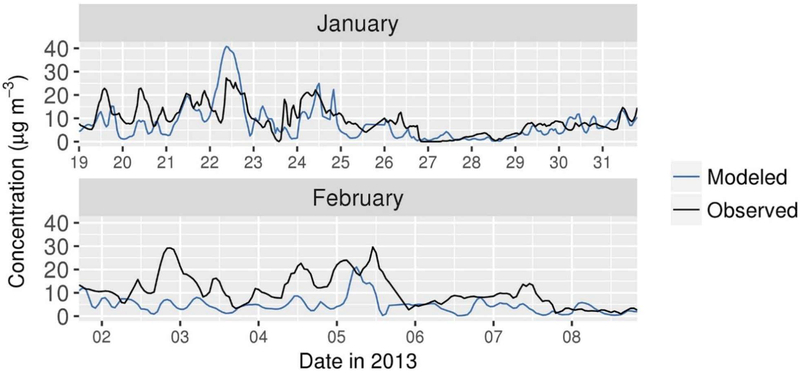
A relatively complete set of measurements for evaluating the NH4NO3 system were made during 19 January to 10 February 2013 at the CARB Fresno-Garland site. In Figure 8, predictions of fine particle NO3− are compared with PILS-IC measurements at this site. Two major NO3− episodes were identified in Fresno during the campaign from about 14–23 January and 29 January to 5 February (Young et al., 2016). During the first episode, the model overpredicted the peak NO3− concentration on 22 January (Figure 8). The modeled peak is due to overnight transport of NO3− from the south (Figure S10), where modeled production of HNO3 was particularly high around Visalia during this period (see section 3.4). Modeled wind speeds were low in Visalia in reasonable agreement with observations (Figures S11–S13). However, observed winds at sites in SJV were relatively disorganized overnight compared with model predictions and suggest that the model overestimated transport of NO3− to Fresno on 22 January. In early February, the model underpredicted the elevated NO3− concentrations in Fresno. As discussed above, modeled wind speeds and PBL heights were relatively high across SJV during the February period, and modeled NO3−concentrations were relatively low. Comparisons of predictions of SO42−, NH4+, K+, and Cl−with PILS-IC measurements are provided in Figure S14. Underpredictions of the generally low measured Cl− concentrations (mean: 0.4 μg/m3) are consistent with findings of studies of other parts of the U.S. (Kelly et al., 2010; Kelly et al., 2014; Kelly et al., 2016; Simon et al., 2010).
Figure 8.
Comparison of model predictions of fine particle NO3− with PILS-IC measurements at the Fresno-Garland ground site.
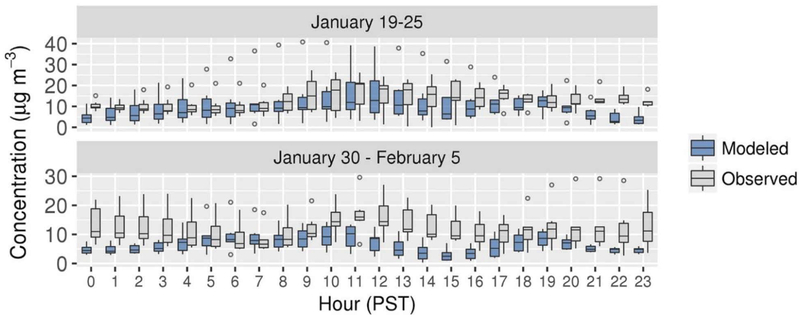
Distributions of hourly average modeled and measured NO3− concentrations in Fresno are shown in Figure 9 for the January and February episodes. Measured concentrations increase in the morning during both periods in a pattern consistent with mixing of NH4NO3 from the nocturnal residual layer to the surface during development of the daytime boundary layer (Parworth et al., 2017; Prabhakar et al., 2017; Young et al., 2016). The 75th percentiles of modeled concentrations increase in the morning during the 19–25 January episode, but median concentrations are relatively constant compared with the measurements. The morning increase in NO3− is also underpredicted during 30 January to 5 February. In the afternoon, measured NO3− concentrations reach a relatively constant level during the first period and decrease during the second period, whereas modeled concentrations decrease in the afternoon during both episodes (Figure 9).
Figure 9.
Hourly average modeled and measured NO3− distributions at Fresno ground site during two periods of interest. Boxes bracket the IQR, lines within the boxes represent the median, whiskers represent 1.5 times the IQR from either end of the box, and circles represent individual values less than and greater than the range of the whiskers.
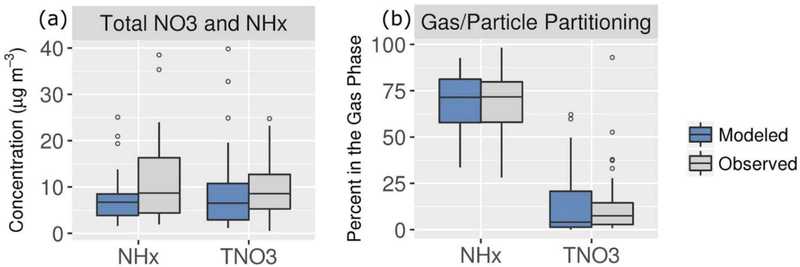
In Figure 10, concentrations of TNO3 and NHx and the percentage of the total concentrations in the gas phase are shown during 19–31 January when model performance for NO3− was relatively good. The model is biased 27% low for TNO3 and 36% low for NHx during this period at the Fresno site. However, the model correctly predicts that most of NHx is in the gas phase and most of TNO3 is in the particle phase. This gas-particle partitioning behavior suggests that HNO3 is the limiting precursor for NH4NO3 formation in SJV in both the model and ambient. Sensitivity simulations with reductions in NH3 and NOx emissions were conducted and confirmed that HNO3 is the limiting precursor in the model.
Figure 10.
Modeled and measured concentrations of (a) TNO3 and NHx and (b) percentage of total in the gas phase during 19–31 January at the Fresno ground site.
Although gas-particle partitioning is generally predicted well, the fraction of TNO3 in the gas phase is sometimes overestimated in the model (Figure 10b). The overestimates of partitioning to the gas phase appear to be driven primarily by meteorology (i.e., RH and temperature, T) rather than issues with particle composition predictions. The modeled gas-phase fraction of TNO3 is relatively high when RH is less than 50% and T is greater than 285 K (Figure S15a). The overpredictions of the gas-phase fraction of TNO3 under these conditions could be due in part to challenges in representing the particle phase state under low RH conditions. Recall that the model assumes that crystallization does not occur and inorganic components exist as ions in supersaturated solutions for low RH (e.g., RH < MDRH). Previous studies have found that this assumption yields lower predicted NO3−concentrations compared with the stable equilibrium assumption for RH < ~50% (Ansari & Pandis, 2000; Fountoukis et al., 2009). To investigate the issue here, off-line simulations with ISORROPIA II were performed for cases of stable (i.e., including crystallization) and metastable (i.e., no crystallization) equilibrium using T, RH, and concentration inputs based on CMAQ output for hours where the sampling period average RH was <50%. These simulations confirmed that the phase state assumption influences partitioning predictions under the low-RH conditions in Fresno. For hours with RH between 37% and 54%, the average percentage of TNO3 in the gas phase was 50% for simulations based on the metastable assumption and 24% for the stable assumption. Segregation of results by time of day (Figure S15b) reveals that the overpredictions of partitioning of TNO3 to the gas phase occur in the afternoon. The overestimate of the decreasing trend in NO3− concentration in the afternoon in the top panel of Figure 9 could therefore be due in part to gas-particle partitioning prediction issues, which are sensitive to particle phase state assumptions under low RH conditions. Deposition rates of TNO3 are relatively large in the afternoon due to the relatively low atmospheric resistance of the convective boundary layer (Figure S16). The average simulated deposition velocity was 2.83 cm/s1 for HNO3 and 0.07 cm/s for accumulation mode particles during 12–17 PST for the 19–31 January period. Given the relatively high deposition velocity of HNO3 compared with that of fine particle NO3−, excessive partitioning of TNO3 to the gas phase could lead to excessive removal of TNO3 through HNO3 dry deposition in the afternoon.
3.4. Examining HNO3 Production
Previous studies and the current modeling indicate that the limiting precursor for NH4NO3formation in SJV is HNO3. Understanding chemical production of HNO3 is therefore important for understanding NH4NO3 formation. HNO3 production during daytime when OH levels are high is typically dominated by R1:
| (R1) |
At night, when OH mixing ratios are low and photolysis of NO3 radical is negligible, heterogeneous hydrolysis of gas-phase N2O5 with particle-phase H2O is important. This process has been represented with the overall formula (Sarwar et al., 2012; Sarwar et al., 2014).
| (R2) |
where Y is the yield of ClNO2 (Bertram & Thornton, 2009; Roberts et al., 2009). O3 is an important oxidant in the production of N2O5 at night:
| (R3) |
| (R4) |
| (R5) |
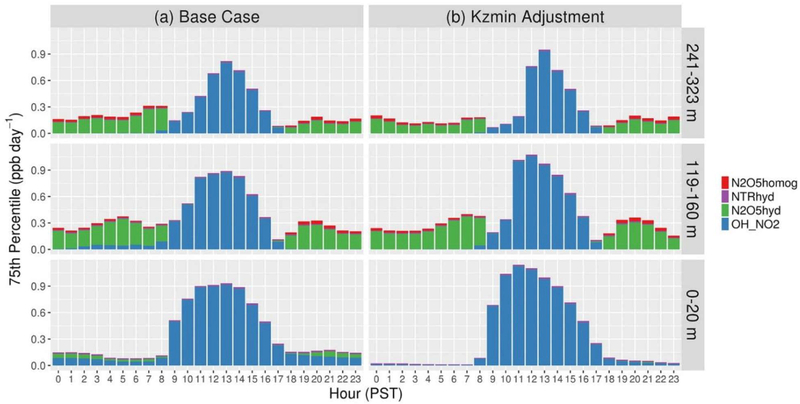
Hourly 75th percentile HNO3 production rates based on IRR results for R1, R2, homogeneous hydrolysis of N2O5 with water vapor, and heterogeneous hydrolysis of organic nitrates over Fresno are shown in Figure 11a for model layers 1, 5, and 7 during 17–22 January. Reaction of NO2 with OH (R1) dominates HNO3 production in all layers during daytime. Overnight, heterogeneous N2O5 hydrolysis (R2) dominates production in layers 5 and 7. This HNO3 can condense to form fine particle NO3− and increase surface NO3− concentrations in the morning as the daytime boundary layer develops (e.g., Figure 9). In the surface layer overnight, R1 and R2 contribute significantly to HNO3 production over Fresno in the model. OH mixing ratios that drive R1 are typically low at night because photolysis reactions important for OH production are negligible. The primary source of OH in the model at night is the reaction NO + HO2 → OH + NO2. This reaction is important in the model surface layer over Fresno because of the substantial NO emissions and the limited vertical mixing at night. HO2 sources in the model that do not directly depend on sunlight include reactions of organics with O3 and NO. Measured increases in surface NO3− concentrations in Fresno in the morning suggest that production in the ambient surface layer over Fresno is relatively small compared with production aloft. Therefore, there is evidence that modeled HNO3production in the nighttime surface layer over Fresno is too high. Also, O3 mixing ratios in the surface layer are overestimated at the Fresno site overnight during this period (Figure S17a). Observations indicate that O3 is almost entirely depleted at the site on most nights due to the high NOx levels and reactions such as R3 and R4. NOx mixing ratios are lower in the model than the ambient overnight and enable partial recovery of O3 mixing ratios following decreases during the evening rush hour when NOx emissions are high.
Figure 11.
Hourly 75th percentile HNO3 production rates by chemical pathway over Fresno for the (a) base simulation and (b) simulation with Kz,min = 0.01 m2/s for model layers 1, 5, and 7 during January 17–22. N2O5homog: homogeneous gas phase reaction of N2O5 + H2O; NTRhyd: heterogeneous hydrolysis of organic nitrates; N2O5hyd: heterogeneous hydrolysis of N2O5; and OH_NO2: reaction of OH + NO2.
The apparently excessive production of HNO3 in the model surface layer over Fresno at night appears to be due to overpredictions of O3 mixing ratios. The cause of high O3 mixing ratios in the surface layer in the model is vertical transport from higher layers. To test the impact of vertical mixing at night on the production of HNO3 over Fresno, a sensitivity simulation was conducted where CMAQ’s parameterization for the minimum eddy diffusivity (Kz,min) was replaced by a fixed Kz,min of 0.01 m2/s in all grid cells as is done in ACM2 in the WRF model. The Kz,min change reduced vertical mixing of species overnight over Fresno, because ACM2 in CMAQ uses higher Kz,min values in urban areas (USEPA, 2012a). O3depletion in the surface layer was nearly complete overnight during 17–22 January in the simulation with reduced vertical mixing (Figure S17b), and HNO3 production in the surface layer was significantly reduced compared with the base simulation (Figure 11b). However, the underestimate of the morning increase in NO3− was not resolved by reducing Kz,min. Modeled advection of the nocturnal residual layer from Fresno to the south likely contributed to the underestimate of the morning increase in NO3− in the model. In a simulation with increased CO emissions in Fresno grid cells, the largest impacts on CO mixing ratios aloft at night were to the south of Fresno during this period (Figure S18). Too much overnight transport of NO3− from the residual layer over Fresno to the south is consistent with underestimates of NO3− at the surface in the morning.
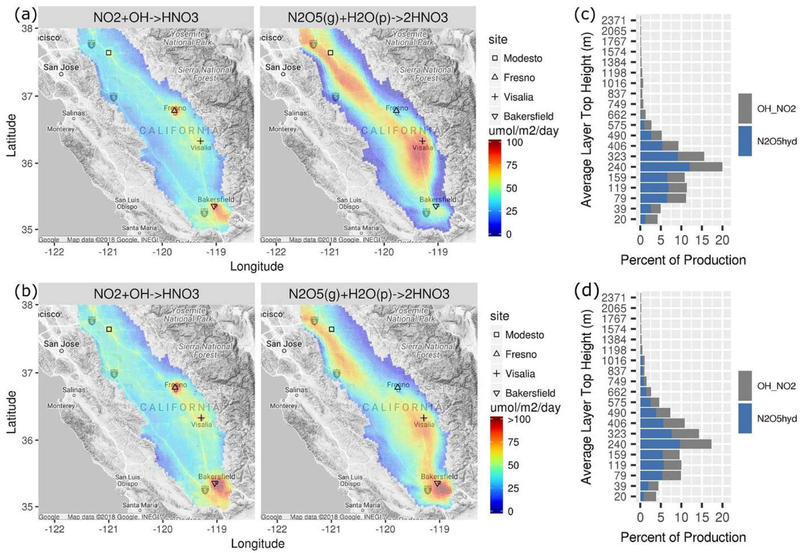
HNO3 production integrated over model layers 1–20 is shown in Figure 12a for SJV grid cells during 17–22 January. R1 is the dominant production pathway in urban areas with large NOx emissions such as Fresno and Bakersfield in the model. The R2 pathway is dominant in semiurban and rural areas along Highway 99, particularly around Visalia and in northern SJV. HNO3 production in SJV peaks in model layer 6 (160–240 m; Figure 12c). R1 is productive in the middle of the daytime boundary layer due to the combination of relatively high OH and NO2, and R2 tends to be most productive in the nocturnal residual layer due to the combination of high N2O5 and aerosol surface area (Riemer et al., 2003). Overall, the model estimates that R1 contributes 46% and R2 contributes 54% to total HNO3 production for the 17–22 January period when the model predicted elevated NO3−. This apportionment is similar to model estimates from previous episodes (Ying & Kleeman, 2009). In early February, when the model underpredicted NO3− concentrations, the modeled boundary layer was deeper during the day and production occurred over a wider range of altitudes (Figure 12d). The R2 pathway was relatively weak in the model in the area between Fresno and Bakersfield in early February (Figure 12b) compared with 17–22 January (Figure 12a).
Figure 12.
HNO3 production integrated over layers 1–20 for SJV model grid cells during (a) 17–22 January and (b) 30 January to 4 February and integrated over SJV grid cells by model layer during (c) 17–22 January and (d) 30 January to 4 February.
Pusede et al. (2016) predicted that HNO3 production from R1 would increase relative to R2 with decreasing NOx emissions. To explore the sensitivity of HNO3 production to NOx levels in the model, a sensitivity simulation was conducted with NOx emissions reduced by 40%. In this simulation, R1 contributed 49% to integrated HNO3 production during 17–22 January (i.e., production from R1 was enhanced relative to R2 compared with the base simulation). Decreases in NOx emissions lead to increases in OH mixing ratios in urban areas and along major highways in the model and thereby increase the percent contribution of R1 to total HNO3 production relative to that of the base simulation. This behavior is qualitatively consistent with predictions of Pusede et al. (2016), although that study focused on the entire winter period rather than the multiday episode considered here. A wide range of N2O5heterogeneous reaction probabilities (i.e., the fraction of gas-particle collisions that result in net removal of N2O5 from the gas phase, γ) have been used in previous studies of NO3−formation in SJV (e.g., Prabhakar et al., 2017; Ying & Kleeman, 2009), and studies have reported that the influence of organic coatings (not treated here) on γ can be important (e.g., Riemer et al., 2009) To explore the sensitivity of HNO3 production to γ and the ClNO2 yield (Y in R2), three additional simulations were conducted with γ scaled by 0.5 and 1.5 and with Y = 0. Total HNO3 production decreased by 11% relative to the base case when γ was reduced by 50% for the scenario in Figure 12a. A 24% reduction in HNO3 production from R2 was partially compensated for by a 5% increase in production from R1. Total HNO3production increased by 6% relative to the base case in the simulation with a 50% increase in γ. Setting the yield of ClNO2 to zero had negligible impact on HNO3 production consistent with the generally low concentrations of Cl− in SJV, although Cl− was underpredicted (Figure S14). A summary of HNO3 production in SJV for the base and sensitivity simulations is provided in Table S4, and γ values predicted over the P-3B spiral sites during 17–22 January are shown in Figure S19.
4. Conclusions
This study demonstrates that regional photochemical grid models are capable of simulating NH4NO3 formation and build-up during major recent PM2.5 episodes in SJV. For example, routine measurements of NO3− were generally predicted well at sites in SJV, including days where 24-hr average NO3− reached 20 μg/m3. Gas-particle partitioning predictions were in good agreement with measurements in Fresno and indicate that the model correctly predicts that NH4NO3 formation is limited by HNO3 availability. Modeled chemical production of HNO3 via daytime and nighttime pathways was generally consistent with reports from previous studies and conceptual models of NO3− formation in SJV. During a period of elevated NH4NO3, the model predicted that the OH + NO2 pathway contributed 46% to total HNO3 production in SJV and the N2O5 heterogeneous hydrolysis pathway contributed 54%. This result highlights the importance of nighttime chemistry in NO3−production in SJV.
Despite generally favorable model performance, the DISCOVER-AQ data set provided insights on areas where additional work could improve NH4NO3 modeling for SJV. First, additional study on meteorological modeling of the major stagnation events that drive PM2.5episodes in the Valley would be valuable, particularly for southern SJV where the terrain is more complex than in central and northern SJV. Challenges in simulating meteorology in southern SJV could help explain the better NO3− model performance for Fresno and Modesto than Bakersfield. Also, work toward improving the simulation of diurnal patterns of vertical mixing would be valuable, because the coupling and decoupling of processes in the surface layer from layers aloft influences HNO3 production and the diurnal profiles of NO3−at the surface. Additional evaluation of the degree to which urban-nonurban transport of NO3− occurs in the ambient would also be helpful because predictions suggest that this transport can be important. Improvements in meteorological modeling are likely necessary to improve performance against the hourly average NO3− measurements in Fresno. Second, additional work on NH3 emission and air quality modeling is warranted based on underpredictions of NH3 in emission source regions where very high mixing ratios were measured. Although the NH3 underpredictions do not appear to have a large impact on NO3− predications (because NO3− is generally HNO3-limited during wintertime episodes), NH3 levels are too low in the model in source regions and warrant further study. Improvements in the spatial allocation of NH3 emissions are also warranted, especially near Hanford. Third, there is evidence that gas-particle partitioning predictions under low-RH conditions could benefit from additional study. Although the overall impact of gas-particle partitioning issues may be minor due to the generally high RH during SJV PM2.5 episodes, the potential for premature removal of TNO3 via rapid deposition of HNO3 when the gas-phase fraction is overestimated in afternoon makes this an area of interest.
Another topic for future investigation is on HNO3 production in the nocturnal residual layer over urban and surrounding areas. Although this pathway is central to the conceptual model of NO3− formation in SJV, measurements that can directly constrain nighttime HNO3production aloft over SJV are extremely limited. Researchers have made progress by using indirect methods to infer characteristics of the nocturnal residual layer based on measurements over urban areas on the previous day and following morning, but direct measurements of the key species at night over urban and surrounding areas would be valuable.
Supplementary Material
Acknowledgments
This work was funded in part by the National Science Foundation Graduate Research Fellowship under grant DGE-1650042 and the California Agricultural Experiment Station (project CA-D-ETX-2102-H). PTR-ToF-MS measurements onboard the NASA P-3B were supported by the Austrian Federal Ministry for Transport, Innovation and Technology (bmvit) through the Austrian Space Applications Programme (ASAP) of the Austrian Research Promotion Agency (FFG). Markus Müller and Tomas Mikoviny are acknowledged for support in providing PTR-ToF-MS NH3 data. Contributions to the modeling platform are also acknowledged from Ellen Cooter, Rob Gilliam, Deborah Luecken, Limei Ran, Golam Sarwar, Alison Eyth, Chris Allen, Allan Beidler, James Beidler, and Lara Reynolds. All measurement data from the DISCOVER-AQ field campaign is available at http://www-air.larc.nasa.gov/cgi-bin/ArcView/discover-aq.ca-2013. The CMAQ model is available from https://github.com/USEPA/CMAQ. Data used in this study can also be requested through https://sciencehub.epa.gov/sciencehub/research_efforts/.
Footnotes
Publisher's Disclaimer: Disclaimer
The views in this manuscript are those of the authors alone and do not necessarily reflect the policy of the U.S. Environmental Protection Agency. The views expressed in this document are solely those of the authors and the EPA does not endorse any products or commercial services mentioned in this publication.
References
- Ansari AS, & Pandis SN (2000). The effect of metastable equilibrium states on the partitioning of nitrate between the gas and aerosol phases. Atmospheric Environment, 34(1), 157–168. 10.1016/S1352-2310 [DOI] [Google Scholar]
- Appel KW, Gilliam RC, Pleim JE, Pouliot GA, Wong DC, Hogrefe C, et al. (2014). Improvements to the WRF-CMAQ modeling system for fine-scale air quality simulations In EM: Air & Waste Management A ssociation Magazine for Environmental Managers (pp. 16–21). Pittsburgh, PA: Air & Waste Management Association. [Google Scholar]
- Appel KW, Napelenok SL, Foley KM, Pye HOT, Hogrefe C, Luecken DJ, et al. (2017). Description and evaluation of the Community Multiscale Air Quality (CMAQ) modeling system version 5.1. Geoscientific Model Development, 10(4), 1703–1732. 10.5194/gmd-10-1703-2017 [DOI] [PMC free article] [PubMed] [Google Scholar]
- Bash JO, Baker KR, & Beaver MR (2016). Evaluation of improved land use and canopy representation in BEIS v3.61 with biogenic VOC measurements in California. Geoscientific Model Development, 9(6), 2191–2207. 10.5194/gmd-9-2191-2016 [DOI] [Google Scholar]
- Bash JO, Cooter EJ, Dennis RL, Walker JT, & Pleim JE (2013). Evaluation of a regional air-quality model with bidirectional NH3 exchange coupled to an agroecosystem model. Biogeosciences, 10(3), 1635–1645. 10.5194/bg-10-1635-2013 [DOI] [Google Scholar]
- Bertram TH, & Thornton JA (2009). Toward a general parameterization of N2O5 reactivity on aqueous particles: The competing effects of particle liquid water, nitrate and chloride. Atmospheric Chemistry and Physics, 9(21), 8351–8363. 10.5194/acp-9-8351-2009 [DOI] [Google Scholar]
- Blanchard CL, Roth PM, Tanenbaum SJ, Ziman SD, & Seinfeld JH (2000). The use of ambient measurements to identify which precursor species limit aerosol nitrate formation. Journal of the Air & Waste Management Association, 50(12), 2073–2084. 10.1080/10473289.2000.10464239 [DOI] [PubMed] [Google Scholar]
- California Department of Food and Agriculture (2016a). California Department of Food and Agriculture, California Agriculural Statistics Review 2015–2016. Retrieved from https://www.cdfa.ca.gov/statistics/PDFs/2016
- California Department of Food and Agriculture (2016b). California Department of Food and Agriculture, Dairy Statistics: 2016 Annual Data. Retrieved from https://www.cdfa.ca.gov/dairy/pdf/Annual/2016/2016_Statistics_Annual.pdf
- CDOC (2015). California Department of Conservation, Division of Oil, Gas, & Geothermal Resources, 2015: Well Count and Oil and Gas Production by County. Retrieved from http://www.conservation.ca.gov/dog
- CDOF (2017). Calfornia Department of Finance, Press Release: Department of Finance Releases New State Population Projections. Retrieved from http://www.dof.ca.gov/Forecasting/Demographics/projections/documents/P_PressRelease.pdf
- Chen J, Lu J, Avise JC, DaMassa JA, Kleeman MJ, & Kaduwela AP (2014). Seasonal modeling of PM2.5 in California’s San Joaquin Valley. Atmospheric Environment, 92, 182–190. 10.1016/j.atmosenv.2014.04.030 [DOI] [Google Scholar]
- Chen J, Ying Q, & Kleeman MJ (2009). Source apportionment of visual impairment during the California regional PM10/PM2.5 air quality study. Atmospheric Environment, 43(39), 6136–6144. 10.1016/j.atmosenv.2009.09.010 [DOI] [Google Scholar]
- Chen J, Ying Q, & Kleeman MJ (2010). Source apportionment of wintertime secondary organic aerosol during the California regional PM10/PM2.5 air quality study. Atmospheric Environment, 44(10), 1331–1340. 10.1016/j.atmosenv.2009.07.010 [DOI] [Google Scholar]
- Chen LWA, Watson JG, Chow JC, & Magliano KL (2007). Quantifying PM2.5 source contributions for the San Joaquin Valley with multivariate receptor models. Environmental Science & Technology, 41(8), 2818–2826. 10.1021/es0225105 [DOI] [PubMed] [Google Scholar]
- Chow JC, Chen LWA, Watson JG, Lowenthal DH, Magliano KA, Turkiewicz K, & Lehrman DE (2006). PM2.5 chemical composition and spatiotemporal variability during the California Regional PM10/PM2.5 Air Quality Study (CRPAQS). Journal of Geophysical Research, 111, D10S04 10.1029/2005JD006457 [DOI] [Google Scholar]
- Collett JL, Hoag KJ, & Rao X (1999). Internal acid buffering in San Joaquin Valley fog drops and its influence on aerosol processing. Atmospheric Environment, 33(29), 4833–4847. 10.1016/s1352-2310(99)00221-6 [DOI] [Google Scholar]
- Collett JL, Hoag KJ, Sherman DE, Bator A, & Richards LW (1999). Spatial and temporal variations in San Joaquin Valley fog chemistry. Atmospheric Environment, 33(1), 129–140. [Google Scholar]
- Cooter EJ, Bash JO, Benson V, & Ran L (2012). Linking agricultural crop management and air quality models for regional to nationalscale nitrogen assessments. Biogeosciences, 9(10), 4023–4035. 10.5194/bg-9-4023-2012 [DOI] [Google Scholar]
- Davis JM, Bhave PV, & Foley KM (2008). Parameterization of N2O5 reaction probabilities on the surface of particles containing ammonium, sulfate, and nitrate. Atmospheric Chemistry and Physics, 8(17), 5295–5311. 10.5194/acp-8-5295-2008 [DOI] [Google Scholar]
- Dennis RL, Mathur R, Pleim JE, & Walker JT (2010). Fate of ammonia emissions at the local to regional scale as simulated by the community multiscale air quality model. Atmospheric Pollution Research, 1(4), 207–214. 10.5094/APR.2010.027 [DOI] [Google Scholar]
- Emery C, Liu Z, Russell AG, Odman MT, Yarwood G, & Kumar N (2017). Recommendations on statistics and benchmarks to assess photochemical model performance. Journal of the Air & Waste Management Association, 67(5), 582–598. 10.1080/10962247.2016.1265027 [DOI] [PubMed] [Google Scholar]
- Emery C, Tai E, and Yarwood G (2001), Enhanced Meterological Modeling and Performance Evaluation for Two Texas Ozone Episodes, Final report to Texas Natural Resources Conservation Commission. Retrieved from https://www.tceq.texas.gov/assets/public/implementation/air/am/contracts/reports/mm/EnhancedMetModelingAndPerformanceEvaluation.pdf
- Fountoukis C, & Nenes A (2007). ISORROPIA II: A computationally efficient thermodynamic equilibrium model for K+-Ca2+-Mg2+-NH4+-Na +-SO42--NO3-cl--H2O aerosols. Atmospheric Chemistry and Physics, 7(17), 4639–4659. 10.5194/acp-7-4639-2007 [DOI] [Google Scholar]
- Fountoukis C, Nenes A, Sullivan A, Weber R, Van Reken T, Fischer M, et al. (2009). Thermodynamic characterization of Mexico City aerosol during MILAGRO 2006. Atmospheric Chemistry and Physics, 9(6), 2141–2156. 10.5194/acp-9-2141-2009 [DOI] [Google Scholar]
- Ge XL, Setyan A, Sun YL, & Zhang Q (2012). Primary and secondary organic aerosols in Fresno, California during wintertime: Results from high resolution aerosol mass spectrometry. Journal of Geophysical Research, 117, D19301 10.1029/2012JD018026 [DOI] [Google Scholar]
- Ge XL, Zhang Q, Sun Y, Ruehl CR, & Setyan A (2012). Effect of aqueous-phase processing on aerosol chemistry and size distributions in Fresno, California, during wintertime. Environmental Chemistry, 9(3), 221–235. 10.1071/EN11168 [DOI] [Google Scholar]
- Gentner DR, Ford TB, Guha A, Boulanger K, Brioude J, Angevine WM, et al. (2014). Emissions of organic carbon and methane from petroleum and dairy operations in California’s San Joaquin Valley. Atmospheric Chemistry and Physics, 14(10), 4955–4978. 10.5194/acp-14-4955-2014 [DOI] [Google Scholar]
- Heald CL, Collett JL Jr, Lee T, Benedict KB, Schwandner FM, Li Y, et al. (2012). Atmospheric ammonia and particulate inorganic nitrogen over the United States. Atmospheric Chemistry and Physics, 12(21), 10,295–10,312. 10.5194/acp-12-10295-2012 [DOI] [Google Scholar]
- Herckes P, Marcotte AR, Wang Y, & Collett JL (2015). Fog composition in the Central Valley of California over three decades. Atmospheric Research, 151, 20–30. 10.1016/j.atmosres.2014.01.025 [DOI] [Google Scholar]
- Herner JD, Aw J, Gao O, Chang DP, & Kleeman MJ (2005). Size and composition distribution of airborne particulate matter in northern California: I—Particulate mass, carbon, and water-soluble ions. Journal of the Air & Waste Management Association, 55(1), 30–51. 10.1080/10473289.2005.10464600 [DOI] [PubMed] [Google Scholar]
- Herner JD, Ying Q, Aw J, Gao O, Chang DPY, & Kleeman MJ (2006). Dominant mechanisms that shape the airborne particle size and composition distribution in Central California. Aerosol Science and Technology, 40(10), 827–844. 10.1080/02786820600728668 [DOI] [Google Scholar]
- Hixson M, Mahmud A, Hu J, & Kleeman MJ (2012). Resolving the interactions between population density and air pollution emissions controls in the San Joaquin Valley, USA. Journal of the Air & Waste Management Association, 62(5), 566–575. 10.1080/10962247.2012.663325 [DOI] [PubMed] [Google Scholar]
- Houyoux MR, Vukovich JM, Coats CJ, Wheeler NJM, & Kasibhatla PS (2000). Emission inventory development and processing for the seasonal model for regional air quality (SMRAQ) project. Journal of Geophysical Research, 105(D7), 9079–9090. 10.1029/1999JD900975 [DOI] [Google Scholar]
- Jacob DJ, Munger JW, Waldman JM, & Hoffmann MR (1986). The H2SO4-HNO3-NH3 system at high humidities and in fogs: 1. Spatial and temporal patterns in the San Joaquin Valley of California. Journal of Geophysical Research, 91(D1), 1073–1088. 10.1029/JD091iD01p01073 [DOI] [Google Scholar]
- Jang JCC, Jeffries HE, & Tonnesen S (1995). Sensitivity of ozone to model grid resolution. 2. Detailed process analysis for ozone chemistry. Atmospheric Environment, 29(21), 3101–3114. 10.1016/1352-2310(95)00119-j [DOI] [Google Scholar]
- Jeffries HE, & Tonnesen S (1994). A comparison of 2 photochemical-reaction mechanisms using mass-balance and process analysis. Atmospheric Environment, 28(18), 2991–3003. 10.1016/1352-2310(94)90345-x [DOI] [Google Scholar]
- Kelly JT, Avise J, Cai C, & Kaduwela AP (2011). Simulating particle size distributions over California and impact on lung deposition fraction. Aerosol Science and Technology, 45(2), 148–162. 10.1080/02786826.2010.528078 [DOI] [Google Scholar]
- Kelly JT, Baker KR, Nolte CG, Napelenok SL, Keene WC, & Pszenny AAP (2016). Simulating the phase partitioning of NH3, HNO3, and HCl with size-resolved particles over northern Colorado in winter. Atmospheric Environment, 131, 67–77. 10.1016/j.atmosenv.2016.01.049 [DOI] [Google Scholar]
- Kelly JT, Baker KR, Nowak JB, Murphy JG, Markovic MZ, VandenBoer TC, et al. (2014). Fine-scale simulation of ammonium and nitrate over the South Coast Air Basin and San Joaquin Valley of California during CalNex-2010. Journal of Geophysical Research: Atmospheres, 119, 3600–3614. 10.1002/2013JD021290 [DOI] [Google Scholar]
- Kelly JT, Bhave PV, Nolte CG, Shankar U, & Foley KM (2010). Simulating emission and chemical evolution of coarse sea-salt particles in the Community Multiscale Air Quality (CMAQ) model. Geoscientific Model Development, 3(1), 257–273. 10.5194/gmd-3-257-2010 [DOI] [Google Scholar]
- Kelly JT, Wexler AS, Chan CK, & Chan MN (2008). Aerosol thermodynamics of potassium salts, double salts, and water content near the eutectic. Atmospheric Environment, 42(16), 3717–3728. 10.1016/j.atmosenv.2008.01.001 [DOI] [Google Scholar]
- Kim YJ, Spak SN, Carmichael GR, Riemer N, & Stanier CO (2014). Modeled aerosol nitrate formation pathways during wintertime in the Great Lakes region of North America. Journal of Geophysical Research: Atmospheres, 119, 12,420–12, 445 10.1002/2014JD022320 [DOI] [Google Scholar]
- Kleeman MJ, Ying Q, & Kaduwela A (2005). Control strategies for the reduction of airborne particulate nitrate in California’s San Joaquin Valley. Atmospheric Environment, 39(29), 5325–5341. 10.1016/j.atmosenv.2005.05.044 [DOI] [Google Scholar]
- Livingstone PL, Magliano K, Gürer K, Allen PD, Zhang KM, Ying Q, et al. (2009). Simulating PM concentration during a winter episode in a subtropical valley: Sensitivity simulations and evaluation methods. Atmospheric Environment, 43(37), 5971–5977. 10.1016/j.atmosenv.2009.07.033 [DOI] [Google Scholar]
- Lonsdale CR, Hegarty JD, Cady-Pereira KE, Alvarado MJ, Henze DK, Turner MD, et al. (2017). Modeling the diurnal variability of agricultural ammonia in Bakersfield, California, during the CalNex campaign. Atmospheric Chemistry and Physics, 17(4), 2721–2739. 10.5194/acp-17-2721-2017 [DOI] [Google Scholar]
- Lurmann FW, Brown SG, McCarthy MC, & Roberts PT (2006). Processes influencing secondary aerosol formation in the San Joaquin Valley during winter. Journal of the Air & Waste Management Association, 56(12), 1679–1693. 10.1080/10473289.2006.10464573 [DOI] [PubMed] [Google Scholar]
- McDonald BC, Dallmann TR, Martin EW, & Harley RA (2012). Long-term trends in nitrogen oxide emissions from motor vehicles at national, state, and air basin scales. Journal of Geophysical Research, 117, D00V18 10.1029/2012JD018304 [DOI] [Google Scholar]
- Meng Z, & Seinfeld JH (1996). Time scales to achieve atmospheric gas-aerosol equilibrium for volatile species. Atmospheric Environment, 30(16), 2889–2900. 10.1016/1352-2310(95)00493-9 [DOI] [Google Scholar]
- Miller DJ, Sun K, Tao L, Khan MA, & Zondlo MA (2014). Open-path, quantum cascade-laser-based sensor for high-resolution atmospheric ammonia measurements. Atmospheric Measurement Techniques, 7(1), 81–93. 10.5194/amt-7-81-2014 [DOI] [Google Scholar]
- Miller DJ, Sun K, Tao L, Pan D, Zondlo MA, Nowak JB, et al. (2015). Ammonia and methane dairy emission plumes in the San Joaquin Valley of California from individual feedlot to regional scales. Journal of Geophysical Research: Atmospheres, 120, 9718–9738. 10.1002/2015JD023241 [DOI] [Google Scholar]
- Mlawer EJ, Taubman SJ, Brown PD, Iacono MJ, & Clough SA (1997). Radiative transfer for inhomogeneous atmospheres: RRTM, a validated correlated-k model for the longwave. Journal of Geophysical Research, 102(D14), 16,663–16,682. 10.1029/97JD00237 [DOI] [Google Scholar]
- Morrison H, Thompson G, & Tatarskii V (2009). Impact of cloud microphysics on the development of trailing Stratiform precipitation in a simulated squall line: Comparison of one- and two-moment schemes. Monthly Weather Review, 137(3), 991–1007. 10.1175/2008mwr2556.1 [DOI] [Google Scholar]
- NASA (2017). Airborne science data for atmospheric composition. Retrieved from https://www.air.larc.nasa.gov/cgi-bin/ArcView/discoveraq.ca-2013
- Nenes A, Pandis SN, & Pilinis C (1998). ISORROPIA: A new thermodynamic equilibrium model for multiphase multicomponent inorganic aerosols. Aquatic Geochemistry, 4(1), 123–152. 10.1023/a:1009604003981 [DOI] [Google Scholar]
- NOAA (2017), Earth system research laboratory physical sciences division. Retrieved from ftp://ftp1.esrl.noaa.gov/psd2/data/realtime/Radar915/CnsWind/vis/2013/ Accessed June 2017
- Parworth CL, Young DE, Kim H, Zhang X, Cappa CD, Collier S, & Zhang Q (2017). Wintertime water-soluble aerosol composition and particle water content in Fresno, California. Journal of Geophysical Research: Atmospheres, 122, 3155–3170. 10.1002/2016JD026173 [DOI] [Google Scholar]
- Pleim JE (2007). A combined local and nonlocal closure model for the atmospheric boundary layer. Part I: Model Description and Testing. Journal of Applied Meteorology and Climatology, 46(9), 1383–1395. 10.1175/jam2539.1 [DOI] [Google Scholar]
- Pleim JE, Bash JO, Walker JT, & Cooter EJ (2013). Development and evaluation of an ammonia bidirectional flux parameterization for air quality models. Journal of Geophysical Research-Atmospheres, 118, 3794–3806. 10.1002/jgrd.50262 [DOI] [Google Scholar]
- Pleim JE, & Xiu A (2003). Development of a land surface model. Part II: Data Assimilation. Journal of Applied Meteorology, 42(12), 1811–1822. 10.1175/1520-0450(2003)042%3C1811:doalsm%3E2.0.co;2 [DOI] [Google Scholar]
- Prabhakar G, Parworth CL, Zhang X, Kim H, Young DE, Beyersdorf AJ, et al. (2017). Observational assessment of the role of nocturnal residual-layer chemistry in determining daytime surface particulate nitrate concentrations. Atmospheric Chemistry and Physics, 17(23), 14,747–14,770. 10.5194/acp-17-14747-2017 [DOI] [PMC free article] [PubMed] [Google Scholar]
- Pun BK, Balmori RTF, & Seigneur C (2009). Modeling wintertime particulate matter formation in Central California. Atmospheric Environment, 43(2), 402–409. 10.1016/j.atmosenv.2008.08.040 [DOI] [Google Scholar]
- Pun BK, & Seigneur C (1999). Understanding particulate matter formation in the California San Joaquin Valley: Conceptual model and data needs. Atmospheric Environment, 33(29), 4865–4875. 10.1016/S1352-2310(99)00266-6 [DOI] [Google Scholar]
- Pun BK, & Seigneur C (2001). Sensitivity of particulate matter nitrate formation to precursor emissions in the California San Joaquin Valley. Environmental Science & Technology, 35(14), 2979–2987. 10.1021/es0018973 [DOI] [PubMed] [Google Scholar]
- Pusede SE, & Cohen RC (2012). On the observed response of ozone to NOx and VOC reactivity reductions in San Joaquin Valley California 1995-present. Atmospheric Chemistry and Physics, 12(18), 8323–8339. 10.5194/acp-12-8323-2012 [DOI] [Google Scholar]
- Pusede SE, Duffey KC, Shusterman AA, Saleh A, Laughner JL, Wooldridge PJ, et al. (2016). On the effectiveness of nitrogen oxide reductions as a control over ammonium nitrate aerosol. Atmospheric Chemistry and Physics, 16(4), 2575–2596. 10.5194/acp-16-2575-2016 [DOI] [Google Scholar]
- Pusede SE, Gentner DR, Wooldridge PJ, Browne EC, Rollins AW, Min KE, et al. (2014). On the temperature dependence of organic reactivity, nitrogen oxides, ozone production, and the impact of emission controls in San Joaquin Valley, California. Atmospheric Chemistry and Physics, 14(7), 3373–3395. 10.5194/acp-14-3373-2014 [DOI] [Google Scholar]
- Riemer N, Vogel H, Vogel B, Anttila T, Kiendler-Scharr A, & Mentel TF (2009). Relative importance of organic coatings for the heterogeneous hydrolysis of N2O5 during summer in Europe. Journal of Geophysical Research, 114, D17307 10.1029/2008JD011369 [DOI] [Google Scholar]
- Riemer N, Vogel H, Vogel B, Schell B, Ackermann I, Kessler C, & Hass H (2003). Impact of the heterogeneous hydrolysis of N2O5 on chemistry and nitrate aerosol formation in the lower troposphere under photosmog conditions. Journal of Geophysical Research, 108(D4), 4144 10.1029/2002JD002436 [DOI] [Google Scholar]
- Roberts JM, Osthoff HD, Brown SS, Ravishankara AR, Coffman D, Quinn P, & Bates T (2009). Laboratory studies of products of N2O5 uptake on Cl_containing substrates. Geophysical Research Letters, 36, L20808 10.1029/2009GL040448 [DOI] [Google Scholar]
- Russell AR, Valin LC, & Cohen RC (2012). Trends in OMI NO2 observations over the United States: Effects of emission control technology and the economic recession. Atmospheric Chemistry and Physics, 12(24), 12,197–12,209. 10.5194/acp-12-12197-2012 [DOI] [Google Scholar]
- Sarwar G, Simon H, Bhave P, & Yarwood G (2012). Examining the impact of heterogeneous nitryl chloride production on air quality across the United States. Atmospheric Chemistry and Physics, 12(14), 6455–6473. 10.5194/acp-12-6455-2012 [DOI] [Google Scholar]
- Sarwar G, Simon H, Xing J, & Mathur R (2014). Importance of tropospheric ClNO2 chemistry across the Northern Hemisphere. Geophysical Research Letters, 41, 4050–4058. 10.1002/2014GL059962 [DOI] [Google Scholar]
- Schiferl LD, Heald CL, Nowak JB, Holloway JS, Neuman JA, Bahreini R, et al. (2014). An investigation of ammonia and inorganic particulate matter in California during the CalNex campaign. Journal of Geophysical Research: Atmospheres, 119, 1883–1902. 10.1002/2013JD020765 [DOI] [Google Scholar]
- Shephard MW, & Cady-Pereira KE (2015). Cross-track Infrared Sounder (CrIS) satellite observations of tropospheric ammonia. Atmospheric Measurement Techniques, 8(3), 1323–1336. 10.5194/amt-8-1323-2015 [DOI] [Google Scholar]
- Simon H, Kimura Y, McGaughey G, Allen DT, Brown SS, Coffman D, et al. (2010). Modeling heterogeneous ClNO2 formation, chloride availability, and chlorine cycling in Southeast Texas. Atmospheric Environment, 44(40), 5476–5488. 10.1016/j.atmosenv.2009.09.006 [DOI] [Google Scholar]
- SJVAPCD (2012). San Joaquin Valley Air Pollution Control District, 2012 PM2.5 Plan. Retrieved from http://www.valleyair.org/Air_Quality_Plans/PM25Plans2012.htm
- SJVAPCD (2016). San Joaquin Valley Air Pollution Control District, 2016 Moderate Area Plan for the 2012 PM2.5 Standard. Retrieved from http://www.valleyair.org/Air_Quality_Plans/PM25Plans2016.htm
- Skamarock WC, Klemp JB, Dudhia J, Gill DO, Barker DM, Duda MG, et al. (2008). A description of the Advanced Reserch WRF version 3. NCAR Technical Note NCAR/TN-475+STR.
- Stockwell WR, Watson JG, Robinson NF, Steiner W, & Sylte WW (2000). The ammonium nitrate particle equivalent of NOx emissions for wintertime conditions in Central California’s San Joaquin Valley. Atmospheric Environment, 34(27), 4711–4717. 10.1016/S1352-2310(00)00148-5 [DOI] [Google Scholar]
- Sun K, Cady-Pereira K, Miller DJ, Tao L, Zondlo MA, Nowak JB, et al. (2015). Validation of TES ammonia observations at the single pixel scale in the San Joaquin Valley during DISCOVER-AQ. Journal of Geophysical Research: Atmospheres, 120, 5140–5154. 10.1002/2014JD022846 [DOI] [Google Scholar]
- Sun K, Tao L, Miller DJ, Khan MA, & Zondlo MA (2014). On-road Ammonia emissions characterized by mobile, open-path measurements. Environmental Science & Technology, 48(7), 3943–3950. 10.1021/es4047704 [DOI] [PubMed] [Google Scholar]
- USEPA (2012a). CMAQ version 5.0 (February 2012 release) technical documentation. Retrieved from https://www.airqualitymodeling.org/index.php/CMAQ_version_5.0_(February_2012_release)_Technical_Documentation [Google Scholar]
- USEPA (2012b). Technical Support Document (TSD) Preparation of Emissions Inventories for the Version 5.0, 2007 Emissions Modeling Platform. Retrieved from https://www.epa.gov/sites/production/files/201510/documents/2007v5_2020base_emismod_tsd_13dec2012.pdf
- USEPA (2016). 2011 National Emissions Inventory, Version 2. Technical Support Document Retrieved from https://www.epa.gov/sites/production/files/2015-10/documents/nei2011v2_tsd_14aug2015.pdf
- USEPA (2017a). Air quality system Retrieved from https://www.epa.gov/aqs
- USEPA (2017b). Bayesian space-time downscaling fusion model (downscaler)-derived estimates of air quality for 2013.
- USEPA (2017c). Bayesian space-time downscaling fusion model (downscaler)-derived estimates of air quality for 2013. Retrieved from https://www.epa.gov/hesc/rsig-related-downloadable-data-files
- Walker JM, Philip S, Martin RV, & Seinfeld JH (2012). Simulation of nitrate, sulfate, and ammonium aerosols over the United States. Atmospheric Chemistry and Physics, 12(22), 11,213–11,227. 10.5194/acp-12-11213-2012 [DOI] [Google Scholar]
- Watson JG, & Chow JC (2002). A wintertime PM2.5 episode at the Fresno, CA, supersite. Atmospheric Environment, 36(3), 465–475. 10.1016/S1352-2310(01)00309-0 [DOI] [Google Scholar]
- Watson JG, DuBois DW, DeMandel R, Kaduwela A, Magliano KL, McDade C, et al. (1998). Field program plan for the California Regional PM2.5/PM10Air Quality Study (CRPAQS), Desert Research Institute, Reno, NV, Retrieved from http://www.arb.ca.gov/airways/crpaqs/publications.htm
- Weibring P, Richter D, Fried A, Walega JG, & Dyroff C (2006). Ultra-high-precision mid-IR spectrometer II: System description and spectroscopic performance. Applied Physics B, 85(2–3), 207–218. 10.1007/s00340-006-2300-4 [DOI] [Google Scholar]
- Wexler AS, & Seinfeld JH (1991). Second-generation inorganic aerosol model. Atmospheric Environment Part A: General Topics, 25(12), 2731–2748. 10.1016/0960-1686(91)90203- [DOI] [Google Scholar]
- Womack CC, Neuman JA, Veres PR, Eilerman SJ, Brock CA, Decker ZCJ, et al. (2017). Evaluation of the accuracy of thermal dissociation CRDS and LIF techniques for atmospheric measurement of reactive nitrogen species. Atmospheric Measurement Techniques, 10(5), 1911–1926. 10.5194/amt-10-1911-2017 [DOI] [Google Scholar]
- Ying Q (2011). Physical and chemical processes of wintertime secondary nitrate aerosol formation. Frontiers of Environmental Science & Engineering in China, 5(3), 348–361. 10.1007/s11783-011-0343-1 [DOI] [Google Scholar]
- Ying Q, & Kleeman M (2009). Regional contributions to airborne particulate matter in central California during a severe pollution episode. Atmospheric Environment, 43(6), 1218–1228. 10.1016/j.atmosenv.2008.11.019 [DOI] [Google Scholar]
- Ying Q, Lu J, Allen P, Livingstone P, Kaduwela A, & Kleeman M (2008). Modeling air quality during the California Regional PM10/PM2.5 Air Quality Study (CRPAQS) using the UCD/CIT source-oriented air quality model—Part I. Base case model results. Atmospheric Environment, 42(39), 8954–8966. 10.1016/j.atmosenv.2008.05.064 [DOI] [Google Scholar]
- Ying Q, Lu J, Kaduwela A, & Kleeman M (2008). Modeling air quality during the California Regional PM10/PM2.5 Air Quality Study (CPRAQS) using the UCD/CIT Source Oriented Air Quality Model—Part II. Regional source apportionment of primary airborne particulate matter. Atmospheric Environment, 42(39), 8967–8978. 10.1016/j.atmosenv.2008.05.065 [DOI] [Google Scholar]
- Ying Q, Lu J, & Kleeman M (2009). Modeling air quality during the California Regional PM10/PM2.5 Air Quality Study (CPRAQS) using the UCD/CIT source-oriented air quality model—Part III. Regional source apportionment of secondary and total airborne particulate matter. Atmospheric Environment, 43(2), 419–430. 10.1016/j.atmosenv.2008.08.033 [DOI] [Google Scholar]
- Young DE, Kim H, Parworth C, Zhou S, Zhang XL, Cappa CD, et al. (2016). Influences of emission sources and meteorology on aerosol chemistry in a polluted urban environment: Results from DISCOVER-AQ California. Atmospheric Chemistry and Physics, 16(8), 5427–5451. 10.5194/acp-16-5427-2016 [DOI] [Google Scholar]
- Zhang XL, Kim H, Parworth CL, Young DE, Zhang Q, Metcalf AR, & Cappa CD (2016). Optical properties of wintertime aerosols from residential wood burning in Fresno, CA: Results from DISCOVER-AQ 2013. Environmental Science & Technology, 50(4), 1681–1690. 10.1021/acs.est.5b04134 [DOI] [PubMed] [Google Scholar]
- Zhang Y, Liu P, Liu X-H, Pun B, Seigneur C, Jacobson MZ, & Wang W-X (2010). Fine scale modeling of wintertime aerosol mass, number, and size distributions in Central California. Journal of Geophysical Research, 115, D15207 10.1029/2009JD012950 [DOI] [Google Scholar]
- Zhu L, Henze D, Bash J, Jeong GR, Cady-Pereira K, Shephard M, et al. (2015). Global evaluation of ammonia bidirectional exchange and livestock diurnal variation schemes. Atmospheric Chemistry and Physics, 15(22), 12,823–12,843. 10.5194/acp-15-12823-2015 [DOI] [Google Scholar]
Associated Data
This section collects any data citations, data availability statements, or supplementary materials included in this article.


