

Key Points
Question
Do patients whose eyes have myopia, open-angle glaucoma, or both exhibit decreased peripapillary perfused capillary density?
Findings
In this cross-sectional study, 87 people with myopic eyes with glaucoma, 17 patients with myopic eyes without glaucoma, 93 patients with non-myopic eyes with glaucoma, and 51 control participants were assessed for perfused capillary density via optical coherence tomography angiography and customized software. The presence of PCD was associated with a progressive decrease from control status and myopia without glaucoma to nonmyopia with glaucoma to myopia with glaucoma.
Meaning
These findings suggest that open-angle glaucoma might have a greater effect on perfused capillary density than myopia does.
This cross-sectional study compares peripapillary perfused capillary density in patients with myopic eyes with and without glaucoma.
Abstract
Importance
This study used optical coherence tomographic angiography to assess for impaired blood flow in myopic eyes with or without open-angle glaucoma.
Objective
To compare the peripapillary perfused capillary density (PCD) between eyes with and without glaucoma.
Design, Setting, and Participants
In this cross-sectional study at a tertiary glaucoma referral practice, we recruited patients with myopic eyes of spherical equivalent of more than −3.0 diopters with and without open-angle glaucoma, patients with nonmyopic eyes with glaucoma, and patients with no disease from February 2016 to October 2016. We obtained 4.5 × 4.5-mm optical coherence tomographic angiography images of the optic nerve head and calculated PCD as the ratio of pixels associated with capillaries to the number of pixels in the region of interest after large blood vessel removal. Both eyes of each patient were used in the analysis. Continuous variables were assessed by analysis of variance and Tukey tests. A marginal model of generalized estimating equations was performed to adjust for confounding factors and intraclass correlations.
Main Outcomes and Measures
Mean PCD.
Results
We matched 87 patients with myopic eyes with glaucoma (of whom 39 [45%] were women), 17 with myopic eyes without glaucoma (of whom 10 [59%] were women), and 93 with non-myopic eyes with glaucoma (of whom 55 [59%] were women) for visual field defects and included 51 control participants (or whom 38 [75%] were women). Mean (SD) ages were 67.5 (12.0) years for patients with myopia and glaucoma, 48.2 (19.0) years for those with myopia without glaucoma, 67.3 (11.0) years for those with glaucoma without myopia, and 64.7 (8.9) years in control participants. Global PCD demonstrated a progressive decrease from the control group (mean [SD], 41.0 [4.2]) to those with myopia without glaucoma (38.4 [5.8]) to those with glaucoma without myopia (31.9 [7.5]) to those with both (28.2 [6.0]; all P < .001). The mean difference in global PCD between the 3 groups and control group, adjusted for age and axial length, was greatest in those with myopia and glaucoma (−11.1; 95% CI, −14.0 to −8.1; P < .001), followed by those with glaucoma without myopia (−8.6; 95% CI, −10.9 to −6.3; P < .001) and those with myopia without glaucoma (−2.8; 95% CI, −6.9 to 1.2; P = .17). No interaction was found between glaucoma and myopia.
Conclusions and Relevance
These findings demonstrate peripapillary microvascular attenuation to a greater extent in open-angle glaucoma than myopia. The cross-sectional design means we cannot determine if this association is a cause and/or is associated with other confounding factors.
Introduction
Myopia affects more than 1.4 billion people worldwide,1 with pathologic or high myopia affecting 6% to 18% of the myopic population and 1% of the general population.2 Although myopia increases the risk of open-angle glaucoma (OAG) approximately 2-fold to 3-fold,3,4 the pathophysiologic mechanisms underlying this association remain unclear. In addition to intraocular pressure (IOP)–induced stress and strain within the lamina cribrosa and peripapillary sclera,5 impaired blood flow and subsequent hypoxic injury to the retinal ganglion cells may also play a role in the pathophysiology of OAG.6,7 Additionally, decreased blood flow increases the vulnerability of the optic nerve to the deleterious effects of elevated IOP.
In highly myopic eyes, reduced retinal vessel density and impaired blood flow within the large retinal vessels are visible on laser Doppler velocimetry and optical coherence tomography angiography (OCTA), largely because of narrowing of vessel diameters.8,9,10,11,12 In addition, decreased choroidal blood flow has been associated with increased axial length in studies using color Doppler ultrasonography and Langham ocular blood flow computerized tonometry.13,14,15 Ocular elongation associated with myopia may thin retinal tissue and thus reduce oxygen requirements, leading to decreased blood circulation and retinal microvascular attenuation.9 Indeed, evidence of abnormal peripapillary and macular microvasculature has been observed in highly myopic individuals.10,12
Within the microvasculature, the radial peripapillary capillaries form a unique capillary network within the retinal nerve fiber layer (RNFL) and play a crucial role in satisfying the metabolic requirements of retinal ganglion cells axons.16,17 Previous investigations have implicated vascular factors in OAG pathogenesis, possibly through disruption of the radial peripapillary capillaries.11,18,19,20 In addition, axial length has been shown to negatively correlate with the peripapillary retinal flow index.12 Since there is a close association between myopia and OAG, and since decreased blood flow has been reported in both conditions, we hypothesized that decreased blood flow in myopia may potentiate the compromised blood supply to the optic nerve in OAG.
A novel noninvasive imaging technique, OCTA, has been widely used in investigations of retinal pathologies and glaucoma.21,22,23,24 However, to our knowledge, quantitative analysis of the peripapillary microvasculature in myopia with and without OAG using OCTA has not yet been reported. In this study, we evaluated the retinal vessel density parameters using OCTA in myopic eyes with and without OAG.
Methods
This prospective, cross-sectional, observational study was approved by the New York Eye and Ear Infirmary of Mount Sinai institutional review board. Written informed consent was obtained from all participants, and the study adhered to Health Insurance Portability and Accountability Act and the tenets of the Declaration of Helsinki.
Participants
This study included patients with myopia with or without glaucoma, who were recruited from February 1, 2016, to October 31, 2016. The inclusion criteria for all groups were best-corrected visual acuity greater than or equal to 20/40 and an age older than 20 years. For study purposes, we defined non-myopic eyes as a refractive error plus or minus 3 diopters and myopia as a spherical equivalent of −3 diopters or more.
Further inclusion criteria for control participants included no evidence of retinal pathology or glaucoma, IOP of 21 mm Hg or less, no chronic ocular or systemic corticosteroid use, an open anterior chamber angle on gonioscopy, normal-appearing optic discs, global circumpapillary RNFL thickness measured on OCTA within the 95% CI of the mean, and no visual field defects on 24-2 Swedish interactive thresholding algorithm standard visual examination tests.
Open-angle glaucoma was defined as a glaucomatous-appearing optic nerve (ie, neuroretinal rim thinning or notching), an open anterior chamber angle on gonioscopy, and RNFL thinning on OCT greater than or less than the 95% CI of the mean. A visual field defect was defined as 3 contiguous points at a 5% level of significance on the pattern deviation plot, with 1 of the 3 points at a 1% level of significance; a glaucoma hemifield test outside normal limits; or a pattern standard deviation outside normal limits (P < .05), consistent with a glaucomatous pattern. Cutoffs for low test reliability included 20% false positives, 20% false negatives, and 20% fixation losses. In classifying participants with primary OAG by disease stage, mild was defined as a mean deviation (MD) of less than −6 dB, moderate as −6 to −12 dB, and severe as more than than −12 dB.
Exclusion criteria for all eyes included a history of ocular surgery apart from uncomplicated cataract surgery, vitreoretinal diseases or nonglaucomatous optic neuropathy, chronic ocular or systemic corticosteroid use, diabetes mellitus, and cardiovascular disease other than treated systemic hypertension. Both eyes from each participant were imaged and analyzed.
Clinical Examinations
All participants underwent a comprehensive ophthalmic examination, including measurements of best-corrected visual acuity (BCVA) (Snellen), anterior segment slitlamp biomicroscopy, IOP measurement using Goldmann applanation tonometry, and dilated fundus examination using a 78-diopter non contact slitlamp lens (Volk Optical). Visual field examinations were performed on the Humphrey Visual Field Analyzer (Humphrey Instruments Model 740; Carl Zeiss Meditec) using the 24-2 Swedish interactive thresholding algorithm standard program. Retinal nerve fiber layer analysis was performed on the OCT (Spectralis OCT, version 6.0.11.0 + Glaucoma Module Premium Edition Software; Heidelberg Engineering).
Optical Coherence Tomography Angiography
All OCTA images were obtained with a commercial spectral-domain OCT system (AngioVue Software Version 2015.100.0.35; OptoVue). Each patient underwent a single imaging session consisting of 2 volumetric raster scans (1 vertical and 1 horizontal) centered on the optic nerve head and covering 4.5 × 4.5 mm. Each raster scan consisted of 304 brightness scans, which were each scanned twice, for a total 608 brightness scans. Each brightness scan consisted of 304 amplitude scans. With an amplitude scan rate of 70 000 A-scans per second, each raster scan took less than 3 seconds.
To produce images of perfused vessels, split-spectrum amplitude decorrelation angiography was used.25 Additional software segmented the cross-sectional OCTA retinal image into distinct layers. To sample the radial peripapillary capillaries vasculature, we analyzed the vessels located between the internal limiting membrane and the posterior boundary of the RNFL.20 After reviewing the raw images by the investigator (Y.S.), images with significant background noise, motion artifacts, signal strength index of less than 40, and segmentation within the regions of interest (ROIs) were excluded.
OCTA Image Analysis
All OCTA images were analyzed using a custom MATLAB program (MathWorks).18 Each grayscale OCTA image (304 × 304 pixels) was resized by a factor of 6 (producing an image of 1824 × 1824 pixels) to allow division of the image into smaller portions than was achievable in the original, unscaled image. The contrast of each resized image was normalized by using the highest and lowest 1% of pixel intensity values as the upper and lower limits, respectively. Global thresholding was performed to convert the grayscale OCTA image into a binary image by replacing all pixel intensities greater than 0.55 with the value 1 (white, representing vessels) and the remaining pixels with the value 0 (black, representing background). This binary image was used to remove pixels associated with major blood vessels (Figure 1). After the removal of large blood vessels using the binary image, local adaptive thresholding was performed using a sampling window size of 15 × 15 pixels to account for local differences in brightness throughout the image.18,24
Figure 1. Optical Coherence Tomography Angiography Image Processing Steps.

A, Contrast stretched grayscale 4.5-mm OCTA image of a control eye; B, Major blood vessel mask binary image; C, Capillary segmentation after the removal of major blood vessels; D, Color-coded perfused capillary density map with adjoining scale.
Annular and Sectoral Perfused Capillary Density (Percentage)
To calculate annular and sectoral PCD, a 3.45-mm-diameter outer circle was manually placed by an author experienced in these examinations (Y.S.) concentric to the inner 1.95-mm circle, producing an annular ROI 0.75 mm wide. This 3.45-mm outer circle diameter parallels the dimensions of the standard circumpapillary RNFL circle scan currently used in most commercially available OCT systems. To ensure that the same ROI was included in all OCTA images, the PCD within a fixed annular ROI was extracted for quantitative analysis. The PCD was then calculated as a percentage by dividing the area associated with perfused capillaries (white pixels) by the area of the ROI in question (either the entire annulus or 1 of the four 90° sectors). A color-coded PCD map was generated by computing the PCD within successive 16 × 16-pixel sampling windows with 8-pixel overlaps across the binary image. Global PCD was calculated by generating a percentage of the number of pixels associated with perfused capillaries divided by the number of pixels in the entire image, after removal of the inner 1.95-mm circular area and the major blood vessels.
Statistical Analysis
Descriptive statistics were calculated as the mean and standard deviation for normally distributed variables and median, first quartile, and third quartile for variables distributed non-normally. Categorical variables were analyzed using the Fisher exact test. Continuous variables were analyzed using an age-adjusted analysis of variance to assess for differences among the 4 groups, and a Tukey-Kramer honest significant difference test to assess the differences between pairs of groups. A marginal model of generalized estimating equations was performed to adjust for confounding factors (age, axial length, and stage) and intraclass correlation. All statistical analyses were performed with Stata, version 14 (StataCorp). The α level (type 1 error) was set at .05 for all comparisons.
Results
Study Population
Initially, 250 patients whose eyes were with or without glaucoma met the inclusion criteria for this study. Two patients were excluded because of unacceptable OCT angiography image quality. Thus, a total of 87 patients whose eyes had myopia with glaucoma (mean [SD] age, 67.5 [12.0] years), 17 patients whose eyes had myopia without glaucoma (mean [SD] age, 48.2 [19.0] years), 93 patients whose eyes had glaucoma without myopia (mean [SD] age, 67.3 [11.0] years), and 51 control participants (mean [SD] age, 64.7 [8.9] years) were included. In the cohort with myopia with glaucoma, 39 (45%) were women; among those with myopia without glaucoma, 10 (59%); among those with glaucoma without myopia, 55 (59%); and among controls, 38 (75%).
There were significant differences among the 4 groups in spherical equivalent refractive error, axial length, RNFL thickness, and visual field indices (Table 1). There was an equal distribution of patients with early, moderate, and severe glaucoma in the glaucoma without myopia and myopia with glaucoma groups. There was no difference in mean visual field mean deviation and visual field pattern standard deviation between those with myopia without glaucoma and control participants and between those with glaucoma without myopia and those with myopia with glaucoma (eTable 1 in the Supplement).
Table 1. Clinical and Demographic Characteristics of Subgroups.
| Characteristica | No. (%) | |||
|---|---|---|---|---|
| Control Participants (n = 51) | Patients With Glaucoma Without Myopia (n = 93) | Patients With Myopia Without Glaucoma (n = 17) | Patients With Myopic Glaucoma (n = 87) | |
| Age, y, mean (SD) | 64.7 (8.9) | 67.3 (11.0) | 48.2 (19.0) | 67.5 (12.0) |
| Female | 38 (74.5) | 55 (59.1) | 10 (58.8) | 39 (44.8) |
| Race | ||||
| Asian | 37 (66.7) | 38 (40.9) | 11 (64.7) | 17 (19.5) |
| Black | 0 (0.0) | 1 (1.1) | 0 (0.0) | 4 (4.6) |
| White | 17 (33.3) | 54 (58.1) | 6 (35.3) | 66 (57.7) |
| Axial length, mm, mean (SD) | 22.6 (1.6) | 23.5 (1.9) | 25.6 (1.9) | 26.2 (1.6) |
| Range | (19.5 to 26.1) | (19.0 to 28.4) | (22.1 to 29.3) | (22.0 to 31.0) |
| Refractive error, D, mean (SD) | −0.50 (1.8) | −0.2 (1.9) | −5.2 (2.1) | −6.4 (2.9 |
| Range | (−2.8 to 4.3) | (−2.8 to 10) | (−9.3 to −3) | (−15.8 to −3) |
| Visual field parameters, dB, mean (SD) | ||||
| Mean deviation | −0.1 (1.1) | −7.8 (9.1) | −0.5 (1.0) | −7.2 (6.8) |
| Pattern standard deviation | 1.1 (1.0) | 7.2 (4.3) | 1.1 (0.8) | 6.7 (4.2) |
| RNFL thickness, microns, mean (SD) | 99.9 (10.1) | 73.6 (15.9) | 97.5 (14.1) | 65.4 (13.4) |
| Glaucoma severity | ||||
| Mild | NA | 44 (47) | NA | 44 (51) |
| Moderate | NA | 16 (17) | NA | 20 (23) |
| Severe | NA | 30 (32) | NA | 20 (23) |
| No data | NA | 3 (3) | NA | 3 (3) |
| PCD, mean (SD) | ||||
| Global | 41.0 (4.2) | 31.9 (7.5) | 38.4 (5.8) | 28.2 (6.0) |
| Annular | 42.6 (4.0) | 33.5 (8.0) | 40.3 (6.2) | 30.1 (6.5) |
| Superior | 42.3 (4.8) | 32.6 (8.8) | 39.8 (6.7) | 28.3 (8.2) |
| Nasal | 42.2 (5.0) | 32.0 (9.7) | 39.3 (8.1) | 28.8 (6.8) |
| Inferior | 43.1 (2.9) | 34.5 (9.1) | 40.0 (7.0) | 31.5 (8.4) |
| Temporal | 42.9 (4.9) | 35.1 (9.0) | 42.2 (4.3) | 31.6 (8.4) |
Abbreviations: NA, not available; PCD, peripapillary perfused capillary density; RNFL, retinal nerve fiber layer.
Data are reported as number (percentage) unless otherwise marked.
PCD Analysis
The comparisons of global, annular, and sectoral PCD are displayed in Table 1. Global PCD demonstrated a progressive decrease from controls (mean [SD], 41.0 [4.2]) to those with myopia without glaucoma (mean [SD], 38.4 [5.8]) to patients with glaucoma without myopia (mean [SD], 31.9 [7.5]) to patients with myopia with glaucoma (mean [SD], 28.2 [6.0]) (Figure 2; P < .001). Annular PCDs demonstrated a similar progressive decrease from controls (mean [SD], 42.6 [4.0]) to those with myopia without glaucoma (mean [SD], 40.3 [6.2]) to patients with glaucoma without myopia (mean [SD], 33.5 [8.2]) to patients with myopia with glaucoma (mean [SD], 30.1 [6.5]; P < .001). There were significant differences in global and annular PCD in pairwise comparisons between all 4 groups (eTable 2 in the Supplement), except between the patients with myopia without glaucoma and the control group (mean difference, −2.6; 95% CI, −7.5 to 2.3; P = .52 for global PCD vs mean difference, −2.3; 95% CI, −7.5 to 2.9; P = .65 for annular PCD).
Figure 2. Optical Coherence Tomography Angiography Color Perfused Capillary Density Map.
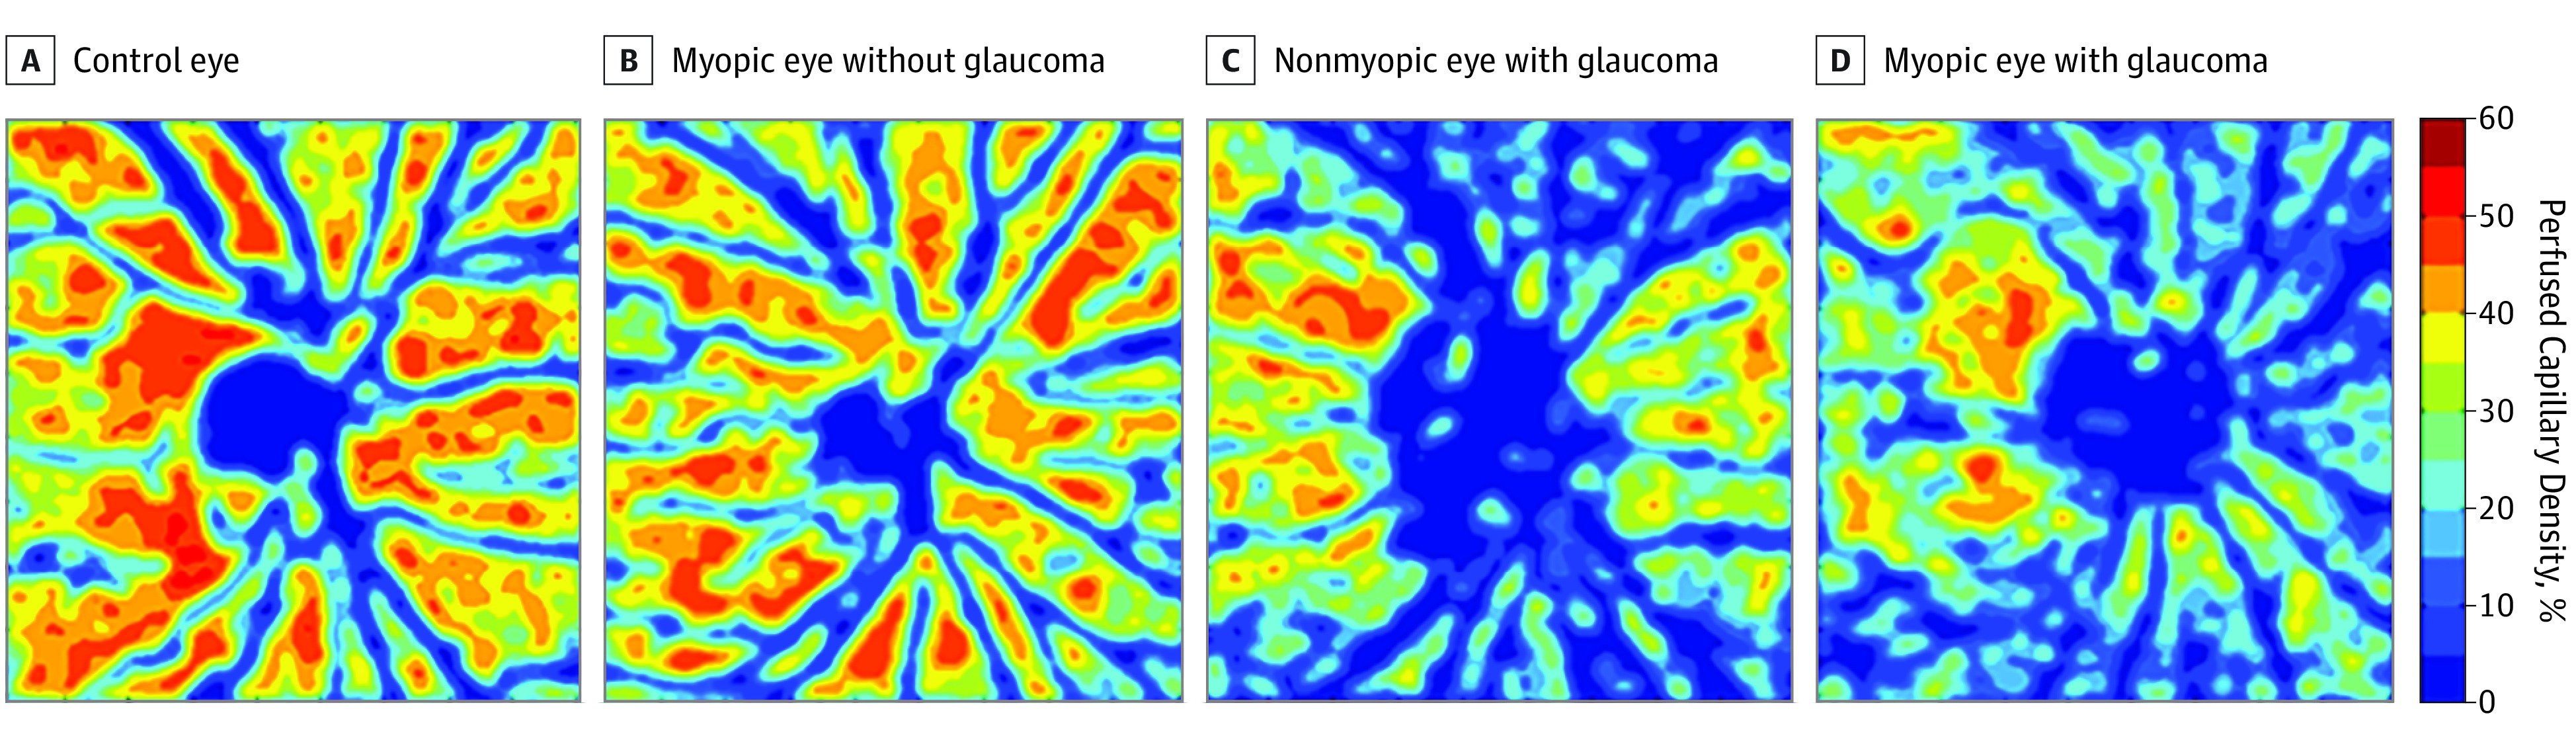
Focusing on the percentage difference in PCD between the patients with glaucoma without myopia and the control group, the superior and nasal sectors exhibited a greater percentage difference than the inferior and temporal sectors (mean difference, −1.8; 95%, CI −3.2 to −0.4; P < .01; Table 2; eTable 3 in the Supplement). In contrast, between the group with myopia without glaucoma and the control group, only the superior sector exhibited greater percentage difference than the temporal sector (mean difference, −2.4; 95% CI, −4.2 to −0.5; P = .02). Between the patients with myopia with glaucoma and the control group, the superior and nasal sectors exhibited the greater percentage difference than the inferior and temporal sectors (mean difference, −2.8; 95% CI, −4.6 to −0.9; P = .004).
Table 2. Differences in Global, Annular, and Sectoral Peripapillary PCD Between Each Experimental Group and the Control Group.
| Group | Mean PCD (% Differencea) | |||||||
|---|---|---|---|---|---|---|---|---|
| Global | Annular | Superior | Nasal | Inferior | Temporal | Mean Difference in Global PCD (95% CI)b | P Valueb | |
| Control | 41.0 (NA) | 42.6 (NA) | 42.3 (NA) | 42.2 (NA) | 43.1 (NA) | 42.9 (NA) | [Reference] | NA |
| Glaucoma without myopia | 31.9 (22.2) | 33.5 (21.4) | 32.6 (22.9) | 32.0 (24.2) | 34.5 (20.0) | 35.1 (18.2) | −8.6 (−10.9 to −6.3) | <.001 |
| Myopia without glaucoma | 38.4 (6.3) | 40.3 (5.4) | 39.8 (5.9) | 39.3 (6.9) | 40.0 (7.2) | 42.2 (1.6) | −2.8 (−6.9 to 1.2) | .17 |
| Myopic glaucoma | 28.2 (31.2) | 30.1 (29.3) | 28.3 (33.1) | 28.8 (31.8) | 31.5 (26.9) | 31.6 (26.3) | −11.1 (−14.0 to −8.1) | <.001 |
Abbreviations: NA, not applicable; PCD, perfused capillary density.
Indicates the percentage difference between the control group mean and another group.
Mean difference and accompanying P values are with respect to global PCD only.
The mean difference in global PCD between each of the 3 experimental groups and the control group was greatest in patients with myopia and glaucoma (−11.6; 95% CI, −14.0 to −8.1; P < .001), followed by patients with glaucoma without myopia (−8.6; 95% CI, −10.9 to −6.3; P < .001) and those with myopia without glaucoma (−2.8; 95% CI, −6.9 to 1.2; P = .17), respectively (Table 2). However, no interaction was found between glaucoma and myopia when adjusted for patient age, axial length, and disease stage (mild, moderate, or severe).
Discussion
Optical coherence tomography angiography enables noninvasive and quantitative imaging of the retinal microvascular network. Most studies of myopia that use OCTA stress the decreased vessel density in the macula rather than in the optic nerve head.12,26,27 Even though the alteration in glaucoma and myopia affect the entire retinal tissue, we chose in this study to evaluate the radial peripapillary capillary that directly supplies the retinal ganglion cells.
Through the use of OCTA and a customized analysis algorithm, our overall findings demonstrate a nonsignificant reduction in PCD in moderately to highly myopic eyes compared with a control group. We also observed an overall trend toward decreased PCD from control groups and patients with myopia without glaucoma, to those with glaucoma without myopia, to those with myopia and glaucoma. In contrast, Akagi et al11 reported statistically similar peripapillary vessel density between a group of patients with primary OAG with high myopia and a group of patients with primary OAG without myopia. These conflicting findings can be explained. First, Akagi et al11 used intrinsic software provided by OptoVue for image analysis, while our study used a customized MATLAB program to remove large vessels. Second, the previous study enrolled solely patients with highly myopic eyes, while this one enrolled patients with moderately to highly myopic eyes. Third, the previous study had a small sample size, and there was a trend toward greater decreased vessel density in the high myopia group.
Regarding the percentage differences in sectoral PCD, there were greater percentage differences in the superior and nasal sectors than in the inferior and temporal sectors of patients with glaucoma without myopia and those with myopia with glaucoma compared with control participants. In contrast, in patients with myopia without glaucoma compared with control participants, only the superior sector exhibited greater percentage difference than the temporal sector. Interpreted together, these findings suggest that distinct patterns in PCD reduction exist in myopia without glaucoma vs glaucoma without myopia. In addition, a recent study24 reported a percentage difference in PCD between controls and patients with mild primary OAG. The superior quadrant exhibited the greatest percentage difference, followed by the inferior and nasal quadrants.
When considering the mean difference in global PCD between each of patients with glaucoma without myopia, myopia without glaucoma, and myopia with glaucoma compared with controls, there was a greater percentage difference in those with both conditions than in those with glaucoma without myopia and myopia without glaucoma. This implies that both glaucoma and myopia produce an effect on PCD and that myopia contributes a lesser effect on PCD than glaucoma. However, no interaction was found between glaucoma and myopia when adjusted for patient age and disease stage.
With the progression of myopia, elongation of the globe mechanically stretches retinal tissue, resulting in decreased vascular endothelial growth factor production and a putative decrease in retinal microvascular density.28,29 Alternatively, the decline in microvascular density may be caused by reduced oxygen demand because of myopic retinal degeneration. Other peripapillary vascular abnormalities, including retinal pigment epithelium atrophy with presumed underlying choriocapillaris loss, have been identified in myopic eyes. One hypothesis underlying these vascular changes posits that RNFL loss may reduce regional oxygen demand, thus triggering retinal vascular attenuation via autoregulatory mechanisms.12 Peripapillary atrophy may play a role the decreased peripapillary blood flow in myopic eyes and may be considered a confounding factor. Conversely, peripapillary atrophy might be a possible reason for the formation of chorioretinal atrophy in myopia.12
Limitations
This study has several limitations. First, segmentation error of retinal capillaries may occur in eyes with high myopia. The OCTA modality use in the present study has limitations in the analysis of error segmented layers, which is unavoidable in some myopic eyes. To exclude the influence of such artifacts, we mainly analyzed eyes with segmentation errors located outside the ROI. Second, we included a relatively high proportion of patients with younger ages in the myopia without glaucoma groups. Since advanced age could affect the peripapillary microvasculature, we sought to eliminate the effect of age on PCD through multiple linear regression analysis.
Conclusions
In summary, this study provides a quantitative analysis of microvascular disturbance in myopia and open-angle glaucoma. Our findings suggest that microvascular attenuation to a greater extent in OAG compared with that in myopia. The simultaneous presence of myopia and OAG results in a level of microvascular attenuation greater than is observed with either pathology alone. Given the cross-sectional design, these results cannot distinguish if this association is a cause and effect or is because of confounding factors. Further research is necessary to elucidate the associations and interactions between glaucomatous progression in myopia and PCD changes over time, as well as the possible role of decreased PCD in the pathogenesis of myopia.
eTable 1. Comparisons between MNG vs Control and NMG and MG.
eTable 2. Post hoc Comparisons of Global and Annular PCD.
eTable 3. Post hoc Comparisons of Sectoral PCD among NMG, MNG, and MG.
References
- 1.Holden BA, Fricke TR, Wilson DA, et al. Global prevalence of myopia and high myopia and temporal trends from 2000 through 2050. Ophthalmology. 2016;123(5):1036-1042. [DOI] [PubMed] [Google Scholar]
- 2.Tokoro T. On the definition of pathologic myopia in group studies. Acta Ophthalmol Suppl. 1988;185:107-108. [DOI] [PubMed] [Google Scholar]
- 3.Marcus MW, de Vries MM, Junoy Montolio FG, Jansonius NM. Myopia as a risk factor for open-angle glaucoma: a systematic review and meta-analysis. Ophthalmology. 2011;118(10):1989-1994.e2. [DOI] [PubMed] [Google Scholar]
- 4.Mitchell P, Hourihan F, Sandbach J, Wang JJ. The relationship between glaucoma and myopia: the Blue Mountains Eye Study. Ophthalmology. 1999;106(10):2010-2015. [DOI] [PubMed] [Google Scholar]
- 5.Crawford Downs J, Roberts MD, Sigal IA. Glaucomatous cupping of the lamina cribrosa: a review of the evidence for active progressive remodeling as a mechanism. Exp Eye Res. 2011;93(2):133-140. [DOI] [PMC free article] [PubMed] [Google Scholar]
- 6.Jonas JB, Nguyen XN, Naumann GO. Parapapillary retinal vessel diameter in normal and glaucoma eyes. I. Morphometric data. Invest Ophthalmol Vis Sci. 1989;30(7):1599-1603. [PubMed] [Google Scholar]
- 7.Chidlow G, Wood JPM, Casson RJ. Investigations into hypoxia and oxidative stress at the optic nerve head in a rat model of glaucoma. Front Neurosci. 2017;11:478. [DOI] [PMC free article] [PubMed] [Google Scholar]
- 8.Azemin MZ, Daud NM, Ab Hamid F, Zahari I, Sapuan AH. Influence of refractive condition on retinal vasculature complexity in younger subjects. ScientificWorldJournal. 2014;2014:783525. [DOI] [PMC free article] [PubMed] [Google Scholar]
- 9.Shimada N, Ohno-Matsui K, Harino S, et al. Reduction of retinal blood flow in high myopia. Graefes Arch Clin Exp Ophthalmol. 2004;242(4):284-288. [DOI] [PubMed] [Google Scholar]
- 10.Li M, Yang Y, Jiang H, et al. Retinal microvascular network and microcirculation assessments in high myopia. Am J Ophthalmol. 2017;174:56-67. [DOI] [PMC free article] [PubMed] [Google Scholar]
- 11.Akagi T, Iida Y, Nakanishi H, et al. Microvascular density in glaucomatous eyes with hemifield visual field defects: an optical coherence tomography angiography study. Am J Ophthalmol. 2016;168:237-249. [DOI] [PubMed] [Google Scholar]
- 12.Wang X, Kong X, Jiang C, Li M, Yu J, Sun X. Is the peripapillary retinal perfusion related to myopia in healthy eyes? a prospective comparative study. BMJ Open. 2016;6(3):e010791. [DOI] [PMC free article] [PubMed] [Google Scholar]
- 13.James CB, Trew DR, Clark K, Smith SE. Factors influencing the ocular pulse--axial length. Graefes Arch Clin Exp Ophthalmol. 1991;229(4):341-344. [DOI] [PubMed] [Google Scholar]
- 14.Meng W, Butterworth J, Malecaze F, Calvas P. Axial length of myopia: a review of current research. Ophthalmologica. 2011;225(3):127-134. [DOI] [PubMed] [Google Scholar]
- 15.Akyol N, Kükner AS, Ozdemir T, Esmerligil S. Choroidal and retinal blood flow changes in degenerative myopia. Can J Ophthalmol. 1996;31(3):113-119. [PubMed] [Google Scholar]
- 16.Yu PK, Balaratnasingam C, Xu J, et al. Label-free density measurements of radial peripapillary capillaries in the human retina. PLoS One. 2015;10(8):e0135151. [DOI] [PMC free article] [PubMed] [Google Scholar]
- 17.Tong JB, Chen D, Zeng LP, et al. Differential changes of local blood supply in rat retinae are involved in the selective loss of retinal ganglion cells following the acute high intraocular pressure. Curr Eye Res. 2010;35(5):425-434. [DOI] [PubMed] [Google Scholar]
- 18.Scripsema NK, Garcia PM, Bavier RD, et al. Optical coherence tomography angiography analysis of perfused peripapillary capillaries in primary open-angle glaucoma and normal-tension glaucoma. Invest Ophthalmol Vis Sci. 2016;57(9):OCT611-OCT620. [DOI] [PubMed] [Google Scholar]
- 19.Jia Y, Wei E, Wang X, et al. Optical coherence tomography angiography of optic disc perfusion in glaucoma. Ophthalmology. 2014;121(7):1322-1332. [DOI] [PMC free article] [PubMed] [Google Scholar]
- 20.Liu L, Jia Y, Takusagawa HL, et al. Optical coherence tomography angiography of the peripapillary retina in glaucoma. JAMA Ophthalmol. 2015;133(9):1045-1052. [DOI] [PMC free article] [PubMed] [Google Scholar]
- 21.de Carlo TE, Romano A, Waheed NK, Duker JS. A review of optical coherence tomography angiography (OCTA). Int J Retina Vitreous. 2015;1:5. [DOI] [PMC free article] [PubMed] [Google Scholar]
- 22.Mastropasqua R, Di Antonio L, Di Staso S, et al. Optical coherence tomography angiography in retinal vascular diseases and choroidal neovascularization. J Ophthalmol. 2015;2015:343515. [DOI] [PMC free article] [PubMed] [Google Scholar]
- 23.Bazvand F, Mirshahi R, Fadakar K, Faghihi H, Sabour S, Ghassemi F. The quantitative measurements of vascular density and flow area of optic nerve head using optical coherence tomography angiography. J Glaucoma. 2017;26(8):735-741. [DOI] [PubMed] [Google Scholar]
- 24.Geyman LS, Garg RA, Suwan Y, et al. Peripapillary perfused capillary density in primary open-angle glaucoma across disease stage:an optical coherence tomography angiography study. Br J Ophthalmol. 2017;101(9):1261-1268. [DOI] [PubMed] [Google Scholar]
- 25.Jia Y, Tan O, Tokayer J, et al. Split-spectrum amplitude-decorrelation angiography with optical coherence tomography. Opt Express. 2012;20(4):4710-4725. [DOI] [PMC free article] [PubMed] [Google Scholar]
- 26.Yang Y, Wang J, Jiang H, et al. Retinal microvasculature alteration in high myopia. Invest Ophthalmol Vis Sci. 2016;57(14):6020-6030. [DOI] [PubMed] [Google Scholar]
- 27.Mo J, Duan AL, Chan SY, Wang XF, Wei WB. Application of optical coherence tomography angiography in assessment of posterior scleral reinforcement for pathologic myopia. Int J Ophthalmol. 2016;9(12):1761-1765. [DOI] [PMC free article] [PubMed] [Google Scholar]
- 28.Chen W, Song H, Xie S, Han Q, Tang X, Chu Y. Correlation of macular choroidal thickness with concentrations of aqueous vascular endothelial growth factor in high myopia. Curr Eye Res. 2015;40(3):307-313. [DOI] [PubMed] [Google Scholar]
- 29.Shin YJ, Nam WH, Park SE, Kim JH, Kim HK. Aqueous humor concentrations of vascular endothelial growth factor and pigment epithelium-derived factor in high myopic patients. Mol Vis. 2012;18:2265-2270. [PMC free article] [PubMed] [Google Scholar]
Associated Data
This section collects any data citations, data availability statements, or supplementary materials included in this article.
Supplementary Materials
eTable 1. Comparisons between MNG vs Control and NMG and MG.
eTable 2. Post hoc Comparisons of Global and Annular PCD.
eTable 3. Post hoc Comparisons of Sectoral PCD among NMG, MNG, and MG.